

Abstract
Objective. To compare the relative effectiveness of the Polysymptomatic Distress Scale (PSD) with the Symptom Impact Questionnaire (SIQR), the disease-neutral revision of the updated Fibromyalgia Impact Questionnaire (FIQR), in their ability to assess disease activity in patients with rheumatic disorders both with and without fibromyalgia (FM).
Methods. The study included 321 patients from 8 clinical practices with some 16 different chronic pain disorders. Disease severity was assessed by the Medical Outcomes Study Short Form-36 (SF-36). Univariate analyses were used to assess the magnitude of PSD and SIQR correlations with SF-36 subscales. Hierarchical stepwise regression was used to evaluate the unique contribution of the PSD and SIQR to the SF-36. Random forest regression probed the relative importance of the SIQR and PSD components as predictors of SF-36.
Results. The correlations with the SF-36 subscales were significantly higher for the SIQR (0.48 to 0.78) than the PSD (0.29 to 0.56; p < 0.001). Stepwise regression revealed that the SIQR was contributing additional unique variance on SF-36 subscales, which was not the case for the PSD. Random forest regression showed SIQR Function, Symptoms, and Global Impact subscales were more important predictors of SF-36 than the PSD. The single SIQR pain item contributed 55% of SF-36 pain variance compared to 23% with the 19-point WPI (the Widespread Pain Index component of PSD).
Conclusion. The SIQR, the disease-neutral revision of the updated FIQ, has several important advantages over the PSD in the evaluation of disease severity in chronic pain disorders.
- POLYSYMPTOMATIC DISTRESS
- MEDICAL OUTCOMES STUDY SHORT FORM-36
- POLYSYMPTOMATIC DISTRESS SCALE
- SYMPTOM IMPACT QUESTIONNAIRE
- FIBROMYALGIA IMPACT QUESTIONNAIRE
- FIBROMYALGIA
It is increasingly apparent that the clinical presentation of many rheumatic disorders is modified by the concomitant presence of fibromyalgia (FM)1,2,3,4,5,6,7. This is not surprising, because prominent FM symptoms include musculoskeletal pain, stiffness, and fatigue8. While awareness that a patient with rheumatoid arthritis (RA), for instance, has FM is relevant to management issues, it is also pertinent to the assessment of disease activity. For example, the presence of FM is associated with worse scores on the Disease Activity Score in 28 joints (DAS28) as well as the Health Assessment Questionnaire (HAQ) and Medical Outcomes Study Short Form-36 (SF-36) in patients with RA6,9. In a similar vein, FM has been reported to influence Western Ontario and McMaster Universities Osteoarthritis Index scores in osteoarthritis10 and influence the estimation of disease activity in systemic lupus erythematosus (SLE)11. Assessing the level of FM activity is a necessary prerequisite to understanding the interplay between FM and another rheumatic disorder, for a full understanding of the composite expression of symptoms. The most widely used tool for assessing FM activity is the FM Impact Questionnaire (FIQ) and its updated version, the FIQR12. Several independent analyses of the FIQR have shown it to be a reliable instrument with excellent construct validity and reproducibility13,14,15. The SIQR is the FM-neutral version of the FIQR and does not assume the patient has FM16. Wolfe and colleagues have recently compared the Polysymptomatic Distress Scale (PSD; previously known as the “FS”) and the total FIQR score with the SF-36 with samples from 2 distinct studies consisting of different case mix17. In our current study we have evaluated the validity of the PSD and the Symptom Impact Questionnaire (SIQR) with reference to the clinical symptom profile provided by the SF-36 using a common sample of patients with 16 different chronic pain disorders.
MATERIALS AND METHODS
The subjects for our study came from the offices of 5 rheumatologists (n = 165), 2 pain specialists (n = 148), and 1 psychologist (n = 8), for a total of 321 patients. Adult patients ≥ 18 years old were enrolled as a convenience sample with individual investigators during routine clinic visits. All enrolled patients had 1 or more chronic disorders: FM; osteoarthritis (OA) in the hands, hips, or knees; RA; SLE; Sjögren syndrome; ankylosing spondylitis (AS); psoriatic arthritis (PsA); focal myofascial pain; widespread pain/not FM; chronic low back pain; chronic upper back pain; polymyalgia rheumatica; chronic migraine headaches; peripheral neuropathy; or major depressive disorder (MDD). Subjects without one of these diagnoses were excluded from the study. Enrollment was not restricted by sex, comorbidities, medications, or disease severity. All physicians used the 1990 American College of Rheumatology classification criteria for the diagnosis of FM. MDD was based on the Diagnostic and Statistical Manual, fourth edition. All other diagnoses were based on published guidelines.
Data collection used SurveyMonkey. The study investigator answered the first 2 questions, identifying the site and selecting patient diagnosis or diagnoses. All other questions were completed by the subject using the following 4 questionnaires: (1) demographics (age, sex, educational level, work status, marital status, number of years with chronic pain and other chronic pain disorders); (2) the PSD, range 0–3118; (3) the SF-3618; and (4) the SIQR, range 0–10012.
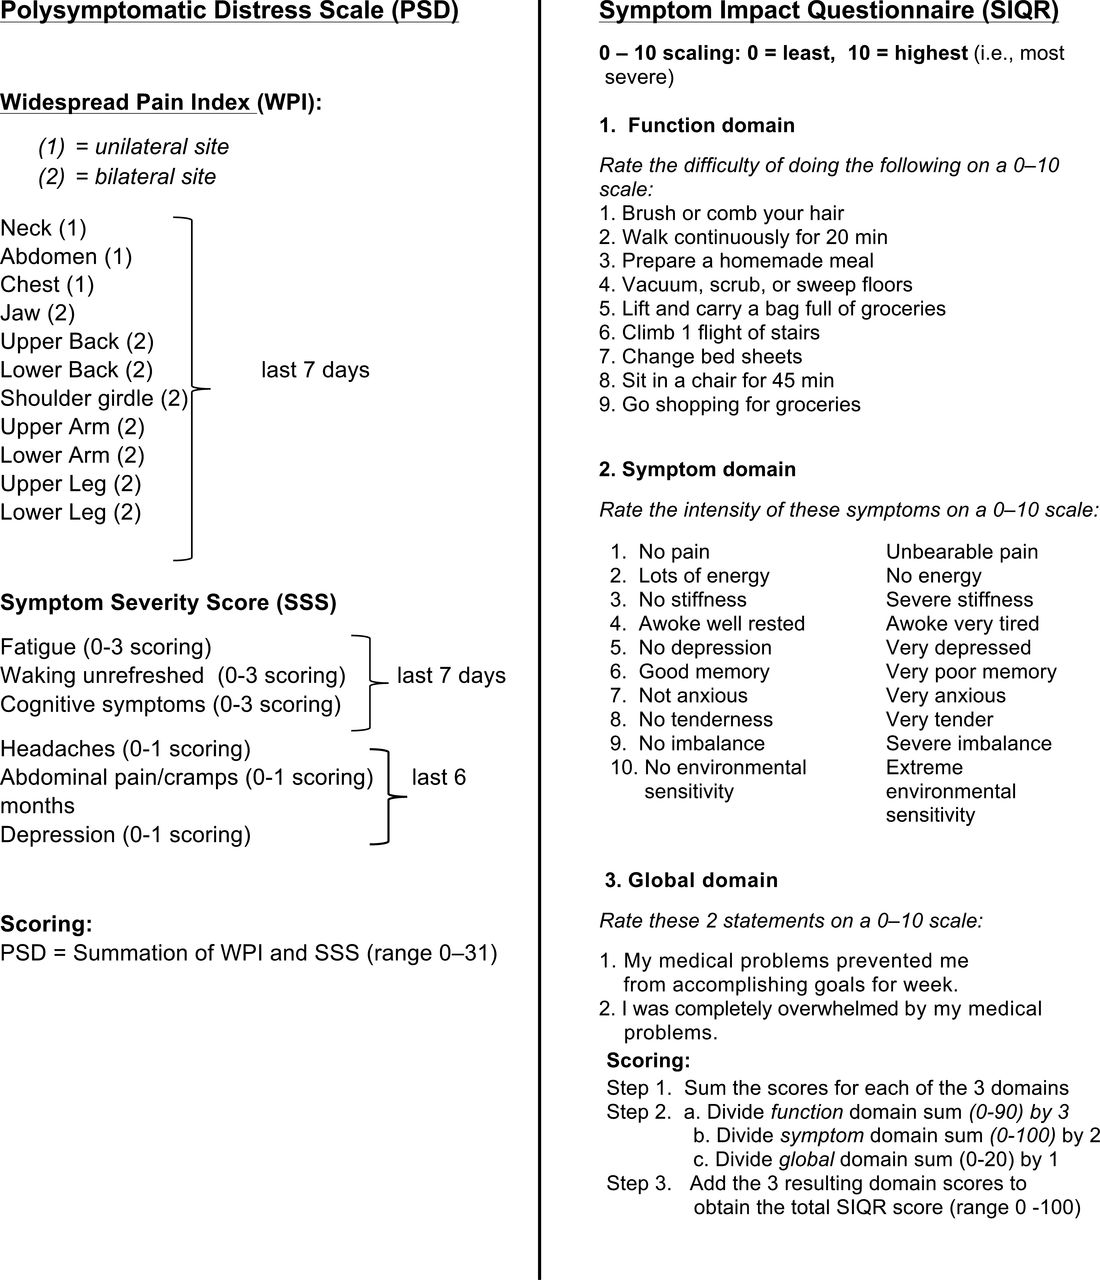
The SIQR (Function + Global Impact + Symptoms) and PSD [Widespread Pain Index (WPI) + Symptom Severity Score (SSS)] differ by the inclusion of Function and Global Impact subscales in the SIQR, and the WPI in the PSD (Figure 1). The 10-item SIQR symptom subscale and 6-item SSS symptom subscale both include items assessing sleep, fatigue/energy, cognition/memory, and depression. The SIQR differs by also assessing pain, stiffness, balance, anxiety, tenderness to touch, and environmental sensitivity, but not headaches and abdominal cramping or pain, which are contained in the SSS. All SIQR symptoms are assessed on a 10-point scale during the last 7 days, 3 SSS symptoms on a 0–3 scale during the past week, and 3 SSS symptoms on a 0–1 scale during the past 6 months. The SF-36 is a generic, comprehensive questionnaire consisting of 36 questions relating to 8 heterogeneous/distinctive health issues: vitality, physical functioning, bodily pain, general health, emotional role, social role functioning, and mental health. Each question is transformed into a 0–100 scale; lower physical role scores reflect more severe dysfunction19. In a review of 34 studies using the SF-36 worldwide, the SF-36 discriminated quite well between FM and other pain groups and healthy samples20.

Comparison of PSD (Polysymptomatic Distress Scale)17 and the SIQR (Symptom Impact Questionnaire Revised). The SIQR is the disease-neutral version of the Fibromyalgia Impact Questionnaire (FIQR; revision of the FIQ)16. From, respectively, Wolfe, et al. J Rheumatol 2011;38:1113–22; and Friend and Bennett. Arthritis Res Ther 2011;13:R58; with permission.
Data analysis
Univariate analyses compared the correlations between the PSD and SF-36 and the SIQR and SF-36 using Steiger’s Z test for differences between pairs of correlations that include a common variable (i.e., SF-36)21. The coefficient of determination (r2 × 100) was used to compare how much variance was explained by PSD and SIQR in SF-36 subscales. Multivariate hierarchical stepwise regression analyses were conducted to evaluate the overall and unique contribution of the PSD and SIQR to the SF-36 subscales. Random forest regression was used to illustrate the relative importance of the SIQR, SIQR components, and PSD as predictors of SF-36. All data were analyzed with STATISTICA version 12 (Statsoft) and Hoerger’s calculator for Steiger’s Z test22 for testing the statistical significance of the difference between dependent correlations. Cronbach’s alpha coefficient was used to assess the internal consistency of the SIQR and SSS.
RESULTS
The study included 321 subjects. They had a broad range of chronic pain problems: FM (135), OA (88), RA (55), SLE (21), Sjögren syndrome (13), AS (8), PsA (12), focal myofascial pain (11), widespread pain (not FM; 21), chronic low back pain (69), chronic upper back pain (37), polymyalgia rheumatica (5), chronic migraine headaches (64), peripheral neuropathy (33), and MDD (50). Fifty percent of the patients with FM reported a concomitant medical diagnosis; the 5 most common being diabetes (8.1%), cancer (6.7%), asthma (6.7%), heart disease (5.2%), and hypertension (4.4%). Only 16.2% of the patients with FM were without at least 1 other medical disorder or a non-FM pain disorder. Most were middle-aged and female, with a duration of pain symptoms of about 15 years. Patients without FM were more likely to be older males. Median educational level was 3, indicating that most subjects had attended some college. Cronbach’s alpha coefficient, a measure of the overall interitem correlations or a scale’s internal consistency, was 0.95 for the SIQR and 0.68 for the SSS, indicating excellent internal consistency for the SIQR but only moderate internal consistency for the SSS.
Table 1 shows correlations comparing the SIQR and PSD scales with each of the 8 SF-36 subscales (columns 2 and 3) for the SIQR symptom and SSS subscales (columns 4 and 5). SF-36 scoring was reversed so that all higher scores reflect greater severity (Supplementary table of means available from the authors on request). All 8 SIQR correlations with SF-36 were significantly larger than were the corresponding 8 PSD correlations with SF-36 subscales. The largest difference was with SF-36 physical (0.68 vs 0.40) and pain (0.78 vs 0.56). The largest difference for the SIQR symptom and SSS symptom scales was also on SF-36 pain (0.73 vs 0.55). Smaller or nonsignificant correlations were found with Energy/Fatigue. This is not surprising because 6 of the 12 SSS points are devoted to fatigue and sleep. Similar correlational differences were observed for FM and no-FM groups, with the SIQR having stronger correlations with SF-36 pain than the PSD (No-FM 0.74 vs 0.54; FM 0.76 vs 0.33). Overall, 25 of the 30 paired comparisons were significantly larger for the SIQR scales compared to PSD scales. None of the PSD showed significantly stronger correlations with the SF-36. The magnitude of this comparison is illustrated in Figure 2A by the coefficient of determination (r2 × 100), which represents the percent variance explained by the PSD and SIQR for each of the SF-36 subscales. It is seen that the SIQR compared to the PSD accounts for considerably more variance in SF-36 scales.
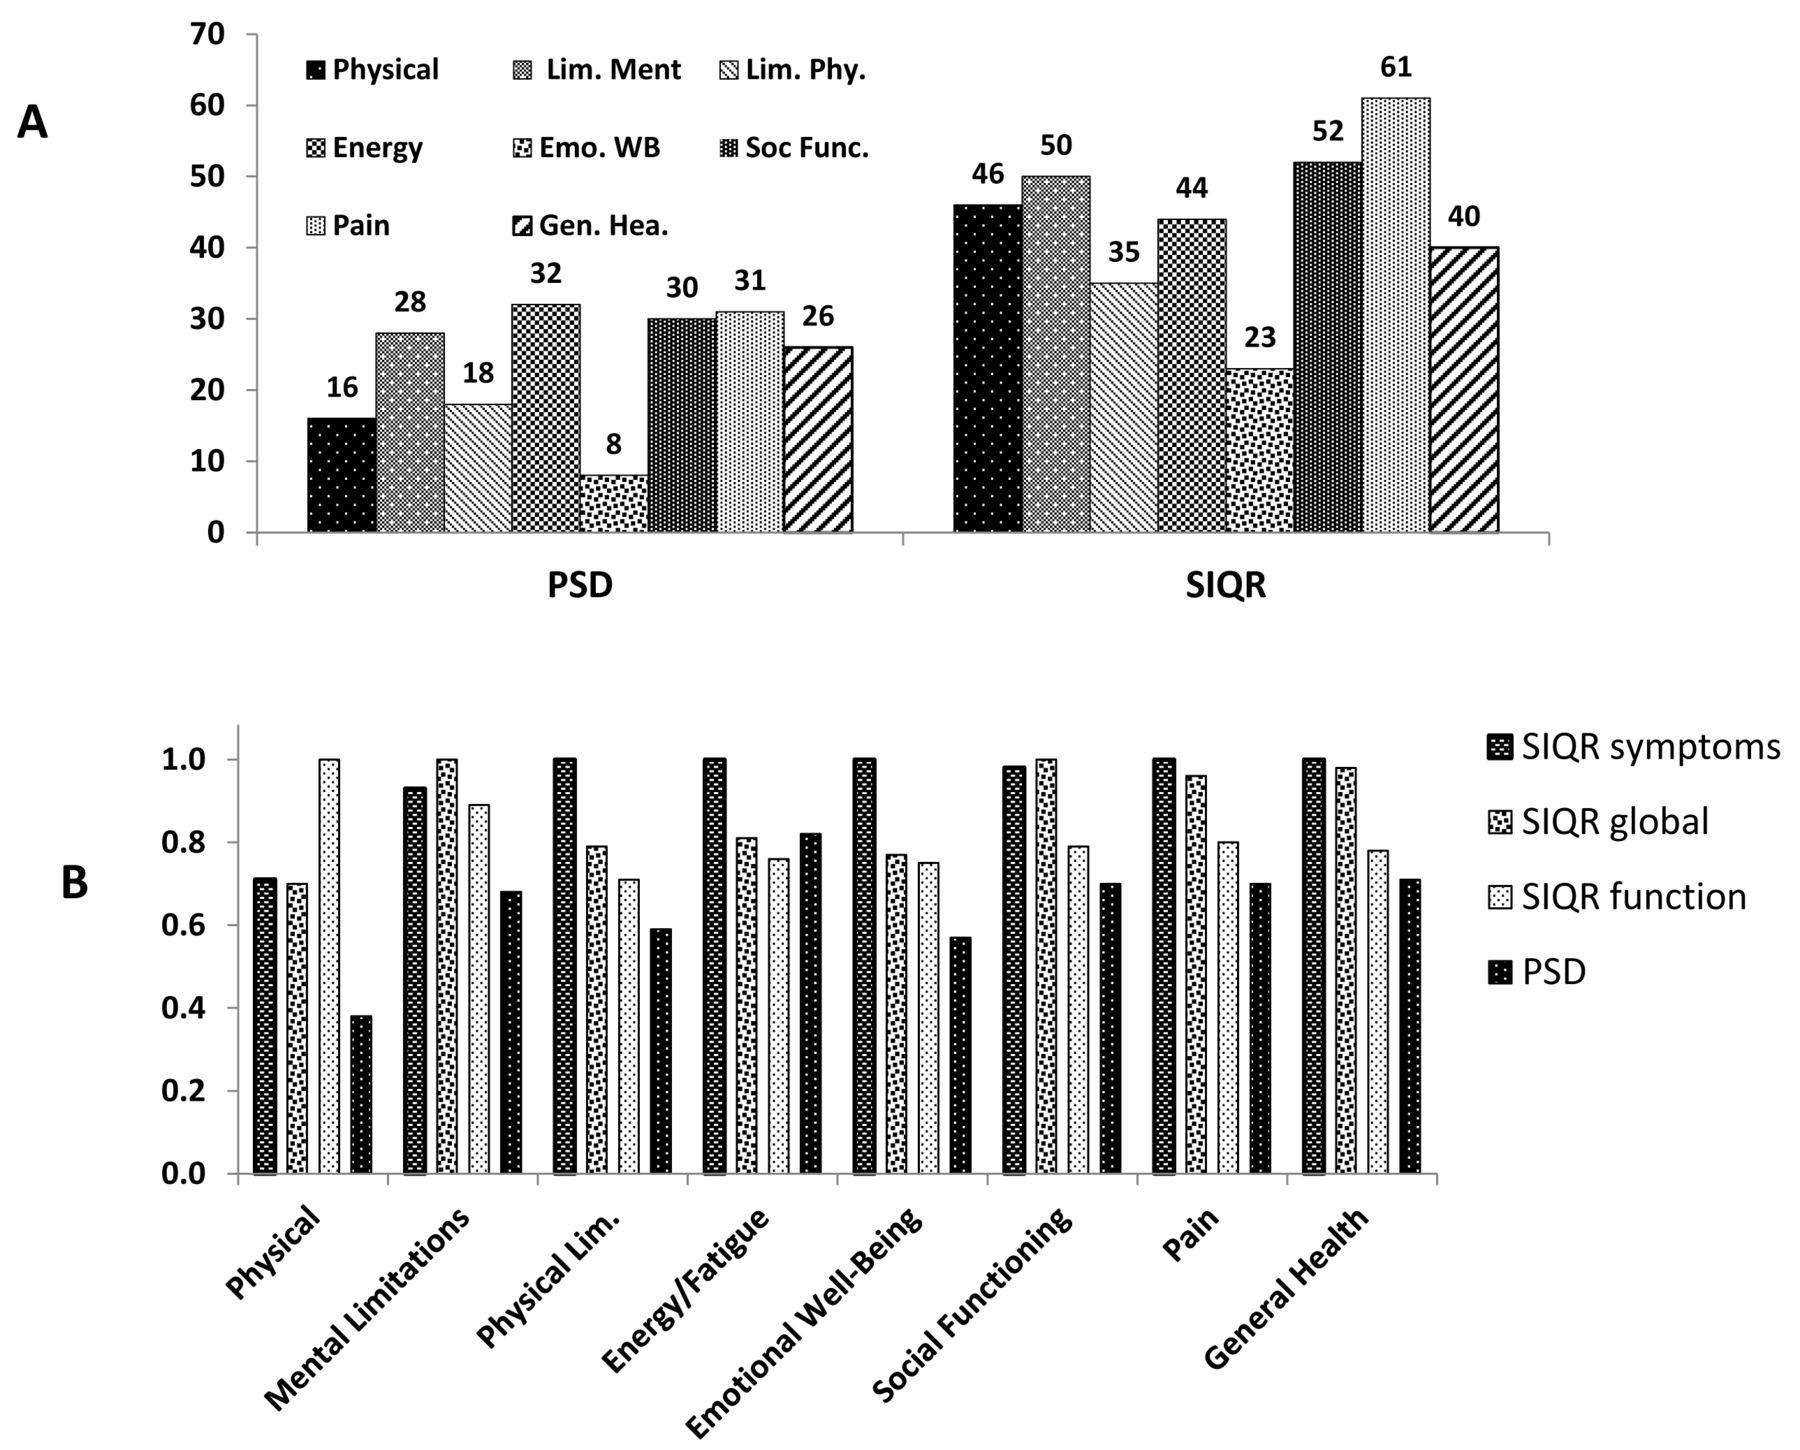
A. Comparison of variance explained (r2 × 100) between SIQR and PSD with 8 SF-36 subscales. Numbers above bars are percent explained of respective SF-36 subscales. The SIQR explains about twice as much variance in SF-36 than the PSD. B. Random forest regression importance plot comparing the relative importance of the 3 SIQR subscales (Functions, Symptoms, Global Impact) with the PSD as predictors of each of the 8 SF-36 subscales. The right bar of each block, representing the PSD, shows least predictive importance, other than with SF-36 energy. The relative importance of the 3 SIQR subscales shows construct validity: for example, the SIQR function subscale is the strongest predictor of SF-36 physical functioning, SIQR Symptom is high in importance in 7 SF-36 subscales including SF-36 pain, and SIQR Global Impact in 4 SF-36 subscales including SF-36 general health. PSD: Polysymptomatic Distress Scale; SIQR: Symptom Impact Questionnaire; SF-36: Medical Outcomes Study Short Form-36.
Correlations of SIQR, PSD, and pain measures with SF-36 subscales.
To further explain the common and unique contribution of PSD and SIQR (r = 0.72) on SF-36 subscales, multivariate analyses were conducted consisting of hierarchical stepwise regression with the PSD and SIQR entered as predictors of SF-36 subscales. In the first set, SIQR was force-entered in the first step and PSD in the second step to determine whether the PSD accounted for “additional unique variance,” once SIQR is controlled for in the first step. The results showed that the PSD accounted for 0% additional variance in 7 subscales and only an additional 2% on Energy/Fatigue, after controlling for the effects of the SIQR in the first step. In the second set of regressions, PSD was force-entered and controlled for in the first step, and the SIQR was entered in the second step to determine the additional, unique variance SIQR may have, over and above the PSD. It was found that the SIQR had additional, unique variance over and above the PSD on all 8 SF-36 subscales: physical (32%), mental limitation (23%), physical limitation (17%), energy/fatigue (13%), emotional well-being (15%), social functioning (22%), pain (30%), and general health (15%). Taken together, the correlation and multivariate analyses indicate that the SIQR accounts for more variance, and importantly more unique variance on all SF-36 subscales than does the PSD. This suggests that the SIQR is a more comprehensive measure of SF-36 severity than the PSD. Importance plots using random forest regression that ranked the relative importance of SIQR and PSD showed that the SIQR was ranked more important than the PSD on all 8 SF-36 subscales (not shown), confirming the linear regression above.
Random forest analysis that compares the relative importance of the 3 SIQR subscales (SIQR Function, Global Impact, and Symptoms) and the PSD are shown in Figure 2B. The 3 SIQR domains were superior to the PSD on all 8 SF-36 categories and the PSD least important on 7. The SIQR Symptom subscale was most important in 5 SF-36 categories, followed by the SIQR Global Impact in 2 and the SIQR Function in 1 category (SF-36 physical). Overall, these random forest results confirm those found with the correlation and regression analyses.
The SF-36 pain severity is the average of 2 items consisting of pain intensity and pain interference (0–100). Table 2 presents SIQR/PSD comparative correlations with SF-36 pain broken down for No-FM and FM groups on the left side and specific pain assessment consisting of the 19-point WPI and 3 single SIQR pain quality symptoms on the right side. As seen, the SIQR has consistently higher correlations than the PSD for the total sample (0.78 and 0.56), as well as the No-FM (0.74 and 0.54) and the FM (0.76 and 0.33) subgroups, with the PSD showing significantly lower correlations, and particularly in the FM subgroup. In this table we also insert, for illustrative purposes, our own 28-site Pain Site measure23, which includes articular joints for comparison with the WPI, which does not use joint locations. Whereas the WPI and Pain Sites consist of summations of 19 and 28 pain locations, respectively, the SIQR pain, stiffness, and tenderness to touch consist of single items measured on a 10-point intensity scale. The WPI and pain sites correlations with SF-36 were similar to each other, and modestly related to SF-36 pain. By contrast, the 3 single items for SIQR pain (0.74), stiffness (0.61), and tenderness to touch (0.64) were all significantly larger than were the 19-point WPI (0.48) or the 28-point pain sites (0.45) correlations with SF-36 pain, with SIQR Pain explaining 55% and the WPI 23% of SF-36 pain. Multiple regressions with the 3 SIQR “pain” symptoms generated a multiple R of 0.79, explaining 61% variance of SF-36 pain, with all 3 predictors uniquely contributing. This emphasizes the validity of including pain intensity qualities in the assessment of pain severity, which, it should be noted, are not included in the PSD. This compares with only 23% and 20% of variance explained in SF-36 by the WPI and pain sites measures. Looking at the FM and No-FM groups separately, it is seen that the SIQR has strong correlations with SF-36 pain, 0.74 and 0.76. While the PSD has moderate correlations for the No-FM group, the correlations of the PSD, WPI, and SSS and the SF-36 pain for the FM group are weak (0.33, 0.23, 0.39). In sum, the SIQR and SIQR Symptoms are stronger predictors of SF-36 pain than are the PSD, WPI, and SSS for the overall, FM, and No-FM groups. Further, the single 0–10 point SIQR “pain” intensity items (pain, stiffness, and tenderness) have stronger correlations than do the multiple, summated pain locations measures, i.e., the WPI and Pain Sites. The PSD as a whole, as well as the WPI and SSS components, had particularly low correlations with the SF-36 pain scale in patients with FM (0.33, 0.23, 0.39), which was not the case for the SIQR as a whole, or for specific SIQR pain qualities. This was unexpected because the PSD, and its progenitor “fibromyalgianess”24 is reported to be a measure of distress.
Correlations of SF-36 pain severity with SIQR and PSD, and SIQR and PSD components for total sample, No FM, and FM subgroups.
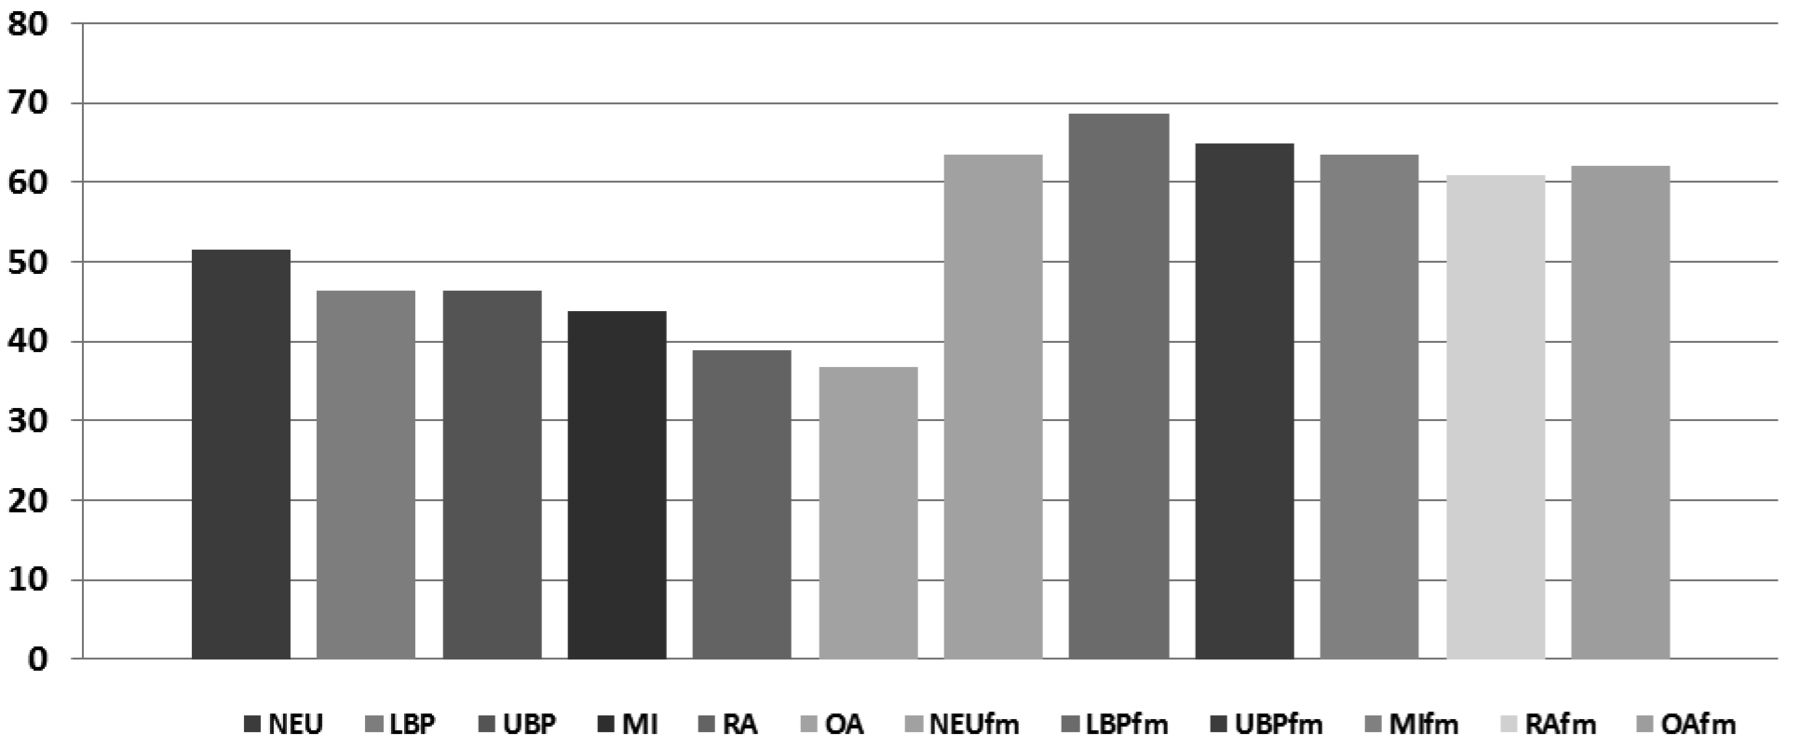
The effect of concomitant FM on the severity of several chronic pain disorders is seen in Figure 3. The total SIQR score has a fairly wide range of variability in the uncomplicated form of the disorder, from a low of 36.8 to a high of 51.5; however, after patients have developed FM, the SIQR score increased by an average of 45% with very little variation in the scores for the individual disorders. In other words, having FM had a highly adverse effect on disease severity in chronic pain patients and overwhelmed the natural variation in severity scores.

Mean SIQR scores (0–100) for 6 primary pain disorders with and without FM. Group means ranged from a low of 36.8 for OA without FM to 68.5 for LBP with FM, with wide individual differences within each disorder. There is greater mean variation among pain disorders without FM than with FM, which shows relatively similar high SIQR means. SIQR: Symptom Impact Questionnaire; FM: fibromyalgia; OA: osteoarthritis; LBP: low back pain; NEU: neuropathy; UBP: upper back pain; MI: migraine; RA: rheumatoid arthritis.
DISCUSSION
The development of FM in a patient with an uncomplicated chronic pain disorder increases the perceived intensity of symptoms by about 45%. Not only does this have adverse effects on the patient’s function and psychological status but also introduces increased complexity into management decisions. Herein, using a common sample of diverse patients with 16 chronic pain disorders, we provide evidence that the SIQR is inherently superior to the PSD in evaluating the severity of FM in relation to common clinical symptoms from the SF-36.
There are several probable reasons for the superiority of the SIQR. The SIQR identifies more SF-36 variance than does the PSD. This differs from Wolfe, et al’s analysis, which reported similar correlations with the PSD and our FIQR study using only FM subjects17. One probable reason is our current study sampled a more diverse set of chronic pain patients than was hitherto studied and used the SIQR for both patients with FM and those without. The hierarchical regression analyses showed additional unique variance of the SIQR over the PSD for 7 of the SF-36 subscales. The PSD is a summation of the SSS and the WPI taken from the 2010 criteria for FM25. Another explanation for the PSD’s weaker association with SF-36 severity is the assumption that the WPI, which predominates in the scoring of the PSD (19 out of 31 points, i.e., 61%), is a valid measure of pain severity. The original intent of the WPI was to distinguish FM from non-FM (RA and OA subjects) by assessing the number of axial and near-axial pain locations. It was also assumed that more pain points indicated more overall pain. However, as our current study shows, there is only a modest relationship between number of pain locations, whether measured by the WPI or our own 28 Pain Sites measure (which includes 10 peripheral pain points), and SF-36 pain (Table 2). Moreover, adding the WPI to the SSS does not increase the SSS’s correlations with SF-36 subscales, and sometimes even detracts from them. Thus while the WPI may be a very good tool for diagnostic or classification purposes, it is less effective as a measure of severity. Because the SSS component itself does not include a measure of pain, it is understandable that the PSD is only moderately related to SF-36 severity.
Further, the FIQR/SIQR includes additional symptoms to the original FIQ such as “stiffness,” “tenderness to touch,” “environmental sensitivity,” and “balance”12; these symptoms are not found in the PSD. Notably, the FIQR/SIQR items are all assessed on a 10-point intensity scale, whereas the SSS assessment is variable; sometimes on a 3-point frequency scale and other times on a 2-point scale. Lastly, the time frame covered by the symptom assessment differs between the 2 questionnaires: the FIQR/SIQR requires patients to respond to all symptoms with reference to the “past 7 days” whereas the SSS symptoms are assessed with reference to the “past week” and other times to the “past 6 months.” The 3 items from the PSD that are assessed by yes/no responses with reference to a 6-month period may be particularly problematic. The abdominal pain/cramps item repeats the abdominal pain item from the WPI26. However, there was only a 53% concordance between the 2 assessments in this sample. Nearly all patients (93%) endorsed depression, but only 48% endorsed headaches during the past 6 months. The fatigue, unrefreshed sleep, and depression items from the SSS combined for an average of 4.15 of a total 5.84 SSS score (i.e., a 71%), suggesting that the SSS may be overly weighted toward depressed mood and sleep. All these scaling issues may have contributed to the moderate Cronbach alpha coefficient found with the SSS (0.68) compared with the SIQR (0.95) and SIQR Symptoms (0.89). The SF-36 energy/fatigue was the only item that did as well with the PSD. This is not surprising given that 6 of the 12 potential PSD points are covered by just 2 items, “fatigue” and “unrefreshed sleep,” which in the current study contributed to more than half of the actual SSS score (3.2 of 5.8).
The ambiguity regarding the use of the WPI as part of the PSD comes from its simultaneous use as a measure of pain severity and a diagnostic tool for differentiating FM from No-FM25 and other disorders. In the first case, it is assumed that the number of pain locations is a sensitive measure of pain, with more locations equating with more “pain or tenderness.” However, the WPI is only weakly related to SF-36 pain, placing doubt on its adequacy as a measure of distress caused by pain; by contrast the SIQR pain, tenderness, and stiffness (0–10 intensity rating) items were substantially related to SF-36 pain. Secondly, FM is characterized by “pain all over” whereas other disorders usually have more localized pain. By definition, therefore, patients with FM will always have more severe pain based on the WPI. Thus any pain disorder that has more pain sites will necessarily have a greater average PSD score. On the other hand, there is little room in the WPI for the assessment of high pain intensity in patients with few pain sites, or from articular sites that are not included in the WPI. For instance, a gout attack in the big toe has extremely high pain intensity, but in the PSD it would have a score of 1.
There are several limitations to our study. As with all cross-sectional studies, we cannot infer a causal relation between the SIQR and the PSD with the SF-36 subscales, and no physiological variables were measured. A prospective study could determine which of the scales is more comprehensive and sensitive to changes in severity, as well as their test-retest reliability. Such a study could therefore evaluate whether changes in the SIQR 0–10 item intensity rating are better suited for patient management and research purposes than changes in PSD frequency scaling. The distribution of FM and No-FM across pain disorders was uneven, making subsample analyses difficult, and disorders such as SLE and AS were underrepresented, as were male patients with FM. Another limitation is that the SIQR, unlike the PSD, does not include an assessment of pain locations; we expect that when the 28 pain sites (both articular and nonarticular) are considered along with the SIQR, it will add precision to the description of severity in different pain disorders23.
Using the SF-36 as a general reference for common clinical symptoms, we compared the relative effectiveness of the PSD and the SIQR on a sample of 321 patients with 16 different chronic pain disorders. The SIQR proved superior to the PSD on all facets of the SF-36.
Footnotes
Support from The Fibromyalgia Information Foundation.
- Accepted for publication August 6, 2015.


