

Abstract
Objective. To quantify bone structure and perfusion parameters in regions of bone marrow edema pattern (BMEP), non-edematous bone marrow (NBM), and pannus tissue areas in the wrists of patients with rheumatoid arthritis (RA) using 3-Tesla (3T) magnetic resonance imaging (MRI), and high resolution peripheral quantitative computed tomography (HR-pQCT).
Methods. Sixteen subjects fulfilling American College of Rheumatology classification were imaged using a HR-pQCT system and a 3T MRI scanner with an 8-channel wrist coil. Coronal T2-weighted and dynamic contrast-enhanced (DCE-MRI) images were acquired. BMEP and pannus tissue areas were segmented semiautomatically in T2-weighted images. NBM areas were placed at a similar distance from the joint space as BMEP regions. MR and HR-pQCT images were registered, and bone variables were calculated within the BMEP and NBM regions. Perfusion parameters in BMEP, pannus tissue, and NBM regions were calculated based on the signal-time curve obtained from DCE-MRI.
Results. Eighteen BMEP areas were segmented, 15 of them presented proximal to pannus-filled erosions. Significant increases in bone density and trabecular thickness and number were observed in all BMEP regions compared to NMB (p < 0.05). Significantly elevated perfusion measures were observed in both BMEP and pannus tissue regions compared to NBM (p < 0.05).
Conclusion. BMEP regions showed significantly increased bone density and structures as well as perfusion measures, suggesting bone remodeling and active inflammation. Combining MRI and HR-pQCT provides a powerful multimodality approach for understanding BMEP and erosions, and for potentially identifying novel imaging markers for disease progression in RA.
Rheumatoid arthritis (RA) causes synovial inflammation, destruction of articular cartilage, and erosion of bone adjacent to joints. In the absence of effective therapy these structural abnormalities are progressive and lead to joint deformities and severe functional impairment with disability over the time course of years.
Disease-modifying antirheumatic drugs (DMARD) such as methotrexate (MTX) and biological agents such as anti-tumor necrosis factor (anti-TNF) therapy can slow and even halt joint damage, but responses vary among individual patients. With current clinical assessments, it is difficult to determine whether a therapeutic regimen has arrested articular damage in an individual patient. Indeed, erosive disease can progress despite remission by standardized clinical measures of disease activity1,2, underscoring the need for more accurate assessment of ongoing articular inflammation and damage.
Radiography, the current standard for assessing structural joint damage in RA, does not visualize inflammation, and is an insensitive measure of both early and late erosive changes, in part because of projectional superimposition, but also because of relative insensitivity to trabecular bone loss, and thus underestimation of the intramedullary extent of most bone erosions. Magnetic resonance imaging (MRI), on the other hand, provides reproducible measurements of joint inflammation and is superior to radiography for monitoring disease progression3,4. In particular, regions of bone marrow edema pattern (BMEP), also referred to as osteitis, are commonly detected in RA by MRI, and are strong predictors of progression of erosion and joint damage5–7,8–15. Previous studies demonstrated that BMEP corresponds to replacement of bone marrow fat by inflammatory infiltrates with lymphoid aggregates and increased vascularity, as well as accumulation of osteoclasts16,17,18. Despite the strong correlation between BMEP and erosion, little is known regarding the changes that occur in the trabecular structure of bone within areas of BMEP in rheumatoid joints. Investigating the underlying bone structure within BMEP regions would provide a novel approach to understanding the changes in the bone matrix with the course of RA. We quantified trabecular bone structure in BMEP using a multimodality approach that combined 3-Tesla (3T) MRI with high-resolution peripheral quantitative computer tomography (HR-pQCT), an emerging in vivo imaging technology19,20 that can provide independent, structural quantification of trabecular and cortical components with an in vivo voxel size of 82 µm3.
MATERIALS AND METHODS
Subjects
Sixteen patients with RA were recruited from the UCSF RA cohort fulfilling the American College of Rheumatology (ACR) 1987 criteria21. Standardized measurements of disease activity were collected during their clinical visit, including the 28-joint Disease Activity Score (DAS28) and markers of inflammation, serum erythrocyte sedimentation rate (ESR), and C-reactive protein (CRP). The study was approved by the Committee for Human Research at our institution. Written informed consent was obtained from all subjects after the purpose of the examination had been fully explained. The dominant hand and wrist were scanned with 3T MRI and HR-pQCT as detailed below.
MRI protocols
All MR images were acquired at a 3T MR scanner (Signa HDx, GE Healthcare), with an 8-channel phased-array wrist coil (Invivo). Only the wrist joint was scanned with MRI in this study. Patients were positioned supine with arms resting at the side of the body. This position minimized potential motion and made it feasible to include patients with shoulder pain, which is difficult with the standard “superman” position, in which patients are positioned prone with their arm overhead and their wrist at the center of the magnet bore. Iterative decomposition of water and fat with echo asymmetry and least-squares estimation (IDEAL) sequences were used because our previous results indicate IDEAL images provide superior fat suppression in bone marrow compared to conventional fast spin-echo (FSE) images22, which improves visualization and quantification of edema. In addition, the fat images generated from IDEAL sequences simultaneously were used for registration between MR and HR-pQCT images, described below. The imaging protocols also included the major sequences recommended by Outcome Measures in Rheumatology (OMERACT):
-
Coronal and axial T2-weighted IDEAL FSE images (TR/TE = 3500/50 ms, in-plane resolution = 0.2 mm, slice thickness = 2 mm);
-
Coronal T1-weighted IDEAL FSE images (TR/TE = 600/9.9 ms, in-plane resolution = 0.4 mm, slice thickness = 2 mm);
-
Coronal T1-weighted IDEAL spoiled gradient echo (SPGR) images (TR/TE = 15.3/2.9 ms, in-plane resolution = 0.2 mm, slice thickness = 1 mm);
-
Coronal 3D-DCE SPGR images acquired during Gd-DTPA injection (TR/TE = 6.4/2.1 ms, in-plane resolution = 0.4 mm, slice thickness = 3 mm, flip angle = 12°, temporal resolution = 12 s, 32 timepoints, injection delay = 45 s);
-
Post-contrast coronal T1-weighted IDEAL FSE images (same as T1-weighted IDEAL FSE).
All images used GE ASSET parallel imaging with an acceleration factor of 2. The total scan time was approximately 45 min, and the total examination time was less than 1 hour.
HR-pQCT measurements
All subjects were imaged in a clinical HR-pQCT system (XtremeCT, Scanco Medical AG). The midpoint of the radial endplate was used as an anatomical reference position with the scan region extending 8.54 mm in the distal direction and 18.52 mm in the proximal direction (330 slices total). The wrist positions were selected such that the proximal-most 110 slices corresponded to the standard location (9.5 mm proximal to the midpoint of the radial endplate) for imaging bone quality described in the osteoporosis literature20. For each tomographic acquisition, 750 projections were acquired over 180 degrees with a 100 ms integration time at each angular position. At each site, 3 sequential tomographic acquisitions were required to cover the 27.06-mm length (330 slices) along the superior-inferior axis. The 12.6-cm field of view (FOV) was reconstructed across a 1536 × 1536 matrix using a modified Feldkamp algorithm, yielding 82 µm isotropic voxels23. Total scan time was 8.2 min with an effective dose of approximately 12.6 µSv for each site.
Image processing
BMEP was identified independently by 2 radiologists in the MR T2-weighted IDEAL FSE water images and was segmented semiautomatically based on a thresholding algorithm24. First, contours (circles with 5-mm diameter) covering non-edematous bone marrow (NBM) were placed manually, and the standard deviation (SD) of signal intensity within this region was calculated. Second, a masked image was generated by manually drawing approximate contours of the bone containing BMEP. This procedure eliminated regions with high signal intensity outside bone marrow, such as soft tissues, pannus, and fluid. Lastly, BMEP was automatically segmented with a threshold that was 5 times the SD previously calculated within NBM contours using in-house software based on IDL. Regions with very high signal intensity on T2-weighted MR images, corresponding to pannus tissue infiltrations, adjacent to BMEP were segmented manually. NBM regions for analysis were standardized to be no further than 0.3 cm from their corresponding BMEP region, leaving at least a 0.1-cm gap between them to avoid misplacement after registration, and with the same distance to the joint space as the correspondent BMEP region (Figure 1). When standardization following the described criteria was not completely possible (i.e., carpal bones practically fully covered by BMEP), available NBM within the carpal bone (when existing) and/or NBM for the closest carpal bone was used for comparison (n = 3).

An example of regions of interest (ROI) definition in distal radius for bone marrow edema pattern (BMEP) and pannus tissue on T2-weighted fast spin-echo IDEAL water MR image, and standardized non-edematous bone marrow (NBM) region.
Perfusion parameters were calculated empirically based on the signal-time curve obtained from DCE-MRI. DCE-MRI images at each timepoint were registered to the image acquired at the first timepoint using the VTK CISG Registration Toolkit (VTK: http://vtk.org/), in order to minimize the motion artifacts during DCE MRI acquisition. Maximum enhancement (E) and steepest slope (S) were calculated as E(%) = 100 × (SImax/SIbase), and S(%/min) = 100 × ((SIafter – SIprior)/SIbase)/T, where SImax is the maximum signal intensity, SIbase is the baseline signal intensity before contrast agent is injected, SIprior is the signal intensity at 1 timepoint, SIafter is the signal intensity at the next timepoint, and T is the time between SIprior and SIafter. This slope, S, was calculated throughout the time course and the maximum slope used as “S.” A “baseline” image with signal intensity as an average of precontrast timepoints (from timepoint 3 until injection time) during DCE-MRI sequence was registered to the T2-weighted IDEAL FSE in-phase images (water + fat) rigidly using VTK CISG Registration Toolkit. The transformation matrix was then applied to the perfusion parameter map (slope and enhancement). Regions of interest (ROI; BMEP, NBM, and pannus) were overlaid to the registered perfusion parameter maps. The average perfusion parameters were calculated within every ROI for each subject.
HR-pQCT images were reformatted to coronal view and downsampled to match the pixel size and orientation of T2-weighted IDEAL FSE images. Registration between T2-weighted IDEAL FSE (fat image) and HR-pQCT was performed semiautomatically using the registration software R-View (http://rview.colin-studholme.net/), with HR-pQCT images as the target. First, a manual input was provided to align MR and HR-pQCT images in order to provide an acceptable starting point to initiate an automatic registration process. Rigid registration was then performed automatically using mutual information metric. After automatic registration the images resulted in a good alignment but registration still performed suboptimally. The reason was that, although the individual bones under study are rigid structures, some variation in their relative position was found between modalities. To overcome this problem, another manual input was provided using the 6 degrees of freedom for rigid registration, for each of the bones under study; thus, registration was performed for each bone individually.
The transformation matrix obtained after the process of registration was applied to the original ROI (BMEP, NBM, and pannus). Upsampling of the registered ROI to match the dimensions of the original HR-pQCT images was implemented using Matlab v.7.14 (The MathWorks). ROI were manually corrected to avoid inherent interpolation errors due to registration and upsampling. ROI were placed over original HR-pQCT, and local density and morphological measures were calculated using the system’s native evaluation software (Image Processing Language v5.08b; Scanco Medical AG). Bone Mineral density (BMD), trabecular number, trabecular thickness, and trabecular separation were quantified for the 3 ROI, BMEP, NBM, and pannus tissue regions. Erosions were identified by a radiologist (WS) in the HR-pQCT images.
Statistical analysis
MRI and bone measures between groups were compared by independent Student t-test, and within the same groups using paired Student t-test, in both cases employing SPSS v.20 (IBM) with p < 0.05 regarded as significant.
RESULTS
Clinical measures
The average age of the 16 subjects (13 women, 3 men) was 52.9 ± 12.7 years (range 34.5–74.2 yrs; median 54 yrs). Disease duration at the time of the examination ranged from 14 to 302 months (average 92.7 ± 90.6 mo; median 68 mo). Thirteen subjects were rheumatoid factor-positive, and 13 patients had antibodies to cyclic citrullinated peptide (anti-CCP). Nine subjects were taking DMARD without biological treatment, while 6 were receiving combined DMARD and anti-TNF treatment. The mean CRP was 4.8 ± 5.4 mg/l, mean ESR was 24.8 ± 26.6 mm/h, mean DAS28-CRP was 3.3 ± 1.4, and mean DAS28-ESR was 3.5 ± 1.6 (Table 1). Ranges of DAS28-CRP and DAS28-ESR for the patients taking anti-TNF treatment were 1.38–5.83 and 1.66–6.33, respectively.
Patient characteristics.
Presence of BMEP
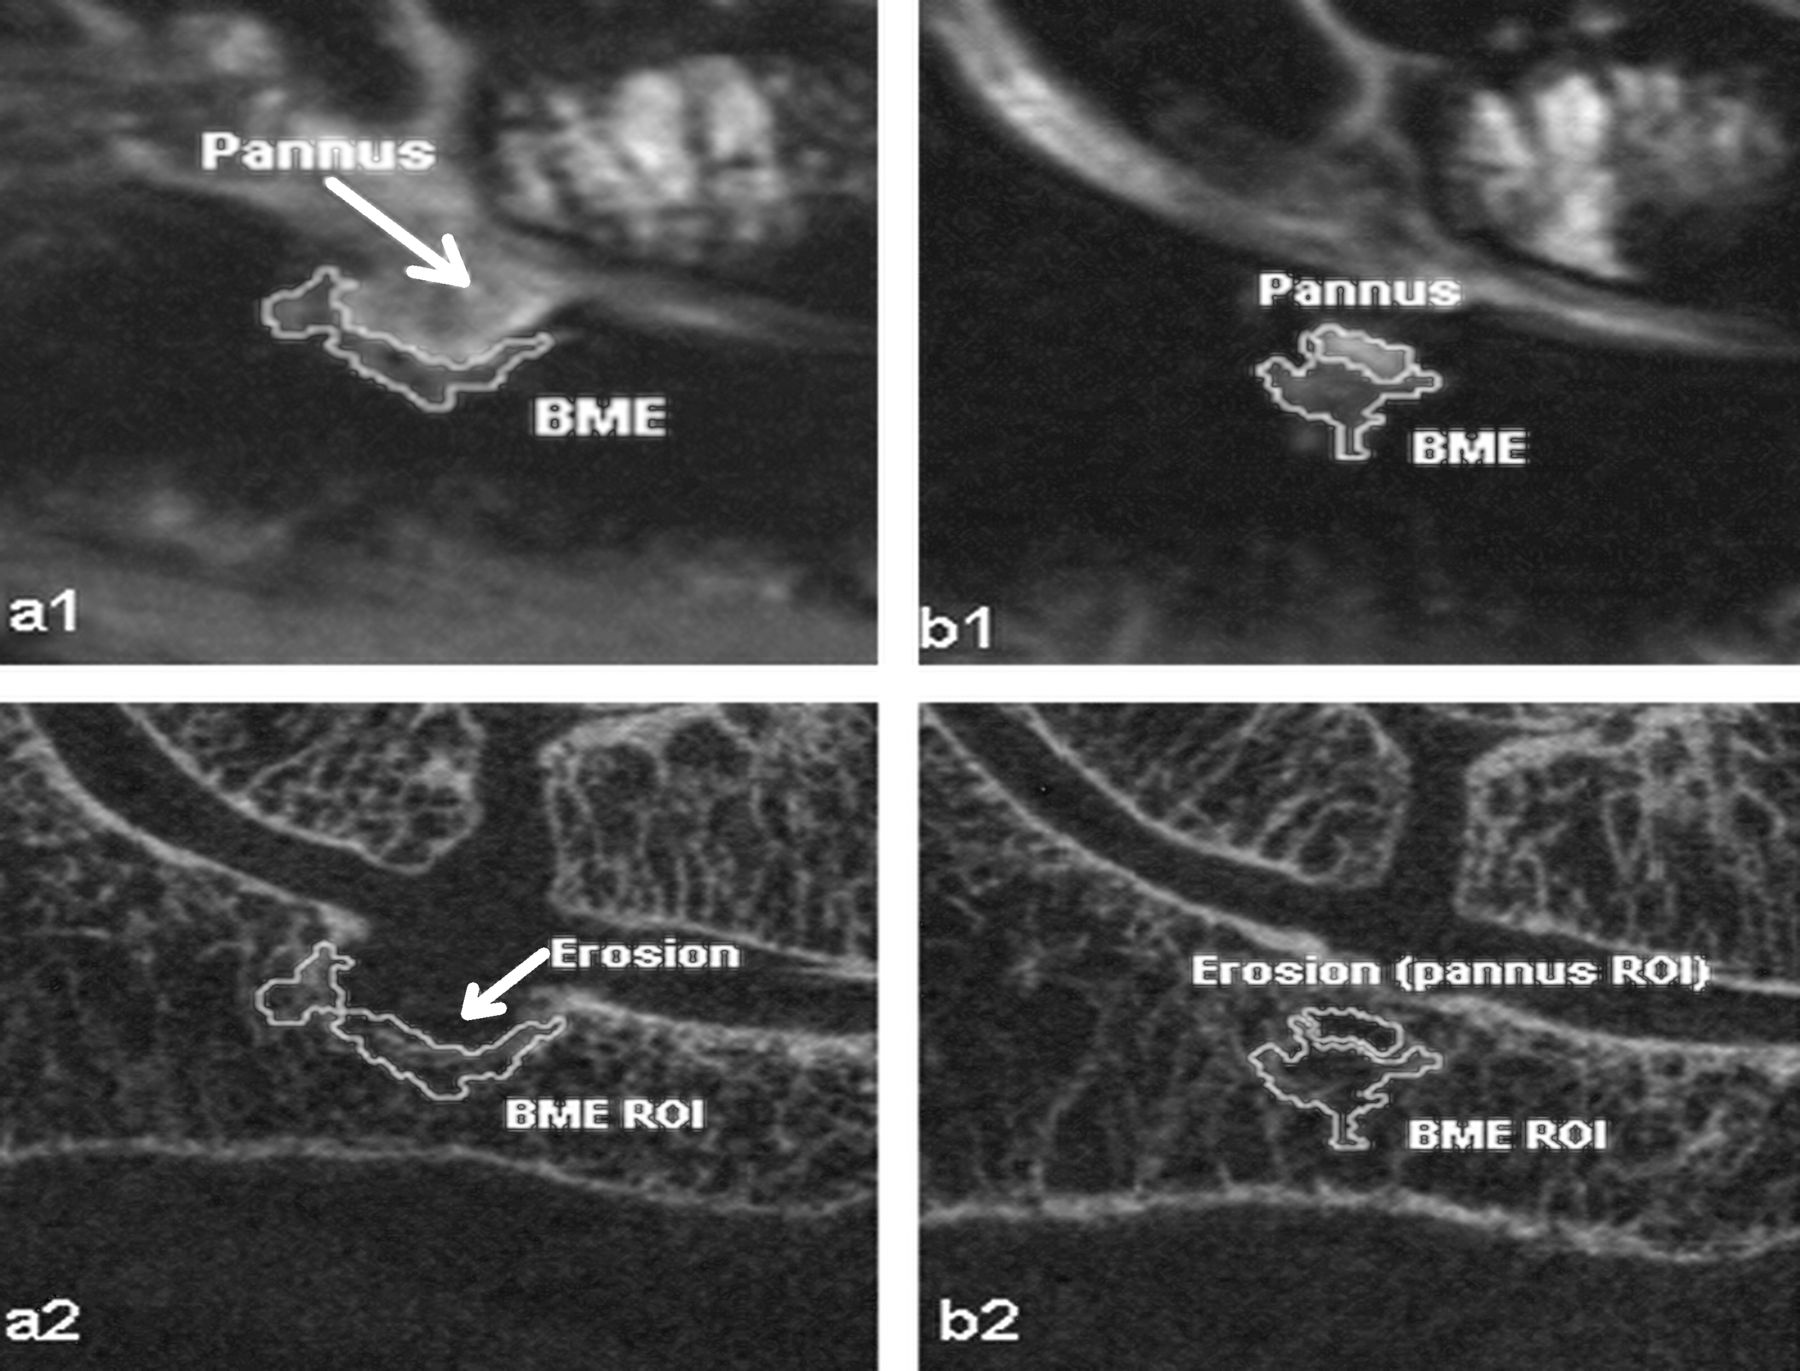
Thirteen of 16 subjects with RA presented evidence of BMEP by MRI. Among these, 11 presented at least 1 BMEP region that was covered by both MRI and HR-pQCT scan region. A total of 23 BMEP regions were segmented for the study. Out of these, 5 were excluded because an accurate multimodal registration was not possible. Of the 18 BMEP regions analyzed, 15 were associated with bone erosion regions (Figure 2), whereas for 3 regions, BMEP presented without accompanying bone erosions.

1: MR images. 2: HR-pQCT images. a: Example case of pannus-filled eroded cortical bone interfacing with bone marrow edema pattern (BMEP). b: Next slice of the previous case showing how the advance of the pannus within the bone produces further erosion in the trabecular structure. (Placement of non-edematous bone marrow region of interest can be seen in Figure 1.)
Bone structure measures
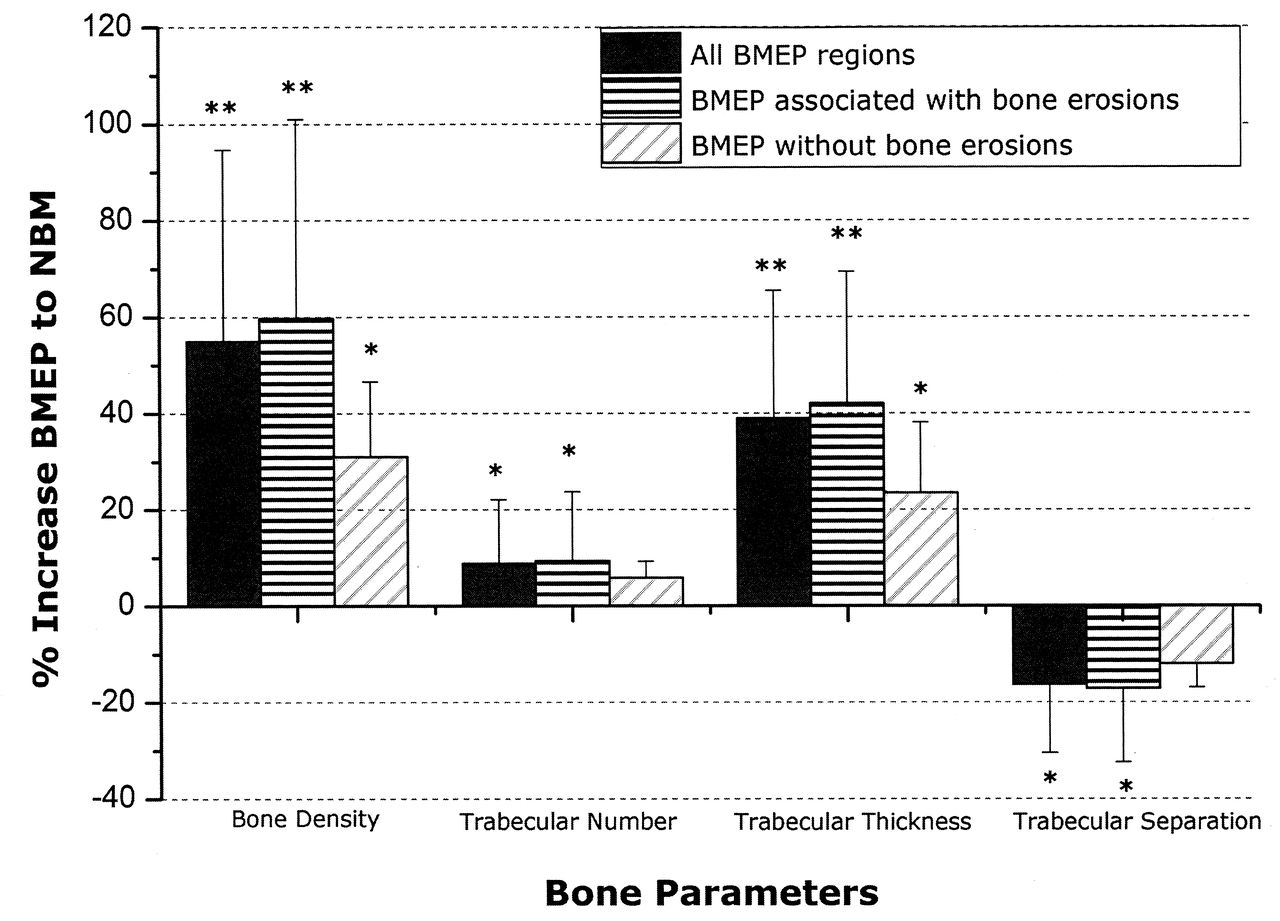
Compared to non-edematous bone marrow regions, BMEP regions presented a significant increase in bone density (55% increase; p < 0.001), trabecular thickness (39% increase; p < 0.001), and trabecular number (9% increase; p = 0.012), and significantly reduced trabecular separation (16% reduction; p = 0.001; Table 2). Further, BMEP regions were divided into 2 subgroups, one group presenting bone erosions in the proximity of BMEP (n = 15), and a second group where erosions were not presented (n = 3). Significant differences in bone density (+59% and +31% higher in BMEP regions with and without associated erosions, respectively) and trabecular thickness (+42% and +23% greater in BMEP regions with and without associated erosions) were observed in all BMEP regions from both groups compared to non-edematous bone marrow. Significant differences in trabecular number (+9% higher in BMEP) and trabecular separation (–17% lower in BMEP) were observed only in the subgroup where BMEP regions were associated with bone erosions. There were no statistically significant differences between subgroups. Figure 3 shows the changes in bone measures for all BMEP regions (n = 18) and both subgroups.

Percentage increase/decrease of bone parameters in regions presenting bone marrow edema pattern (BMEP) compared to non-edematous bone marrow (NBM) areas (*p < 0.05; **p < 0.001).
Trabecular bone measures obtained for bone marrow edema pattern and non-edematous bone marrow.
Perfusion properties
Maximum enhancement and steepest slope were significantly higher in BMEP compared to corresponding NBM regions (p < 0.001 and p = 0.010, respectively). Pannus tissue areas, for the cases where it was observed (n = 13), also exhibited significantly higher values of maximum enhancement and steepest slope (p < 0.001 and p = 0.002) compared to corresponding NBM regions. Detailed results are presented in Table 3.
Perfusion parameters obtained for bone marrow edema pattern (BMEP) and non-edematous bone marrow (NBM) and pannus tissue regions (mean ± SD).
DISCUSSION
We applied a multimodality approach using advanced imaging techniques, 3T MRI and HR-pQCT, to investigate the functional and morphological changes related to BMEP in wrist joints in RA. Trabecular bone density and structures as well as perfusion properties of BMEP and pannus tissue areas were examined. To our knowledge, this is the first study investigating trabecular bone structures within BMEP in RA joints.
Treatment of RA has advanced significantly over the past decade, with improved control of patient symptoms and a more complete suppression of inflammation, indicated by the increasing rates of remission14,25. However, disconnection between clinical symptoms and progression of structural damage has been reported1,26. For example, 19%–30% of patients with remission still exhibit radiographic progression26. One hypothesis is that subclinical inflammation exists in patients with clinical remission, which leads to structural damage and disease progression. The BMEP has been associated with progression of erosions and was superior to other MRI measures as a predictor of joint damage in many studies5–7,8–15. The link between MRI BMEP and progression of erosions implies that bone marrow is an important site for inflammation that leads to joint damage16. In particular, McQueen, et al reported that the presence of baseline BMEP significantly increased the likelihood (odds ratio ∼6.5) of development of erosions at the same site9, suggesting BMEP might be a pre-erosive lesion. Despite this strong connection between BMEP and erosion, to our knowledge, no studies have directly investigated trabecular bone structures in areas with BMEP in RA joints, and very limited information on perfusion properties in BMEP is available22,27. Our study aimed to close this gap and provide more information on the structural pathoanatomy of trabecular bone in areas with BMEP.
The basis for our analysis was the presence of at least 1 BMEP in regions covered by both imaging modalities, MRI and HR-pQCT, and this was found in 11 out of 16 patients in our study. Our analysis showed that the majority of patients (8 out of 11) with BMEP also presented erosive changes of the cortical and trabecular bone. In the majority of cases, bone erosions were filled by pannus tissue (13 of 15 bone erosions). Further, in the case of coexistence of BMEP and pannus-filled erosions, BMEP was wrapped around the pannus-filled erosion, establishing a separation between pannus tissue and non-edematous bone marrow (Figure 2). On the other hand, only 3 BMEP regions out of 18 showed no co-occurrence of local bone erosion, which may be due to the relatively long disease duration (median 68 mo) of our cohort.
Analysis of the enhancement curve was carried out using the acquired DCE-MRI series. Our results showed a significantly greater maximum enhancement and steepest slope of the DCE curve in BMEP compared to NBM. This result is in accord with findings in other studies22,27. The increased enhancement and slope during DCE-MRI within BMEP is indicative of potential angiogenesis, due to increased vascularity and increased capillary permeability caused by proinflammatory cytokines as suggested previously16,28,29.
Bone structures were studied using a multimodality imaging approach, where BMEP, pannus tissue, and NBM regions were segmented using T2-weighted MR images and bone structures were quantified using HR-pQCT images. Pannus tissue corresponded to regions of local erosion, thus no bone measures were calculated for these areas. However, this fact was used as a qualitative confirmation of accurate image registration. Consequently, attention was directed to quantifying the difference in bone structure between BMEP and non-edematous bone marrow regions. The non-edematous bone marrow ROI were placed in a location the same distance from the joint space due to the known variation in trabecular bone structure at different distances from the joint.
Registration was found to be very challenging, due to the difficulty of obtaining high-accuracy markers to assess registration quality. In the presence of erosion, perfect coincidence of pannus tissue and erosion was used as a marker, and for other cases the best possible fit of bone marrow within cortical bone was used. Finally, due to the importance of placement of the segmented ROI in the corresponding bone area, when reliable registration could not be achieved at the last manual iteration, that region was discarded from analysis (5 BMEP regions out of 23 were discarded).
Contrary to what could have been anticipated, significantly higher trabecular bone density and more favorable trabecular structure were observed within BMEP compared to non-edematous bone marrow regions. Moreover, the increased trabecular bone structure within BMEP regions was higher (roughly +60% higher bone density than NBM areas) when BMEP was localized around erosion and pannus tissue infiltrations in bone, compared to BMEP not associated with erosions (around +30% higher bone density than NBM regions; Figure 3). This result suggests bone thickening in the interface between BMEP and erosion/pannus tissue in the form of sclerosis, which is absent in the case of BMEP without associated bone erosion. The development of this thicker bone wall could reflect bone remodeling related to erosion.
On the other hand, a significant increase of trabecular bone density and structure was also present in BMEP without any erosion as compared to NBM. This suggests that accelerated bone regeneration may occur in BMEP regions. A previous histological study showed that plasma cells, B cells, T cells, and macrophages are present within BMEP regions, and that this inflammatory infiltration replaces marrow fat adjacent to bony trabeculae, upon which large numbers of osteoclasts were identified within lacunae17. Due to the known coupling of bone absorption and formation, the enhanced bone absorption by accumulated osteoclasts may stimulate bone formation, which may explain the increased trabecular bone density and structure observed in our study.
However, the question remains, at what point in time will this compensating bone remodeling fail, leading to decreased trabecular bone structure and eventually erosion? This question can be answered only with carefully designed longitudinal studies, in particular including subjects with early RA (thus potentially having more BMEP without erosion) or in animal model studies.
It should be kept in mind that although we used the “non-edematous bone marrow” as a reference for comparison of trabecular bone structure, bone density and structure can be abnormal in these “normal-appearing” marrow regions. Global and local bone loss has been reported30. Using the emerging technique of HR-pQCT, recent studies have shown decreased trabecular bone density and structure in RA hand and wrist joints31,32,33. The trabecular bone density and structure of our cohort were also significantly lower compared to an age and sex-matched control cohort (unpublished data). Thus, the underlying bone structures were not normal in the NBM regions. Therefore, it remains to be clarified that our results suggest that the bone structure within BMEP was increased with respect to NBM areas within the same subject, not with respect to normal bone marrow of non-RA subjects.
Our study has several limitations. An individual process of registration and resampling was carried out for each bone in order to place BMEP, pannus, and NBM areas segmented within MR images over corresponding HR-pQCT images. Image processing may introduce some arbitrary uncertainty to these results; registration (and consequent interpolation) and upsampling of the ROI lead to unavoidable errors in the final quantification. Further, BMEP and pannus tissue regions were always presented next to each other with the characteristic that pannus tissue regions corresponded with erosions (complete absence of bone). This last source of error would most likely result in artifactually lower, more normal trabecular bone values, and would thus obscure rather than exaggerate the findings, i.e., type 2 error. The possibility of this error does not invalidate the conclusions. Nevertheless, in order to determine accurate bone structure it is still critical to achieve precise placement of BMEP ROI over HR-pQCT images, in particular for prospective studies. We gave special attention to the registration process in order to minimize misalignments across biologically distinct regions, including visual assessment of bone marrow coinciding with trabecular bone space, and verification of spatial correspondence between pannus and erosions. Manual corrections were performed where required. Further, unique registration matrices were calculated for each bone studied (radius, ulna, lunate, scaphoid, and triquetrum) to account for small variations in the relative position of each bone between the 2 imaging modalities. In future studies the complex process of registration may be improved by minimizing the positioning differences between imaging modalities using, for instance, an acrylic positioning frame.
The study was also limited by a small and heterogeneous cohort. Despite this, higher density bone in BMEP regions compared to NBM regions was consistently observed in all cases, with a high significance level (p < 0.001). The cross-sectional design and lack of longitudinal data also limited the study. However, the data analyzed here will serve as a starting point for further followup studies of progression of the BMEP pattern and erosions in these patients.
Combination of MRI and HR-pQCT data provides a powerful multimodality approach to determine the relationship of BMEP and bone erosion in RA. Regions with BMEP showed significantly elevated perfusion measures and increased bone remodeling, suggestive of accelerated bone regeneration and active inflammation. The multimodality approach with MRI and HR-pQCT provides information related to inflammation and bone remodeling with superior in vivo resolution, and may help identify novel imaging markers to predict disease progression and to monitor treatment in RA.
Footnotes
-
Supported by a UCSF Radiology Seed Grant (Prof. Li), UCSF Academic Senate Research Grant (Prof. Li), and a Talentia Fellowship, Regional Ministry of Economy, Innovation, Science and Employment of Andalusia, Spain (Mr. Teruel).
- Accepted for publication April 17, 2014.


