

Abstract
Objective. Development of a validated magnetic resonance image (MRI) scoring system is essential in hip OA because radiographs are insensitive to change. We assessed the feasibility and reliability of 2 previously developed scoring methods: (1) the Hip Inflammation MRI Scoring System (HIMRISS) and (2) the Hip Osteoarthritis MRI Scoring System (HOAMS).
Methods. Six readers (3 radiologists, 3 rheumatologists) participated in 2 reading exercises. In Reading Exercise 1, MRI of the hip of 20 subjects were read at a single time point followed by further standardization of methodology. In Reading Exercise 2, MRI of the hip of 18 subjects from a randomized controlled trial, assessed at 2 timepoints, and 27 subjects from a cross-sectional study were read for HIMRISS and HOAMS bone marrow lesions (BML) and synovitis. Reliability was assessed using intraclass correlation coefficient (ICC) and kappa statistics.
Results. Both methods were considered feasible. For Reading 1, HIMRISS ICC were 0.52, 0.61, 0.70, and 0.58 for femoral BML, acetabular BML, effusion, and total scores, respectively; and for HOAMS, summed BML and synovitis ICC were 0.52 and 0.46, respectively. For Reading 2, HIMRISS and HOAMS ICC for BML and synovitis-effusion improved substantially. Interobserver reliability for change scores was 0.81 and 0.71 for HIMRISS femoral and HOAMS summed BML, respectively. Responsiveness and discrimination was moderate to high for synovitis-effusion. Significant associations were noted between BML or synovitis scores and Western Ontario and McMaster Universities Osteoarthritis Index pain scores for baseline values (p ≤ 0.001).
Conclusion. The BML and synovitis-effusion components of both HIMRISS and HOAMS scoring systems are feasible and reliable, and should be validated further.
Hip osteoarthritis (OA) is a major international health problem with 200,000 joint replacements annually in the United States alone. Our understanding of factors that predict progression of hip OA and development of new treatment modalities continues at a slow pace. In contrast, substantial progress has been made in understanding the pathogenesis of knee OA, and several factors have been identified as important predictors of cartilage degeneration. These advances have been assisted by advances in magnetic resonance imaging (MRI), which uniquely identifies important features of disease such as bone marrow lesions (BML), and the development and validation of scoring systems that allow semiquantitative assessment of various structural abnormalities on MRI1. For example, several longitudinal studies have now highlighted the association between BML and the subsequent development of cartilage degeneration2,3. The degree of BML and synovitis has also been shown to correlate with pain severity4,5. Several scoring systems, such as the Boston-Leeds OA Knee Score (BLOKS) and the Whole-Organ MRI Score, have now been validated for reliability and sensitivity to change6,7,8,9. This will now facilitate validation studies aimed at establishing surrogate status of MRI for structural damage in knee OA, which may substantially enhance the feasibility of new clinical trials of potential disease-modifying agents. While MRI is used extensively clinically to assess hip joints, and similar abnormalities (e.g., BML) are frequently observed in clinical practice, there have been very few reports describing methods for quantifying abnormalities10,11,12.
Preliminary development of 2 scoring methods has been undertaken. The Hip Inflammation MRI Scoring System (HIMRISS) was developed by rheumatologists and radiologists to focus on the assessment of BML, synovitis, and effusion, on fluid-sensitive MRI sequences13. The second method followed a development process similar to BLOKS and to the whole organ principle of assessing all lesions relevant to the pathology of OA in the hip. This group included hip orthopedic surgeons, rheumatologists, and radiologists, and aimed at consensus on which lesions to score and the appropriate MRI scanning processes. The Hip OA MRI Scoring System (HOAMS) assesses the entire spectrum of abnormalities in hip OA, and a preliminary report has described very good reliability for detection of most lesions14. The OMERACT 11 Hip OA MRI special interest group was convened to include developers of both methods and aimed to conduct further validation according to the OMERACT filter.
MATERIALS AND METHODS
Development of standardized methodology
We developed a series of reference images depicting the methodological approach to the application of the HOAMS and HIMRISS scoring methods. The reference images were further modified after a pilot evaluation of 6 scans from patients with hip OA. This was intended as a feasibility exercise aimed at facilitating understanding of the methods and identifying gaps in the description and scoring. We also further modified and generated consensus on the use of Microsoft Excel scoring sheets for recording data using the 2 methods.
Patients
The study was conducted in 2 reading exercises. In reading exercise 1, 20 patients aged > 50 years who were referred for assessment of chronic hip pain between October 2009 and April 2010 at the Klinikum Augsburg, Germany, were included. All patients were ambulatory at the time of imaging. Chronic hip pain was defined as pain on most days over the last 3 months without a history of trauma within the last 6 months. Patients were excluded if they had a history of rheumatoid arthritis, other inflammatory rheumatic conditions, or recent trauma. In cases of clinical suspicion of inflammatory changes such as insertional tendonitis, synovitis, or bursitis, the standard imaging protocol included a contrast-enhanced sequence in the coronal and axial imaging planes. To avoid any possibility of contrast-induced systemic nephrogenic fibrosis, renal insufficiency was ruled out prior to scanning by calculation of the glomerular filtration rate. The local institutional review board approved the study design.
The details of the examination, including possible side effects of the contrast application, were explained to the patients, and written informed consent (including a statement that the imaging data and the data of the questionnaire blinded to patient name, birth date, and institution would be used for research) was obtained from all patients prior to the examination.
In reading exercise 2, we included 27 subjects, who were recruited as a random population sample from the Greater Vancouver area, British Columbia, Canada. The aim of our study was to evaluate preradiographic hip disease using MRI. Subjects were between the ages of 40 and 79 years and were either symptomatic with hip pain, lasting more than 24 hours during the previous month (n = 22) or asymptomatic (n = 5). Only subjects with no radiographic evidence of OA underwent MRI. Subjects had a single MRI scan at baseline. We also included 18 patients from the University of Alberta Hospital, Edmonton, Canada, who were recruited into a randomized double-blinded placebo-controlled trial of intraarticular steroid treatment for hip OA, as reported in detail15. MRI was conducted at baseline and at the 8-week primary endpoint. These studies were approved by the respective institutional review boards, and written informed consent was obtained from all patients.
MRI acquisition
For reading exercise 1, MRI assessment was performed with a 1.5 T MRI system (Siemens Symphony, Erlangen, Germany) using a phased array body coil. The following sequences were part of the protocol: coronal and axial non-fat-suppressed T1-weighted (w) spin-echo sequences [TR 720 ms, TE 15 ms, slice thickness/slice gap 3.0 mm/0.3 mm, field of view (FOV) 17.9 × 16.3 cm, matrix size 320 × 216], coronal and sagittal proton density-weighted (PD) fat-suppressed (fs) fast spin-echo sequences (TR 3310 ms, TE 29 ms, slice thickness/slice gap 3.0 mm/0.3 mm, FOV 17.9 × 16.3 cm, matrix size 256 × 192), a sagittal 2D multiple-echo data image combination sequence (TR 1080 ms, TE 24 ms, slice thickness/slice gap 3.0 mm/0.3 mm, FOV 19.9 × 19.9 cm, matrix size 320 × 320). For contrast administration 0.2 ml (0.1 mmol)/kg body weight gadolinium-DTPA (Omniscan, GE Healthcare) was injected manually followed by a 20 ml saline flush. A repeat of the coronal and axial T1w sequences with fat suppression was acquired 3 min after the injection.
For the reading exercise 2 studies, scanning protocols were similar but did not include contrast enhancement. Vancouver scans included a coronal T2 fat-suppressed sequence (TR 3600 ms, TE 43 ms, slice thickness/slice gap 3 mm/0 mm, FOV 18 cm, matrix size 256 × 256), coronal and sagittal 3D spoiled gradient echo fat-suppressed (TR 27.7 ms, TE 6.6 ms, FOV 18 cm, matrix size 228 × 224, slice thickness/slice gap 2 mm/0 mm). MRI scans performed at the University of Alberta included coronal short-tau inversion recovery (STIR; TR 3550, TE 51, TI 145 ms) and T1-weighted spin echo (TR 475, TE 16 ms). Slice thickness/gap were 4/0.4 mm, FOV 40 cm, matrix size 512 × 256 (STIR) or 512 × 307 (T1).
MRI assessment
All MRI scans were read by 6 readers: 3 musculoskeletal radiologists (JJ, RGWL, VZ) and 3 rheumatologists (WPM, UW, DL). BML, synovitis-effusion, cartilage lesions, and osteophytes were scored by all readers while the remaining structural lesions were scored only by the 3 radiologists. The readers were blinded to demographics and patient characteristics. Exercise 1 readings were commenced after 2 separate 2-h training sessions. The first was primarily aimed at understanding the methodological approach to the 2 different scoring methods. The second was conducted after a pilot exercise aimed at reading and scoring 6 scans with different case material to ensure familiarity with the scoring methodology, elicit gaps in the instructions for scoring, optimize feasibility of recording data, and ensure that all clarifications to methodology were captured in revisions of the 2 reference image sets. In reading exercise 1, all OA features were assessed in at least 2 perpendicular imaging planes. In reading exercise 2, scans from Vancouver were assessed in 2 imaging planes (coronal, sagittal) while scans from the University of Alberta were assessed only in the coronal plane. Scores were recorded electronically on designated custom-developed spreadsheets (MS Excel). In exercise 1, images were scored with respect to 14 articular features: cartilage morphology, subchondral BML, subchondral cysts, osteophytes, acetabular labrum, synovitis (whenever contrast-enhanced sequences were available), joint effusion, loose bodies, attrition, dysplasia, trochanteric bursitis/insertional tendonitis of the greater trochanter, labral hypertrophy, paralabral cysts, and herniation pits at the superolateral femoral neck.
In the HOAMS method
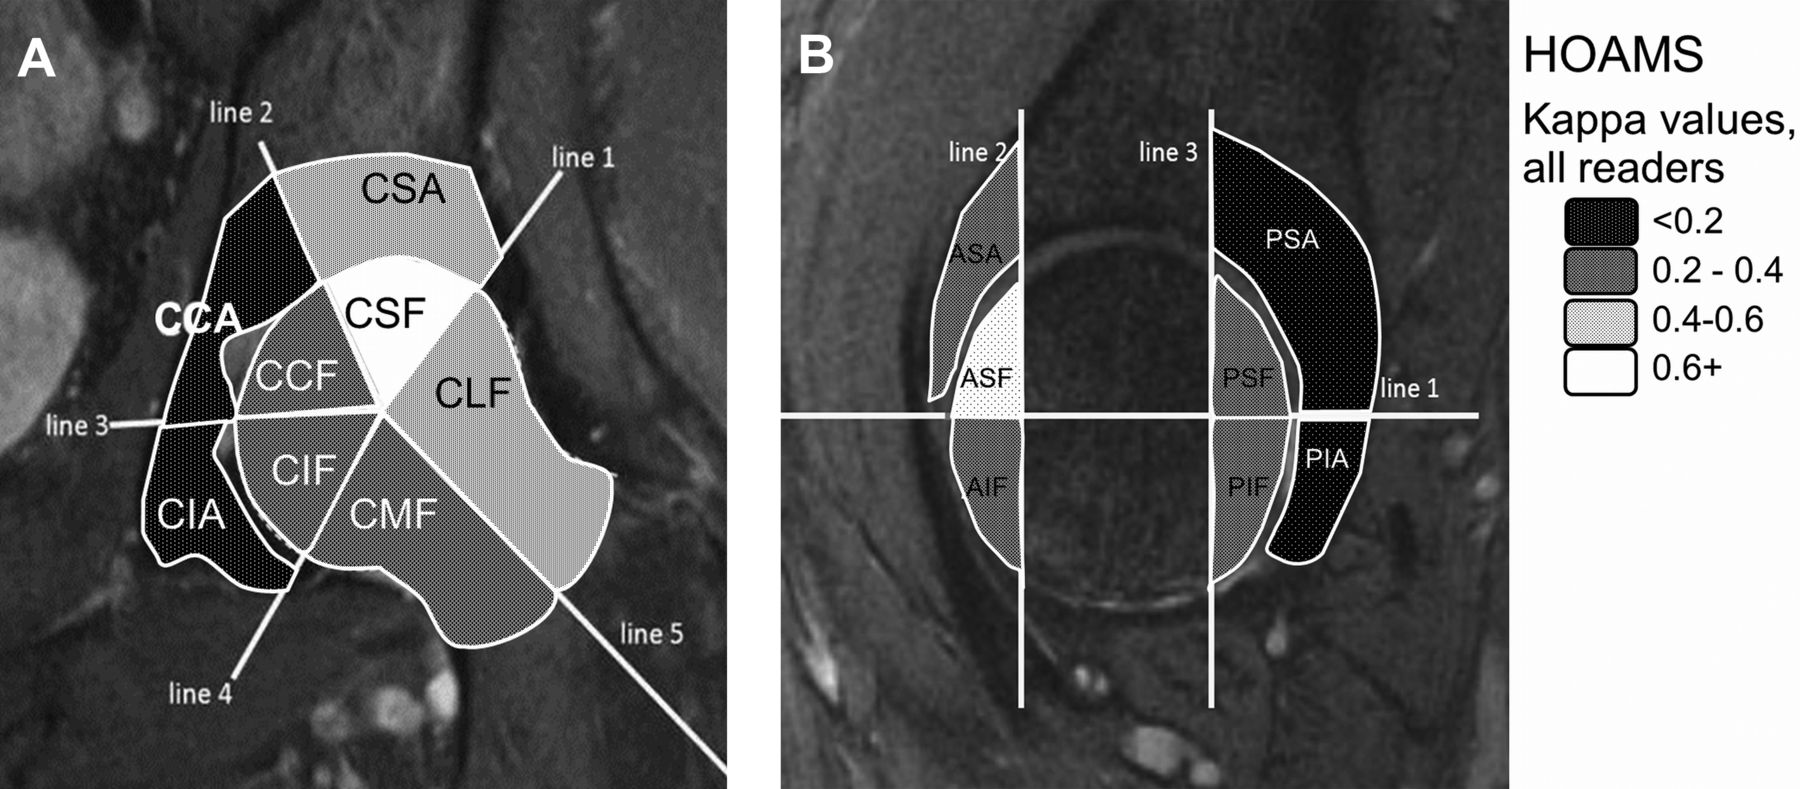
Three of the features examined (cartilage morphology, subarticular BML, subarticular cysts) relate to the articular surfaces that are subdivided into 9 subregions for cartilage evaluation and 15 subregions for acetabular (n = 6) and femoral (n = 9) subchondral bone marrow assessment (Figure 1).

Schematic overlay of coronal and sagittal magnetic resonance imaging (MRI) scans to show subregions assessed for bone marrow lesions and cysts using Hip Osteoarthritis MRI Scoring System (HOAMS). A. In the coronal plane, the subregions assessed are the central-lateral (CLF), the central-superior (CSF), the central-central (CCF), the central-inferior (CIF), and the central-medial (CMF) subregions of the femur, and the central-superior (CSA), central-central (CCA), and central-inferior (CIA) subregions of the acetabulum. B. In the sagittal plane, the subregions evaluated are the anterosuperior (ASF), the anteroinferior (AIF), the posterosuperior (PSF), and the posteroinferior (PIF) subregions of the femur, and the anterosuperior (ASA), posterosuperior (PSA), and posteroinferior (PIA) subregions of the acetabulum.
Coronal and sagittal PD-weighted fat-saturated MR images are used to evaluate BML, and subchondral cysts and lesions are graded according to volume of region affected as follows: 1 = mild (< 33% of region), 2 = moderate (33–66% of region), and 3 = severe (> 66% of region). BML in the femoral head are scored in 9 regions of interest from the most central sagittal and coronal slices. The BML score for the femoral head is 0–27. BML in acetabulum are scored in 6 regions of interest from the same most central sagittal and coronal slices. The BML score for acetabulum is 0–18.
The total score for BML in HOAMS is 0–45. Only alterations that are located directly subchondral and that are in contact with the subchondral plate are scored.
The articular cartilage surfaces of the acetabulum and femoral head are scored together because a clear delineation of both surfaces is not possible on standard non-arthrography MRI. The remaining features are scored at specific anatomic locations. Cartilage is scored from 0–4 as follows: 0 = normal cartilage, 1 = focal partial thickness defect (≤ 25% of subregional area affected), 2 = focal full thickness defect (≤ 25% of subregional area affected), 3 = several partial thickness defects or single but larger superficial defect (> 25% of subregional area affected), 4 = several large full thickness defects or single full thickness defect (> 25% of subregional area affected).
Coronal and axial T1-weighted fat-suppressed contrast-enhanced MR images are used to evaluate the presence of synovitis. Synovitis is scored at 4 defined locations. The coronal plane is necessary for the assessment of the medial (MS) and lateral (LS) locations and the axial plane for the anterior (AS) and posterior (PS) locations of synovitis scoring. Synovitis is scored according to the thickness of the synovium as follows: < 2 mm = physiological, 2–4 mm = Grade 1, > 4 mm = Grade 2. The total score for synovitis is 0–8. Effusion was not scored in exercise 1. For exercise 2, axial and contrast-enhanced scans were not available, and scoring of combined synovitis-effusion using the HOAMS method was based on the amount of intraarticular hyperintensity on the coronal STIR and assessment of the MS and LS locations. The total synovitis-effusion score is 0–4.
In the HIMRISS method
BML is defined as increased signal within bone on STIR sequences, excluding bone cysts. The contralateral hip is the normal reference signal for this assessment using bladder signal and T1 images to assist with identification of cysts. The closest normal bone marrow is used if the contralateral hip is significantly abnormal or arthroplasty is present.
BML in the femoral head is scored in 5 central slices as well as the 5 slices that are anterior and 5 that are posterior to these central slices. The image where the femoral head is largest defines the most central slice of the 5 central slices. On each central slice the femoral head is considered a circle that is segmented into 8 equal sectors (octants) of 45° of arc with a ninth sector being an inner circle representing one-half the diameter of the femoral head. BML is scored dichotomously in each of these sectors, giving a scoring range of 0–45. For each of the anterior and posterior slices, the slice is divided into 2 sectors, superior and inferior, and BML is scored dichotomously in sectors defined as anterosuperior, anteroinferior, posterosuperior, and posteroinferior so that the total scoring range for the sum of anterior and posterior slices is 0–20 and total femoral BML score is 0–65. For assessment of acetabular BML, a 2-cm radius from the rim of the acetabulum is evaluated if the rim can be identified on the image. A part of the BML must contact the articular surface/subchondral bone plate at some stage within the set of images to be evaluated. If rim is not identifiable (out of the field of view), then the 2- cm radius limit is taken from the template horizontal line (that will traverse the center of the femoral head).
The acetabulum is scored in the same slices, the 5 central slices being divided into 3 sectors (superolateral, superomedial, and medial), and 5 anterior and 5 posterior slices being divided into superior and inferior halves so that the total scoring range for acetabular BML is 0–35.
The total BML scoring range per subject is 0–100.
Effusion and synovitis are scored together according to a 0–2 grading scheme [0 = 0–1.9 mm (normal), 1 = 2–3.9 mm, 2 = ≥ 4 mm] on the same central, anterior, and posterior slices, resulting in a scoring range of 0–30. The fluid signal contacting a part of the femoral head and/or neck is assessed at the greatest short axis dimension perpendicular to the underlying bone (which will be femoral neck or femoral head). If no bone is visible (it is just off the slice being measured), the greatest short axis diameter of the synovial recess is measured. A transparency outlining the sectors was developed and used as an overlay being placed over the femoral head so that the outer circle approximates the femoral head. The HIMRISS reference image set and instructions for using an electronic overlay are available at www.arthritisdoctor.ca. Reference images are depicted in the original publication of the HOAMS system as an illustrative appendix14.
Clinical assessment
Patients included in exercise 2 were asked to fill out the Western Ontario and McMaster University Osteoarthritis Index (WOMAC) questionnaire, which assesses 5 questions related to pain, 2 questions related to stiffness, and 16 questions related to function16.
Statistical analysis
Interobserver reliability of status and change scores was calculated using intraclass correlation coefficient (ICC) for continuous data with 95% bootstrap CI based on 1000 bootstrap weights. Mean kappa and weighted kappa over all reader pairs was used for dichotomous and ordinal outcomes, respectively. In addition, we collapsed graded scores for BML, cartilage, and osteophyte lesions to a dichotomous (present/absent) format and used unweighted kappa and percentage agreement to assess reliability of detecting any pathology (> 0). We assessed responsiveness of total BML lesion score (HOAMS), acetabular and femoral BML score (HIMRISS), total synovitis score (HOAMS), total effusion score (HIMRISS), and total HIMRISS score (BML + effusion), in the 18 patients recruited to the placebo-controlled trial using Guyatt’s effect size and used the standardized response mean in 11 patients who received active therapy. To assess associations between MRI features (BML and synovitis) and pain severity, 0–100 normalized WOMAC pain score (change in normalized pain score) was considered as the predictor in baseline (change) cross-sectional, univariable models. Outcome variables in the baseline models included acetabular and femoral BML totals (HIMRISS), effusion total (HIMRISS), HIMRISS BML total (acetabular + femoral), HIMRISS total (BML + effusion), HOAMS BML total, and HOAMS synovitis total. Outcome variables in the change models were the changes in each of these variables. Baseline models were fit on the combined University of Alberta and University of British Columbia data (n = 45), while the change models were fit on the longitudinal University of Alberta data (n = 18). All statistical analyses were performed using SAS software (Version 9.1 for Windows; SAS Institute).
RESULTS
Demographics
Baseline characteristics of patients assessed in reading exercise 1 were typical of an OA population. Eleven of the patients (55%) were female, mean (SD) age was 64.6 years (9.8) and mean (SD) body mass index was 26.2 (3.9). Distribution of radiographic grading was Kellgren and Lawrence (KL) KL0 = 3 (15%), KL1 = 5 (25%), KL 2 = 8 (40.0%), KL 3 = 3 (15%), and KL 4 = 1 (5%). Table 1 shows the distribution of severity of MRI features (maximum grades) for this cohort as well as baseline summed scores for BML and synovitis.
Baseline demographics of patients assessed in reading exercises 1 and 2 by 6 readers (3 rheumatologists, 3 musculoskeletal radiologists).
Assessment of reliability of BML and synovitis-effusion scores
Both methods were considered feasible by all readers for the assessment of BML and synovitis-effusion. For HIMRISS, reading exercise 1 ICC values were 0.52, 0.61, 0.70, and 0.58 for femoral BML, acetabular BML, synovitis-effusion and total scores, respectively (Table 2). For HOAMS, exercise 1 summed BML ICC was 0.52 and summed synovitis ICC was 0.46. For HOAMS exercise 1, mean weighted kappa for the subregion scores ranged from 0.05 to 0.71 for BML and 0.190 to 0.309 for synovitis (Table 3). The highest reliability was recorded in the central-superior femoral (κ = 0.71) and central superior acetabular (κ = 0.55) subregions where BML were most frequently observed and was substantially lower in other regions, which was at least partly due to a lower frequency of lesions because percentage agreement was similar between subregions (Table 3 and Figure 1). The lowest reliability for BML was observed in central-central (κ = 0.17), central-inferior (κ = 0.06), and postero-inferior (κ = 0.05) acetabular subregions. For reading exercise 2 cross-sectional scans, HIMRISS ICC values improved to 0.83, 0.81, 0.66, and 0.84 for femoral BML, acetabular BML, synovitis-effusion, and total scores, respectively, while HOAMS ICC values improved to 0.85 and 0.62 for summed BML and synovitis scores, respectively. For HOAMS exercise 2, mean weighted kappa for subregion scores ranged from 0.19 to 0.73 for BML and 0.30 to 0.39 for synovitis. Improved kappa scores for BML were noted in 13 of 15 subregions in exercise 2. For HIMRISS change scores in 18 patients with scans at baseline and 8 weeks, ICC values were 0.81, 0.49, 0.35, 0.77, for femoral BML, acetabular BML, synovitis-effusion, and total scores, respectively (Table 2). For HOAMS, ICC values for change scores were 0.71 and 0.58 for summed BML and synovitis scores, respectively. ICC values were comparable for radiologist and rheumatologist readers, and kappa values were similarly comparable between rheumatologist and radiologist reader pairs for subregion scores (data not shown). Collapsing subregion scores to a dichotomous framework (lesion present/absent) resulted in only minor changes to kappa values.
ICC (for all 6 readers and bootstrap CI based on 1000 bootstrap weights) for summed BML and synovitis-effusion scores in cross-sectional and 2 timepoint (baseline, 8 weeks) MRI scans.
Reliability of scoring bone marrow lesion (BML) by region and synovitis in Hip Osteoarthritis MRI Scoring System (HOAMS; mean weighted kappa and % agreement) for reader pairs (n = 15) in reading exercises 1 (n = 20) and 2 (n = 45).
Reliability of assessment of cartilage and other structural lesion scores
Mean weighted kappa scores in exercise 1 ranged from 0.09 to 0.40 for different subregions of cartilage (Table 4), −0.01 to 0.29 for cysts, 0.27 to 0.40 for femoral osteophytes, 0.01 to 0.15 for acetabular osteophytes, and 0.07 to 0.26 for labral lesions. Mean weighted kappa was 0.44 for trochanteric bursitis and 0.57 for loose bodies. Range for percentage agreement was 22.5 to 43.5 for cartilage lesions, 74.3 to 100 for cysts, 34 to 46.5 for femoral osteophytes, 23.3 to 51.7 for acetabular osteophytes, and 29.1 to 38 for labral lesions. Substantial improvement in percentage agreement was evident when cartilage lesion scores were collapsed into a dichotomized framework (lesion present/absent; Table 4). The primary difficulty cited by readers in scoring cartilage lesions was assessing partial versus full thickness defects. Similarly, percentage agreement for osteophyte scores improved substantially when collapsed into a dichotomized framework (present/absent).
Reliability of scoring cartilage lesions according to HOAMS (Hip Osteoarthritis MRI Scoring System) subregions (mean weighted kappa and % agreement) for reader pairs (n = 10) in reading exercise 1.
Responsiveness of HIMRISS and HOAMS summed scores for BML and synovitis-effusion
Although numerically greater reductions for BML and synovitis-effusion were observed in patients who received active treatment compared to placebo, treatment group differences were not statistically significant (Table 5). Nevertheless, a moderate degree of responsiveness was evident for synovitis scores using either method. While assessment of BML revealed minimal overall change at the group level for either treatment group, there was a much larger range of scores in the steroid treatment group, particularly for femoral BML, where scores ranged from improvement of 23.5 and 10 to worsening by 37.67 and 13.4 for HIMRISS and HOAMS, respectively.
Change scores in 18 Edmonton OA patients recruited to a placebo-controlled trial of intraarticular injection of steroid into the hip. Values are mean (SD) range (minimum, maximum).
Association of HIMRISS and HOAMS summed scores for BML and synovitis-effusion with pain
Significant associations were noted between both HIMRISS and HOAMS BML (femoral and acetabular) and synovitis-effusion scores and WOMAC pain scores for baseline values (p ≤ 0.001) in exercise 2 but not for change values. Among the site-specific data, the association with pain was particularly evident in Vancouver patients with early OA (N = 27) for HIMRISS synovitis-effusion (p = 0.001) and HOAMS synovitis (p = 0.005) scores. However, in combined Vancouver and University of Alberta Hospital data, which comprised low (Vancouver) and high (University of Alberta Hospital) disease activity, all baseline associations were highly significant (p < 0.01). This suggests broad relationships not easily detected without a wide spectrum of disease activity in the analysis data.
DISCUSSION
Our multireader comparison of 2 scoring methods for assessment of MRI features of OA in the hip showed that BML and synovitis-effusion could be reliably detected with both methods even after minimal training and when conducted by rheumatologists with limited expertise in assessment of hip OA on MRI scans. Assessment of BML improved to a high degree of reliability after a single calibration exercise for both status and change scores. Moreover, there was fair to moderate agreement for individual BML scoring in most subregions, and it was particularly evident at subregions where BML are most frequently observed. Substantial change in BML was evident over as short a time frame as 8 weeks in patients receiving intraarticular steroid therapy but this did not correlate with change in pain scores. Agreement for other joint findings was slight to fair, which may be explained in part by the low prevalence of some joint features. Reliability of detecting cartilage lesions was enhanced when graded scores for severity were collapsed to a dichotomous framework (lesion present/absent).
Assessment of BML using the HOAMS method was considered particularly challenging for lesions in the acetabulum because the anatomy of this region varies considerably on consecutive slices on both the coronal and sagittal scans, and it was considered difficult to estimate the volume of region involved in scoring severity. It is possible that the improvement in reliability for HOAMS BML in exercise 2 also partly reflects the lack of availability of sagittal scans for the Edmonton data — the cohort that also had the highest prevalence of BML. When the anatomy is very complex, reader reliability may be improved by limiting observation to the single most informative sequence. An additional consideration is that exercise 2 was based on STIR and T2 fat-suppressed sequences, which may offer an advantage in the detection of pathological water signal over PD fat-suppressed sequences in the evaluation of BML in the acetabulum. The presence of red marrow in the acetabulum may cause it to look brighter on PD sequences in contrast to the femoral head, which is dark on all fat-suppressed sequences, regardless of T1 or T2 weighting, because of the presence of fatty marrow. Formal comparative studies would be worthwhile.
Assessment of BML using the HIMRISS method was considered challenging primarily in the application of the overlay for subdivision of the sectors. To facilitate this, an electronic overlay has been developed (www.arthritisimaging.ca) and further validation using this tool would be worthwhile. Nevertheless, the reliability for status and change scores of the summed BML score is in the range of other imaging instruments considered valid measures for use in clinical research. While no significant steroid/placebo treatment group differences were noted for BML, a much greater range of change in BML was observed in steroid-treated patients. The fact that this was observed on the STIR sequence and over a short time frame of 8 weeks suggest that change in water signal related to inflammation is primarily responsible for this observation. While some patients improved substantially after treatment, others had substantial worsening in BML. Patients recruited into this trial had severe disease, but substantial improvement of at least 50% in WOMAC pain scores was observed in half the steroid-treated patients15. It is possible that this may have led to a substantial increase in activity in some patients and to stress-related changes in subchondral bone. This could also confound the potential association between BML and pain scores. Future studies should assess patients at an earlier stage of disease and provide careful instruction regarding activity level once included in the study.
Our data suggest that assessment of synovitis-effusion may be responsive to treatment with intraarticular steroids, although sample size was limited and treatment group differences were not significant. Moreover, these data suggest that contrast enhancement may not offer advantages over fat-suppressed sequences, and limited assessment of the coronal scan on the worst affected slice may be as good as assessment of all consecutive coronal slices. This may reflect the observation that synovitis and effusion is typically limited even in severely affected cases. Nevertheless, its responsiveness and association with pain, especially in patients early in the disease course as included in the Vancouver cohort, support the continued validation of this MRI feature in the assessment of hip OA.
Assessment of cartilage lesions was considered challenging by both rheumatologists and radiologists because the acetabular and femoral layer of articular cartilage is very thin in the hip joint and it proved difficult to reliably distinguish between partial and full thickness lesions. Reliability was improved when grades for severity were collapsed to a dichotomous framework (lesion present/absent) although this is likely to impair responsiveness. While more advanced assessment of cartilage such as dGEMRIC (delayed gadolinium-enhanced MRI of cartilage) and T2 mapping may offer advantages, especially early in the disease course17, feasibility for large scale studies of OA would be impaired. Assessment of cartilage is ideally performed using MR arthrography with images acquired after the intraarticular injection of a gadolinium-based contrast agent18. Assessment of osteophytes showed that reliability was fair but scores improved substantially when collapsed into a dichotomized framework (present/absent). However, this is likely to impair responsiveness. Further calibration would be worthwhile to determine whether MRI offers advantages over plain radiography, particularly in the assessment of change.
These validation exercises confirm the feasibility and reliability of detection of BML and synovitis-effusion and support continued validation aimed at discrimination. Moreover, our preliminary data show that assessment of BML and synovitis-effusion may be responsive within the time frame of clinical trials. Assessment of structural lesions such as cartilage and osteophytes is far more challenging. More intensive reader training and calibration is necessary before more definitive conclusions can be considered appropriate.


