

Abstract
Objective. Monocyte chemotactic protein (MCP-1), involved in the pathogenesis of lupus nephritis (LN), has recently been indicated as a new biomarker of kidney activity in systemic lupus erythematosus (SLE). Our aim was to assess urinary MCP-1 (uMCP-1) as a biomarker of renal activity in patients with SLE and to compare it to other disease activity markers, using the ELISA.
Methods. Seventy-five female Brazilian patients with SLE and a control group participated in our study. Patients with SLE were distributed among 3 groups according to kidney involvement and classified according to disease activity based on clinical and laboratory measures such as urinary sediment, proteinuria, kidney function, C3, C4, anti-dsDNA, disease activity index, and renal SLE disease activity index. The serum and uMCP-1 concentrations were measured by sandwich ELISA.
Results. In the A-LN group (active lupus nephritis: SLE with kidney involvement), the concentration of uMCP-1 was significantly higher than in other groups. A cutoff point was established using the results of the control group to apply this test in the detection of LN. A-LN had a higher frequency of positive results for uMCP-1 in comparison to the other groups (p < 0.001). To detect disease activity in patients with LN, a new cutoff was determined based on the results of patients with SLE with kidney involvement. Setting specificity at 90%, the sensitivity of the test was 50%.
Conclusion. The high specificity makes uMCP-1 a useful test as a predictor of kidney activity in SLE, especially when associated to other measures used in clinical practice.
Lupus nephritis (LN), which affects more than 60% of patients with systemic lupus erythematosus (SLE), is a clinical manifestation with a poor prognosis regarding both morbidity and mortality1. Despite advances in the treatment of LN, 10% to 15% of patients proceed to endstage renal failure2. Early diagnosis and prompt treatment, however, may significantly improve the longterm prognosis3.
It is essential to monitor kidney disease closely in patients with LN, especially when activity fluctuates, requiring treatment modifications. Thus, a noninvasive, easily obtainable, accurate marker to assess kidney disease repeatedly in SLE would be very useful for more precise management. The serological determination of serum anti-dsDNA antibodies and complement levels may be clinically helpful as indicators of disease activity. However, the correlation between those markers and lupus kidney disease is imperfect and their usefulness in reflecting disease activity and in predicting outcome in LN is still controversial4,5.
Despite the diversity of promising biomarkers for LN, few have been validated to date. Cytokines and chemokines secreted locally within the kidney are instrumental in the pathogenesis of LN. Their excretion in the urine is an excellent indicator of their local production and secretion, and thus may have more potential than a serum-based marker to reflect inflammatory activity in the kidney6,7. Monocyte chemotactic protein (MCP-1) has been indicated as a new biomarker of renal activity in SLE, because it is involved in the pathogenesis of LN8. MCP-1 is produced in the kidneys by mesangial, endothelial, and monocytic cells in response to the presence of immunocomplexes and inflammatory mediators, such as interleukin 1, tumor necrosis factor-α, and interferon-γ9. In murine models of SLE glomerulonephritis (GN), genetic deletion or pharmacologic blockade of MCP-1 attenuates glomerular and interstitial inflammation and reduces kidney damage10. In humans, this chemokine is found in large amounts in the urine of patients with active LN and, in some reports, decreases with treatment-induced disease remission11. In a prospective, longitudinal study, Rovin, et al highlighted the importance of urinary MCP-1 (uMCP-1) as a biomarker of renal activity as well as its use in monitoring disease activity and treatment response12.
The purpose of our study was to assess uMCP-1 by ELISA test as a biomarker of renal activity in LN and compare it with other markers of disease activity currently used in clinical practice.
MATERIALS AND METHODS
Patients
A cross-sectional study (no. 25000.085174/2006-69) was approved by the institutional review board and carried out at the Rheumatology Service of the Hospital Servidor Público Estadual (HSPE) and Escola Paulista de Medicina, São Paulo, Brazil. Female patients between 20 and 60 years of age were gathered between January 2006 and July 2007 and 3 groups were established based on the criteria proposed by the American College of Rheumatology (ACR)13. They all signed an approved informed consent. Thirty female patients had active SLE and renal involvement [active lupus nephritis (A-LN)], 30 had a history of LN but with no disease activity [lupus nephritis in remission (R-LN)], and another 15 had no systemic disease activity and no history of renal disease [lupus without nephritis (NR-SLE)]. The SLE Disease Activity Index 2000 (SLEDAI-2K) was used to assess disease activity in all patients14. The definition of active LN was determined by any 2 of the following criteria: (1) an increase in serum creatinine > 0.5 mg/dl with a baseline level ≤ 3 mg/dl, or > 1 mg/dl with a baseline level > 3 mg/dl over a 3-month period; (2) presence of glomerular dysmorphic erythrocytes > 50% and/or hematuria ≥ 100,000/ml and/or hyaline or cellular casts; (3) proteinuria > 1 g/24 h or increase in levels ≥ 0.5 g/24 h over a 2 to 3-month period; (4) evidence of 1 or more active lesions in renal biopsy based on the classification criteria of LN established by the International Society of Nephrology/Renal Pathology Society15. Complete remission was defined as absence of activity in the urinary sediment and proteinuria < 0.5 mg/24 h in the previous 3 months. We further enrolled 17 healthy female individuals for a control group. The exclusion criteria included kidney disease associated with other causes such as urinary infection, essential arterial hypertension, diabetes mellitus, and other GN not attributable to SLE.
Clinical and laboratory data
Patient records were reviewed at the same time that renal activity was evaluated. Systematic analysis focusing on renal and extrarenal manifestations of SLE, according to ACR criteria, was undertaken. Serologic data included were anti-dsDNA, antinuclear antibody (ANA), and C3 and C4 complement levels. The renal SLEDAI (rSLEDAI) was applied to outline the features of patients with LN (both active and in remission). This tool consists of the 4 kidney-related items of SLEDAI-2K (hematuria, pyuria, proteinuria, and urinary casts). Each of the 4 measures has a score of up to 4 points; thus, the rSLEDAI score ranges from 0 (inactive renal disease) to 1616,17.
Patient samples
Serum samples were obtained from patients and stored at −40°C until use (up to 3 weeks) and freeze-thawed just once. A 10-ml urine sample from each patient was centrifuged at 900 g to remove the sediment and stored following the same conditions as described above. When urinary infection was suspected, a new urinary sample was collected aseptically for bacterial culture. Twenty-four-hour urine protein measurements were performed for routine monitoring of kidney impairment. A kidney biopsy was conducted at the same time as the blood collection. All laboratory tests and renal biopsy were carried out at HSPE laboratories.
Methods
Indirect immunofluorescence method (IIF) using HEp-2 cells as antigenic source was performed to quantify ANA, according to the instructions of the manufacturer (Biocientifica SA). A serum screening test was performed at 1/40 dilution and positive samples were further diluted to 1/1250. Interpretation of immunofluorescence pattern was based on the criteria recommended by II Brazilian Consensus on Antinuclear Antibodies in HEp-2 cells18. An IIF technique using Crithidia luciliae (obtained in-house) was carried out to quantify the anti-dsDNA antibody with an initial serum dilution of 1/20, followed by serial dilution to 1/1260 for positive samples. The IIF was read using an epifluorescence microscope with ultraviolet lamp.
Serum levels of C3 and C4 were determined by nephelometry (BNTM II System; Dade Behring), according to the directions of the manufacturer. Reference values were 90 to 180 mg/dl for C3 and 10 to 40 mg/dl for C4.
Serum creatinine concentration and daily urine protein excretion were analyzed by the Advia 1650 Chemistry System (Bayer HealthCare), according to the instructions of the manufacturer. Reference values ranged from 0.6 to 1.2 mg/dl for serum creatinine and 0.02 to 0.14 mg/dl for proteinuria.
MCP-1 ELISA
The serum and urinary MCP-1 (sMCP-1 and uMCP-1, respectively) levels were measured by specific sandwich ELISA, according to the instructions of the manufacturer (BioSource International Inc.). Briefly, a monoclonal antibody specific for human MCP-1 (Hu MCP-1) was coated onto 96-well plastic plates. Serum samples diluted 1/4 and urine samples and standards of known Hu MCP-1 content were pipetted into those wells, followed by the addition of a second biotinylated polyclonal antibody. After incubation for 2 h at room temperature, the wells were washed 4 times to remove the excess of the second antibody, and streptavidin-peroxidase (enzyme) was added. After incubation for 30 min at room temperature, the wells were washed again. The reaction was developed with stabilized chromogen (hydrogen peroxidase and tetramethylbenzidine solution). After addition of the stop solution, optical density was read at 450 nm with a microtiter plate reader. For the standard curve, 8 different concentrations (0 to 1000 pg/ml) of recombinant human MCP-1 were assayed. The concentration of uMCP-1 was calculated by a regression curve using the Excel software. The results of sMCP-1 were multiplied by 4 and uMCP-1 was standardized to urine creatinine measured in the same spot urine and expressed as pg/mg Cr.
For screening purposes, a cutoff value of uMCP-1 (cutoff A) was determined based on the mean value of results obtained in the control group plus 2 SD. Results higher than this cutoff value were considered positive and lower values were considered negative. A second cutoff value (cutoff B) was defined by the receiver-operation characteristic (ROC) curve to identify the activity among patients with LN19.
Statistical analysis
The statistical comparison of the 4 groups regarding age, ethnic background, sMCP-1, and uMCP-1 was carried out using ANOVA and Tukey’s test. When the data were not considered normal or homogeneous, Kruskal-Wallis and weighted Mann-Whitney U tests were used, the latter to indicate the presence of any group with a significantly different distribution from the other groups. The statistical comparison between 2 groups was performed using Student’s t-test when the data exhibited normal distribution; otherwise, the Mann-Whitney U test was used. To compare categorical variables among the groups, either chi-square test or Fisher’s exact test was used, when appropriate. Correlations were determined using Spearman’s coefficient. A p value < 0.05 was considered statistically significant. The SPSS v. 15.0 program was used for the statistical analysis.
RESULTS
Demographic data
The 4 groups were analyzed with regard to age, disease duration, and ethnic background. The A-LN group had a significantly lower age compared with groups R-LN and NR-SLE (p < 0.001). The A-LN group also had a significantly lower mean disease duration in comparison to the other groups (p < 0.001). There were no significant differences among groups regarding ethnic background (p = 0.707; Table 1).
Demographic features of the population studied: ethnic background, age, and disease duration. Data are n (%) or mean ± SD.
Clinical and laboratory findings
The 3 groups of patients with SLE were analyzed using the SLEDAI-2K. A-LN was the only group with significantly different distribution from the others (p < 0.001). Only patients with kidney involvement were evaluated for results of complement components (C3 and C4), anti-dsDNA, creatinine, proteinuria, and rSLEDAI (Table 2).
Clinical and laboratory findings of patients with SLE. Except for p values and where otherwise indicated, data are mean ± SD.
Statistically significant differences were not observed between groups A-LN and R-LN regarding C3 and C4 complement fragments, positive and negative results of anti-dsDNA, and serum creatinine. However, a significantly different distribution of proteinuria was detected between those 2 groups (p < 0.001). The rSLEDAI score was not calculated in the R-LN group because the SD was zero.
Concentration of sMCP-1
The mean concentration of sMCP-1 did not differ significantly among the 4 studied groups (p = 0.246; Table 3).
Mean concentration of serum and urinary MCP-1 in the 4 study groups. Data are mean ± SD.
Concentration of uMCP-1
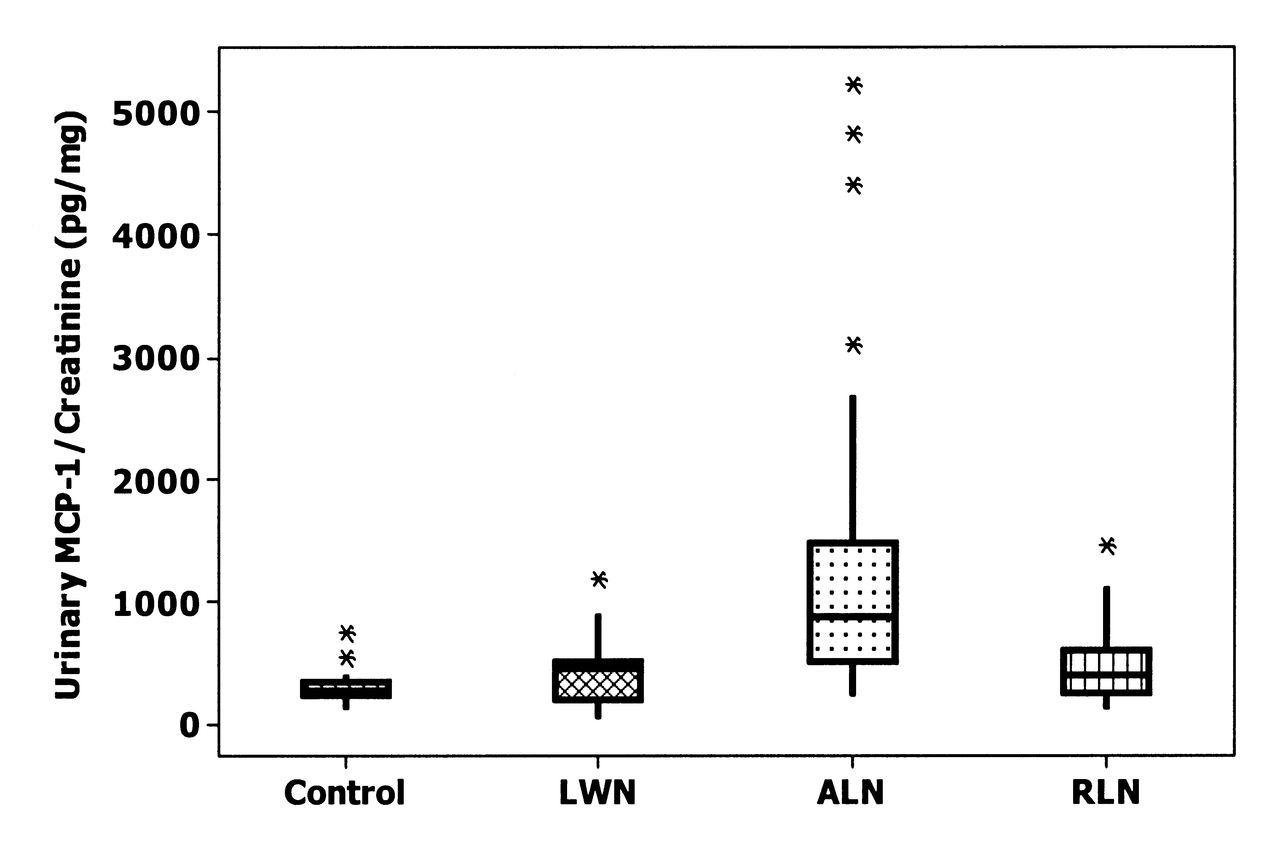
The A-LN group presented significantly higher mean concentration of uMCP-1 than the other groups (p < 0.001; Table 3, Figure 1).

Urinary MCP-1 in the 4 groups studied. MCP: monocyte chemotactic protein; LWN: lupus without nephritis; A-LN: active lupus nephritis; R-LN: lupus nephritis in remission.
Correlation of sMCP-1 and uMCP-1
No significant correlation was observed between mean levels of sMCP-1 and uMCP-1 in any of the groups, particularly in the A-LN group (p = 0.246).
Correlation of uMCP-1 with other measures
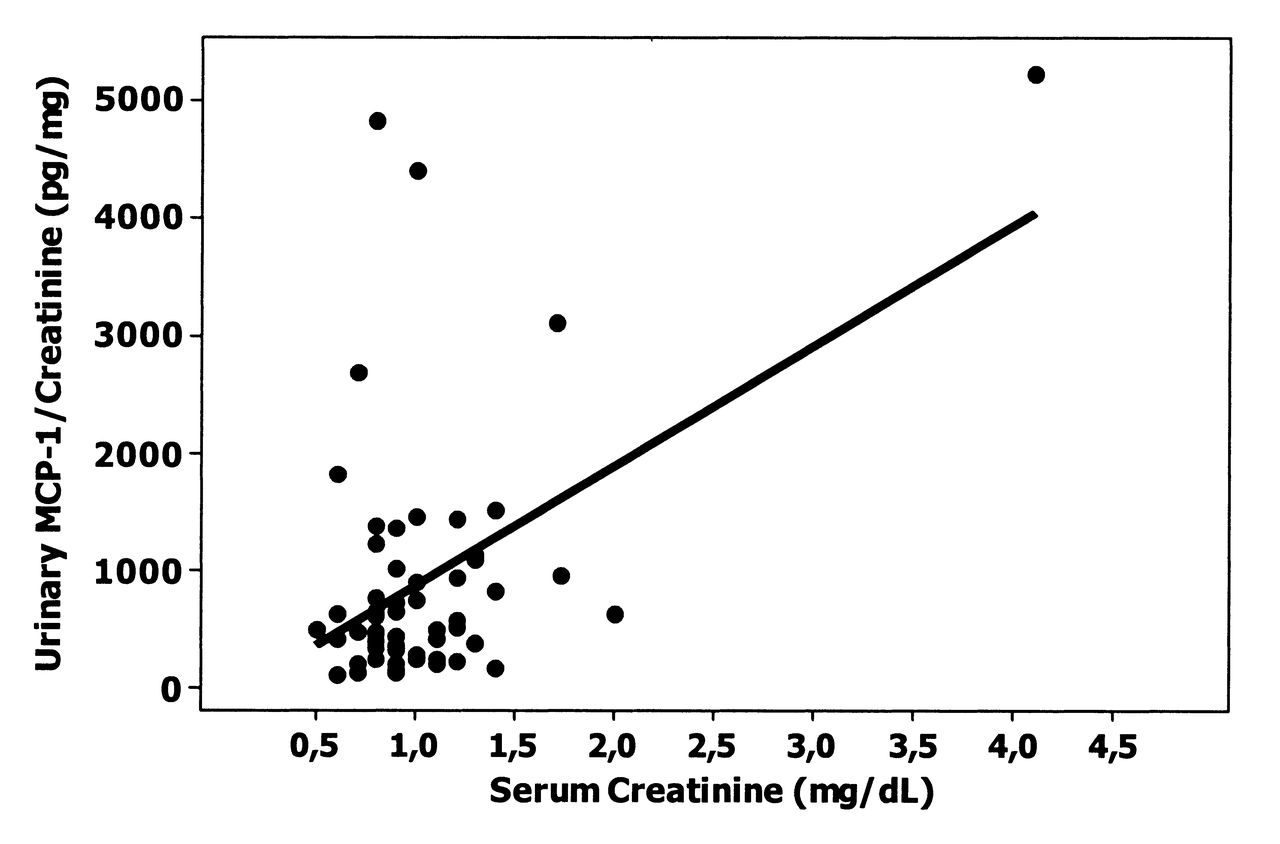
The positive correlation between uMCP-1 and serum creatinine in A-LN was statistically significant (r = 0.363, p = 0.048; Figure 2). Similarly, the correlation between the SLEDAI-2K and uMCP-1 levels was statistically significant in the same group (r = 0.386, p = 0.035). A significant difference in the distribution of uMCP-1 concentrations was observed when patients with an rSLEDAI score of 0 (R-LN group) and those with an rSLEDAI score of 4 or higher (A-LN group) were compared (p < 0.001; Figure 3). Unexpectedly, an association between the levels of uMCP-1 and anti-dsDNA antibody positivity in A-LN was not observed (p = 0.607). Nor did serum C3 and C4 values in A-LN show a significant correlation with uMCP-1 levels (p = 0.442; p = 0.868, respectively). No significant correlation between proteinuria and uMCP-1 values in the A-LN group was noted (p = 0.176).

Correlation between uMCP-1 and serum creatinine concentrations in active lupus nephritis group (r = 0.363, p = 0.048). uMCP: urinary monocyte chemotactic protein.
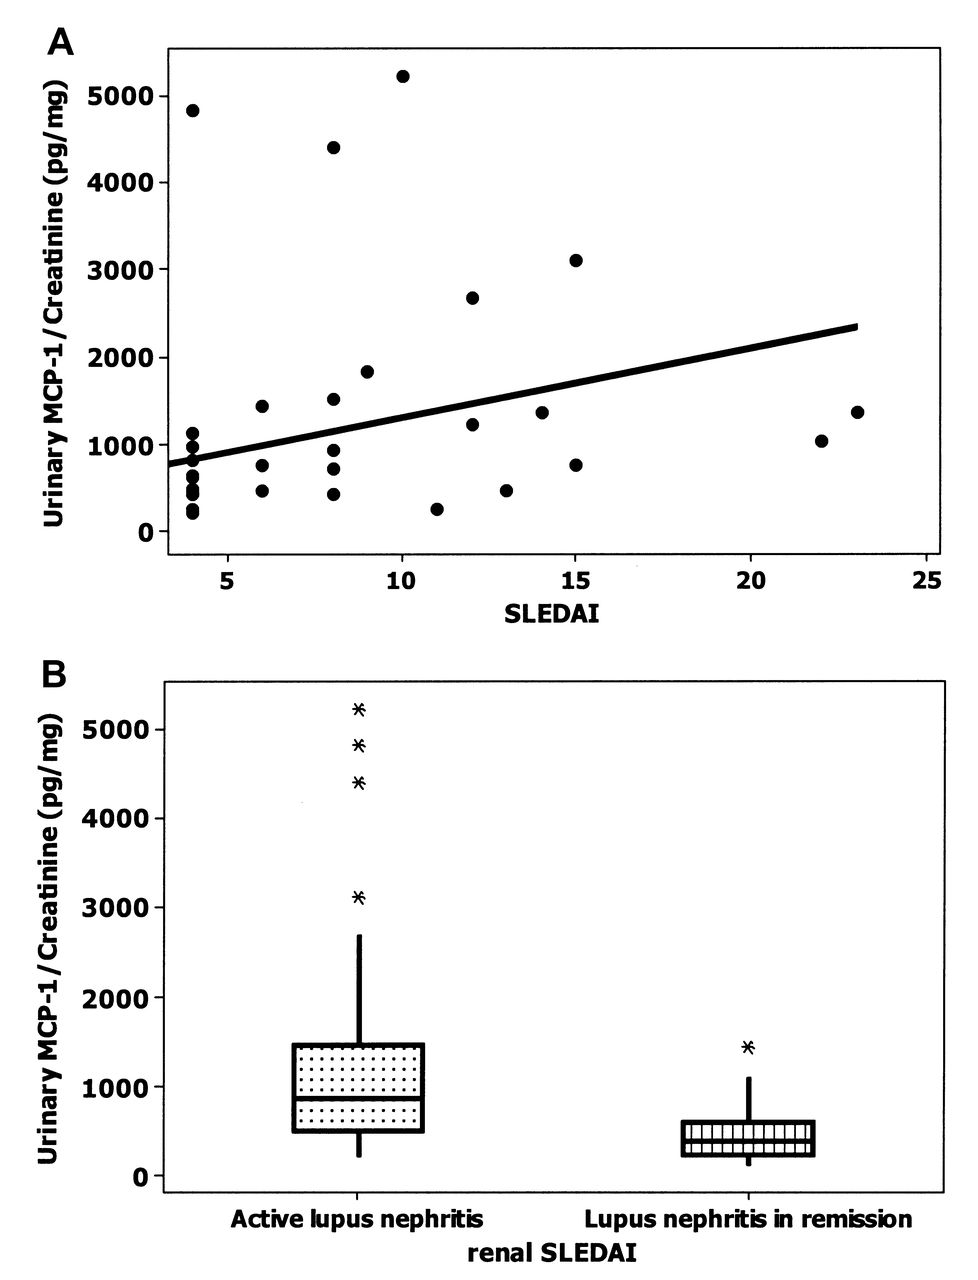
uMCP-1 concentrations correlate with lupus nephritis activity. (A) Correlations between uMCP-1 concentration and SLEDAI-2K in A-LN group (r = 0.386; p = 0.035). (B) uMCP-1 concentration and rSLEDAI in A-LN and R-LN groups (p < 0.001). uMCP: urinary monocyte chemotactic protein; SLEDAI-2K: Systemic Lupus Erythematosus Disease Activity Index 2000; rSLEDAI: renal SLEDAI; A-LN: active lupus nephritis; R-LN: lupus nephritis in remission.
Use of uMCP-1 in the diagnosis of active LN
For clinical purposes, we have established the reference value for uMCP-1. Cutoff A was set at 596.2. It is for interpretation of the result of uMCP-1 when it is used as a screening test for the detection of active LN among the outpatient population, and was based on the results of the control group. The frequency of positive results for uMCP-1 in the A-LN group was significantly higher than in groups R-LN and NR-SLE (p < 0.001; Table 4). To determine the usefulness of uMCP-1 and to identify specifically those with disease activity among patients with LN, cutoff B was established. Cutoff B is for the interpretation of the result of uMCP-1 to detect disease activity among patients with LN, considering the R-LN group as a reference.
Frequency of positive results for urinary MCP-1 in active lupus nephritis (A-LN); remission lupus nephritis (R-LN), and nonrenal systemic lupus erythematosus (NR-SLE) groups. Data are n (%).
The ROC curve was applied to determine the accuracy of the uMCP-1 concentration in patients with active LN. Establishing a specificity value of 90%, the point of the ROC curve chosen as the cutoff was 870.38, which showed a sensitivity of 50% (Figure 4).

Receiver-operation characteristic curve for determination of accuracy of the uMCP-1 test in LN (A-LN and R-LN groups; area under the curve = 0.806 ± 0.107). LN: lupus nephritis; A-LN: active LN; R-LN: LN in remission; uMCP: urinary monocyte chemotactic protein.
DISCUSSION
Monitoring kidney impairment is essential in SLE because of the unpredictable course of LN and the requirement for prompt treatment. No measures used to date in clinical practice have an adequate correlation with renal activity in SLE. Thus, the availability of a noninvasive, easily obtained biomarker with good accuracy would be useful in the followup of the disease6.
Recent studies have demonstrated the importance of cytokines and chemokines in the pathogenesis of LN, and their renal secretion may be excellent laboratory measures for assessment of disease activity. Among the different chemokines described, uMCP-1 is considered a sensitive and specific biomarker of nephritic flares in SLE4.
Our clinical investigation involved female patients between 20 and 60 years of age. As presented in Table 1, mean age and duration of disease were significantly lower in the A-LN group compared to the R-LN and NR-SLE groups. These results corroborate the data in the literature. Indeed, kidney impairment in younger patients occurs more commonly in the initial phase of disease, and its rapid progression to the severe form allows early diagnosis20.
The sMCP-1 and uMCP-1 concentrations were determined for the 4 groups. No significant difference was observed in the mean concentrations of sMCP-1 among the groups. Some authors8,11 have reported the same poor correlation between serum levels of this chemokine and LN activity. These results highlighted the poor performance of this biomarker in the diagnosis of LN activity; therefore, we did not analyze them.
Concerning uMCP-1, a significant difference in mean urinary chemokine level was found only in the A-LN group. The mean concentration in this group was about 3-fold greater than in the R-LN and NR-SLE groups. Otherwise, in the R-LN group, a single sample presented a uMCP-1 level 3-fold higher than the mean value observed in this group. According to a prospective study by Rovin, et al12, this finding may be explained by the increase in uMCP-1 levels in the 4 months preceding renal flare or its gradual decrease for a period of 4 months following the remission of renal activity. Besides the significant increase of uMCP-1 in patients with active LN, the authors found that uMCP-1 levels remained high despite the use of immunosuppressive therapy. The authors suggested that uMCP-1 is also an additional marker of renal activity even in patients under maintenance treatment12.
As in other studies, we did not find a significant correlation between the serum and urinary chemokines, thereby confirming the local production of uMCP-18,9.
We found a positive correlation between uMCP-1 and serum creatinine level. Our results corroborate those reported by Chan, et al21. The same significant correlation was observed by Rovin, et al, both during the renal activity and 2 months after flare12.
Significant correlations between the anti-dsDNA antibodies and the concentration of uMCP-1 were not observed. In the literature, the correlation between those antibodies and uMCP-1 remains controversial. Wada, et al did not find an association between the levels of uMCP-1 and anti-dsDNA antibodies, measured by radioimmunoassay11. However, in a study on the functional MCP-1 polymorphism in SLE and LN, Tucci, et al observed that the A/A genotype was more common in the control group than in patients with SLE, whereas both the A/G and G/G genotypes were more frequent in SLE patients with LN22. Further, patients with those genotypes have increased MCP-1 production, both peripherally and locally, within the kidney. In addition, they showed that patients with anti-dsDNA antibodies had even higher levels of uMCP-1 when compared to patients who were negative for anti-dsDNA22.
In murine models of lupus GN (MRL/lpr), pharmacological blockade or genetic deletion of MCP-1 reduced glomerular and interstitial inflammation, as well as kidney damage, regardless of the presence of anti-dsDNA antibodies10,23. Divergences among recent reports may be attributed to the pathogenic role of anti-dsDNA, as well as methodological differences in the tests used. While two-thirds of patients with SLE have positive serum anti-dsDNA, not all of them will develop clinical manifestations of LN24. Therefore, only some populations of anti-dsDNA antibodies are pathogenic, depending on their structural, immunochemical, and physicochemical properties, such as affinity for the antigen, charge (cationic), isotype (IgG1, IgG3), and idiotype25,26,27.
In recent years, evidence has been published regarding the controversial correlation between anti-dsDNA antibodies and LN activity. Some authors have found a correlation between the presence of anti-dsDNA antibodies and disease activity, and changes in the antibody levels are more important than their absolute value in the indication of renal flare. Thus, the followup of anti-dsDNA may be useful in predicting disease activity28. However, some recent prospective studies have demonstrated an elevation in the levels of those antibodies over a period of 2 to 3 months, followed by a rapid reduction at the time of disease activity29,30,31. It is most likely that an increase in anti-dsDNA levels could not occur simultaneously with higher uMCP-1 excretion.
The tests most often used for detection of anti-dsDNA antibody in clinical practice are Crithidia luciliae immunofluorescence and ELISA. These methods differ in the source of DNA and the antigen used, as well as different populations of antibodies that can be detected32,33. Thus, results obtained from different methods cannot be compared.
Regarding complement components, significant correlation between the serum levels of C3 and C4 and levels of uMCP-1 were not obtained. Similar results were also recently reported by Kong, et al, who found that complement measurements can assist in the diagnosis and be used as measures to assess disease activity34. However, normal or even increased complement levels were seen in some samples of the A-LN group. This may be explained by the balance between the uptake and synthesis of each component of the complement. In some cases, a tendency toward a drop in uptake may be surpassed by an increase in synthesis rate, resulting in levels within the normal range35.
Concerning 24-h urinary protein excretion, there was no significant correlation between the values of proteinuria and uMCP-1. Such correlation is rather controversial in the literature. Indeed, Tucci, et al22 found a positive correlation between proteinuria and uMCP-1, as did Chan, et al21. On the other hand, some authors did not observe any correlations between this urinary chemokine and 24-h proteinuria8,11. These authors found that patients with LN in remission and persistent proteinuria had levels of uMCP-1 comparable to that of the control group. The authors also noted that in patients with GN from other etiologies (membranous glomerulonephritis, glomerulopathy with minimal lesions, and diabetic nephropathy) and persistent proteinuria, the levels of uMCP-1 were similar to those of the group of healthy individuals. Altogether, these data suggest that the loss of glomerular permselectivity properties in LN does not account for the high levels of uMCP-1.
The SLE activity assessment tools (SLEDAI-2K and rSLEDAI) used in our study showed significant correlations with uMCP-1 levels. These results corroborate those reported by some authors21,36. It can be concluded that determination of uMCP-1 using the SLEDAI-2K and rSLEDAI may improve the assessment of SLE flare.
To use the uMCP-1 test for detection of LN activity among the outpatient population, cutoff A was initially established (596.2). Only the A-LN group stood out significantly from the other groups. Hence, the positivity of uMCP-1 suggests the possible presence of active LN. These data demonstrate that uMCP-1 is a promising biomarker for the assessment of patients with SLE. To identify the presence of activity among patients with LN, cutoff B was established (870.38). Under the conditions of our study, it had a 50% sensitivity. However, the high specificity of 90% makes this test a useful predictor of renal activity, especially when associated with other measures used in clinical practice.
There are some limitations of our study. The number of patients with active LN who underwent renal biopsy was small (only 10 out of 30). Thus, it was not possible to establish correlation between the results of biopsies performed and the urinary concentration of MCP-1. In addition, we did not recruit patients with clinically active SLE but no renal involvement. Since MCP-1 has been considered as a promising biomarker of LN, we deliberately focused on the renal involvement of SLE.
We found that uMCP-1 determined by ELISA showed a significant correlation with LN activity and may therefore be useful as an additional predictor of renal disease activity associated with other laboratory measures.
- Accepted for publication July 3, 2012.


