

Abstract
Objective. The current validated magnetic resonance imaging (MRI) scoring method for rheumatoid arthritis (RA) in clinical trials, RA MRI Score (RAMRIS), incorporates all metacarpophalangeal (MCP) and wrist joints except MCP-1. The experience with radiographic scoring, however, was that excluding certain bones in the wrist improved the discriminative power for changes over time. In this study, we pool MRI data from randomized controlled clinical trails (RCT) to determine which combination of MCP and wrist joints are most sensitive and discriminative for structural changes over time.
Methods. MR images from 4 multicenter RCT, including 522 RA patients, were read by 2 radiologists, using the RAMRIS scoring system for erosion, osteitis, and synovitis. In one RCT, joint-space narrowing (JSN) was assessed cross-sectionally by one radiologist using a previously validated method. Baseline frequencies of erosion, JSN, osteitis, and synovitis of different bones and joints in the hand and wrist were compared. Intraclass correlation coefficients between readers were determined for each location. Finally, 7 different combinations of bone/joint locations were compared for their ability to discriminate subjects showing increases or decreases from baseline greater than or equal to smallest detectable changes (SDC) at Weeks 12 or 24.
Results. Frequency of involvement and reliability for assessing change varied by location. As in earlier analyses, excluding certain wrist bones increased the percentage of subjects showing changes greater than or equal to SDC.
Conclusion. These findings suggest that excluding wrist bones that do not frequently or reliably demonstrate structural changes improves the discriminative power of the RAMRIS scoring system.
When John Sharp originally developed the radiographic scoring method to assess structural changes in rheumatoid arthritis (RA) that was to become his namesake, it included more joints in the hands and wrists than are used today; all but the distal interphalangeal (DIP) joints. In 1985, Sharp and others conducted a large study1 to determine which joints should be assessed. Sharp argued that the choice of joint locations should be based on the frequency of involvement and reliability of scoring those locations. The latter intuitively depended on the expertise and experience of the reader, but another important determinant was image quality. As radiography is a projectional imaging technique, which generates 2-dimensional (2D) images of 3D anatomy, it is subject to morphological distortions and superimposition of overlying structures, which may obscure certain joints, making them hard to score reliably. Using cluster analysis and comparisons of various combinations, a number of joints that were infrequently involved and/or hard to read were excluded from the original scoring system, and a combination including 17 locations for erosion and 18 for JSN was proposed as optimally discriminative1. These were further reduced to 16 and 15, respectively, by van der Heijde2 and 14 and 13 by Genant3. More recently, magnetic resonance imaging (MRI) has broadened the scope of disease features assessable in RA to include synovitis and osteitis, and has also offered increased sensitivity for bone erosion and the ability to view anatomy tomographically, obviating the problem of projectional superimposition of radiography. Thus, some of the reasoning behind excluding assessment of certain joints in radiographic scoring did not necessarily apply to MRI. Accordingly, when the Outcome Measures in Rheumatology Clinical Trials (OMERACT) MRI Working Group developed the initial draft of the RA MRI Score (RAMRIS) more than a decade ago4, as many joints in the hand and wrist as possible were included, with the exception of DIP 1–5, interphalangeal (IP) 1, proximal interphalangeal (PIP) 2–5 and metacarpophalangeal (MCP) 1. Distal interphalangeal joints were excluded for the same reason as they were for radiography, i.e., infrequent involvement in RA, but also because of spatial resolution limitations and the frequency of flexed positioning seen with the MRI techniques that were used in the original exercise. Despite the importance of the pincer action of the thumb for normal hand function, MCP-1 was excluded from RAMRIS because of difficulties capturing the entire joint on all images. This is because MCP-1 is located at the proximal margin of the field of view (FOV) used to image the MCP and at the distal margin of the FOV used to image the wrist. Additionally, palmar abduction of the thumb can position MCP-1 below the extent of through-plane coverage on coronal scans.
MRI has since been increasingly used in randomized controlled trials (RCT), and over the past 5 to 6 years, 8 trials, including approximately 4000 patient-visits, were imaged with relatively similar MRI protocols and read by the same radiologists. Many of these RCT are still under way, but sufficient data have accumulated to permit some of the questions posed by John Sharp 15 years ago concerning radiography to be applied now to MRI.
MATERIALS AND METHODS
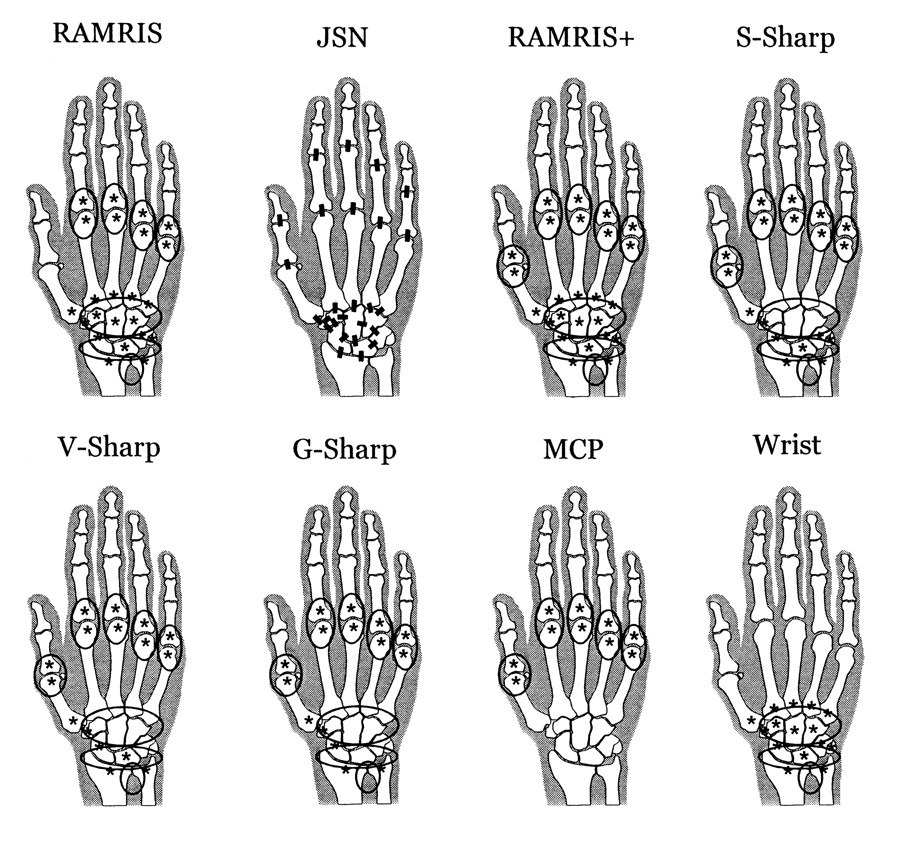
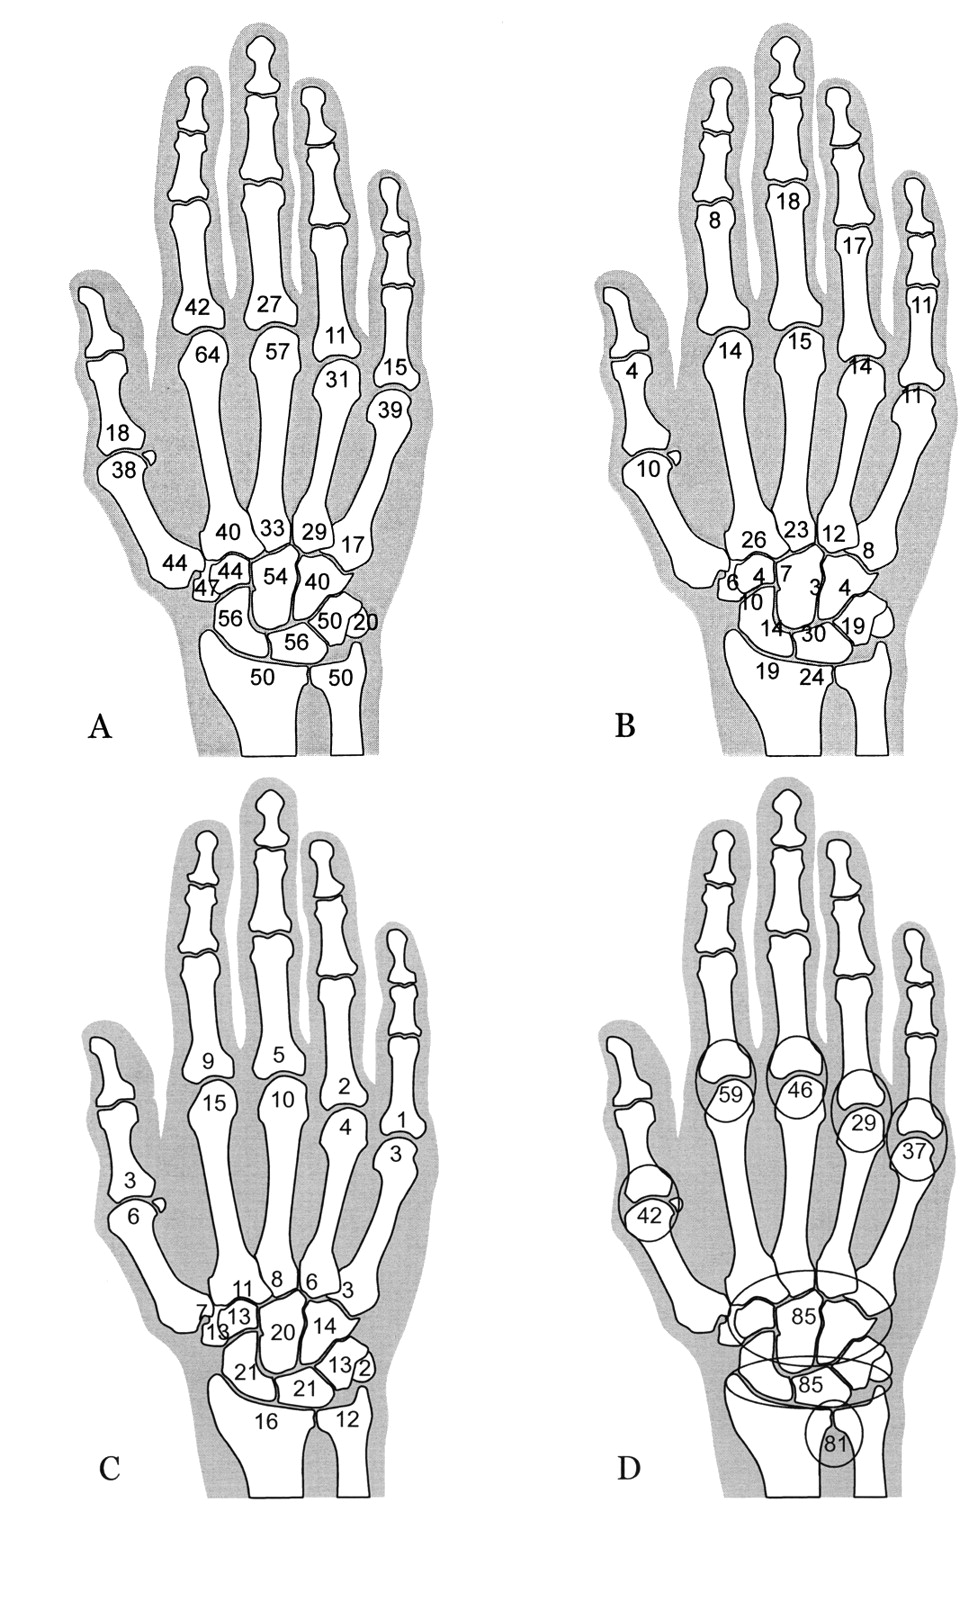
Sponsors of the 8 RCT were approached, and contributed data from 4 trials (conducted between 2005 and 2010) including a total of 522 RA patients. Two trials used only conventional 1.5 T MRI, one trial used only 0.2 T extremity MRI, and one trial acquired both 1.5 T and 0.2 T MR images for each patient. Thus, a total of 459 patients had 1.5 T MRI, and 118 patients had 0.2 T MRI. Three of the RCT used a specially designed hand frame to ensure reproducible positioning. The hand (MCP and PIP) and wrist were scanned separately in all cases. All examinations included coronal short-tau inversion recovery (STIR) and coronal 3-dimensional (3D) T1-weighted gradient echo (GRE). Fat suppression was included on GRE scans acquired at 1.5 T. Two RCT also included axial STIR of MCP and wrist, and one included axial 3D GRE of the wrist. Three of the RCT included 3D GRE of the MCP and/or wrist following intravenous injection of gadolinium-based contrast agent. One experienced radiologist (CP) scored all the images from all 4 RCT. A second experienced radiologist independently scored the images from 2 of these RCT, and a third radiologist independently scored the images from one of the other 2 RCT. Each radiologist viewed all images for an individual patient simultaneously, but in random order and blinded to examination date and therapy. Metacarpophalangeal joints 1–5 and all bones and joints of the wrist [for the purposes of this analysis carpometacarpals (CMC) 2–5, distal radius, and distal ulna were considered part of the wrist] were scored using RAMRIS4 for erosion in all 4 RCT and also for synovitis and osteitis in 3 RCT (Figure 1). In one trial, JSN was scored cross-sectionally by one of the radiologists using a previously validated method5 at the locations shown in Figure 1. Data from the 4 RCT were pooled, and baseline frequencies of erosion, JSN, osteitis, and synovitis in the hands and wrists were compared. Similarly, interreader agreement [intraclass correlation coefficients (ICC)] was determined for each location. Seven combinations of bones and joints [RAMRIS: 23 bones and 7 joints in original RAMRIS; RAMRIS+: RAMRIS plus MCP-1; S-Sharp: MCP 1–5 plus 8 wrist bones in Sharp-modified Sharp radiographic score1; V-Sharp: MCP 1–5 plus 6 wrist bones in van der Heijde-Sharp radiographic score2; G-Sharp: MCP 1–5 plus 5 wrist bones in Genant-Sharp radiographic score3 (V-Sharp minus lunate); MCP: MCP 1–5; Wrist: 15 bones and 3 joints in RAMRIS] (Figure 1) were compared in terms of percentages of patients with changes (increases or decreases) ≥ 0.5 (the smallest increment of change based on an average of 2 readings), and greater than or equal to the smallest statistically significant change (smallest detectable change, SDC)6 at Weeks 12 or 24 compared with baseline. All analyses were blinded to treatment assignment to ensure confidentiality of individual study data and therapeutic efficacy.

Locations scored. Asterisks indicate locations scored for erosion and osteitis. Ovals indicate locations scored for synovitis. Bars indicate locations scored for joint space narrowing (JSN). Note that JSN evaluations excluded CMC-1 (because of the high frequency of osteoarthritis in this location), the navicular-lunate and distal radioulnar joints (because of frequent dissociation of these joints due to ligament rupture), and the triquetrumpisiform joint (because of poor orientation on coronal images).
RESULTS
Of 21,510 bones and 6270 joints assessed, only 9% and 6%, respectively, were not evaluable because of incomplete anatomical coverage, poor image quality, ankylosis (erosion only), or surgery. Joints IP-1 and PIP 2–5 were not evaluable in 25%–36% of images, MCP-1 in 17% of images over all, but only in 4% of those from the most recent RCT. At least in part, this improvement was due to the use of an acrylic positioning frame in 3 of the 4 studies to ensure alignment of the thumb. Frequency of involvement at baseline by erosion, JSN, osteitis, and synovitis varied considerably by bone/joint location (Figure 2). The distributions of erosion and JSN were similar to those reported by Sharp, et al1 with radiography (Figure 3). With both modalities MCP-2 was the most frequently eroded joint in the hand, followed by MCP-3. Similarly in the wrist, the navicular (NAV) (scaphoid) was the most frequently eroded bone, and the metacarpal bases, or proximal metacarpals (PM), the least frequently eroded bones by both modalities. However, the difference between the propensity for erosion of the navicular (NAV), radius (RAD), ulna (ULN), and trapezium (TPM) and that of the other wrist bones was greater by radiography than by MRI. Also, CMC-2 had a higher relative frequency of JSN, and naviculo-trapezium (NT) and capitate-hamate (CH) lower relative frequencies of JSN by MRI than by radiography.

Frequency (%) of involvement by erosion (A), joint space narrowing (B), osteitis (C), and synovitis (D). Based on pooled baseline data from 4 RCT. Values for joint space narrowing correspond to the joint nearest the value.

Relative frequency of erosion (upper panel) and joint space narrowing (lower panel) by location on magnetic resonance imaging (MRI) and radiography. MRI data based on pooled baseline data from 4 randomized controlled trials. Radiographic data (X-Ray) based on a different cohort of RA patients, as adapted from Sharp, et al1. Values are normalized to the highest frequency of involvement in each location. Locations are ordered from highest to lowest MRI value. Wrist and hand (MCP or MCP, PIP) were analyzed separately. CAP: capitate; TRQ: triquetrum; CNL: capitate-navicular-lunate; CMC; carpometacarpal; RC: radiocarpal; LT: lunate-triquetral; NT: navicular-trapezium; HT: hamate-triquetral; CH: capitate-hamate.
Similar erosion patterns by MRI were observed in all 4 RCT (Figure 4) and between patients with early (< 2 yrs) RA and established (> 10 yrs) RA (based on pooled results; data not shown). The frequency of osteitis in the pooled data set was on average 5.7-fold less than that of erosion, but showed a similar pattern of involvement across the different bones of the hand and wrist (Figures 2 and 5). Similar osteitis and synovitis patterns were observed in all 4 RCT (data not shown).
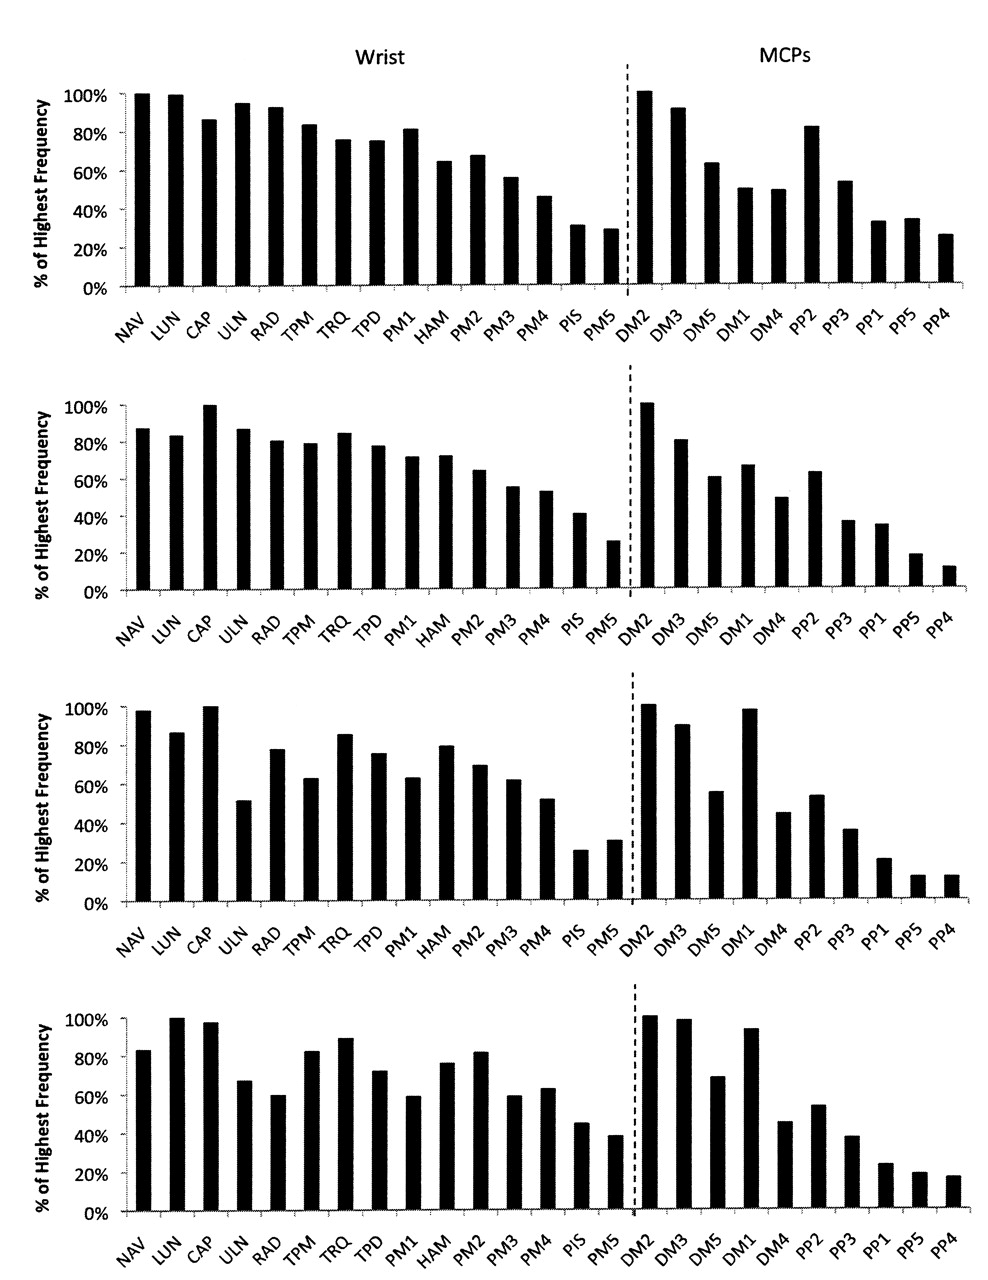
Relative frequency of bone erosion by location among the 4 randomized controlled trials. Values were normalized to the highest frequency location in each cohort. Locations are rank-ordered from highest to lowest value for MRI of the pooled data. Wrist and MCP data were analyzed separately.

Frequency of bone erosion and osteitis by location. Values based on pooled data. Note similar pattern of involvement consistent with osteitis being a precursor of bone erosion. Wrist and MCP data were analyzed separately.
Interreader agreement varied among bone/joint locations. Median (range) ICC values were 0.84 (0.65–0.92) for erosion, 0.88 (0.46–0.94) for osteitis, and 0.81 (0.74–0.86) for synovitis. The pattern of variation of ICC differed from that of the frequency of involvement by erosion, osteitis, or synovitis. Accordingly, SDC values varied widely among the 7 combinations of bones and joints assessed (Figure 6).
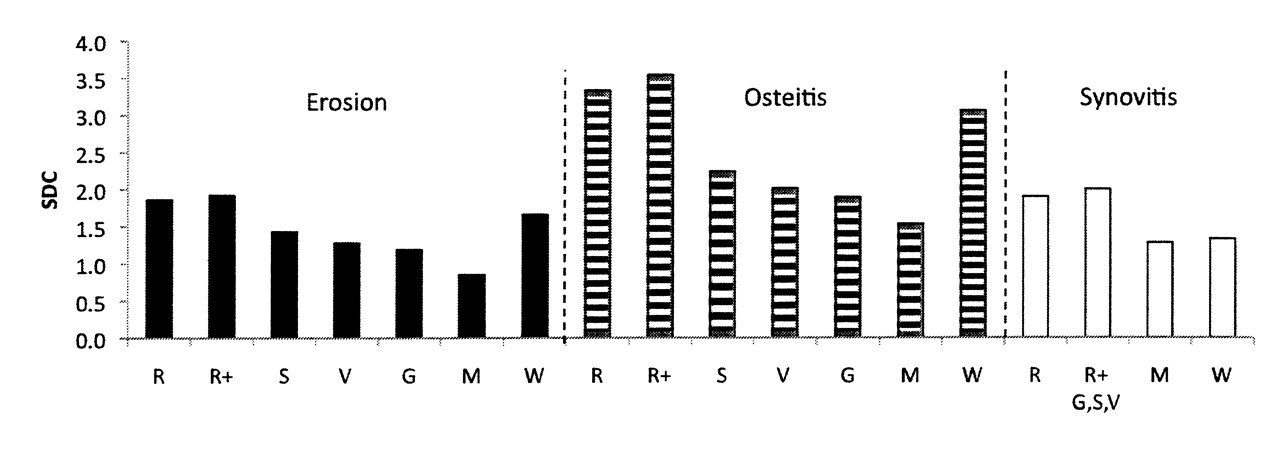
Smallest detectable change (SDC) varies widely for different combinations of bones and joints. Based on pooled baseline, 12-week, and 24-week data from 3 randomized controlled trials (RCT; the fourth RCT had only baseline data). R: RAMRIS; R+: RAMRIS+; S: S-Sharp; V: V-Sharp; G: G-Sharp; M: MCP; W: wrist.
Figure 7 shows the percentage of patients with change scores increased or decreased from baseline by ≥ 0.5 units or greater than or equal to SDC at 12 or 24 weeks for each combination of bones/joints assessed, based on pooled results from 3 of the RCT (only baseline data were available for the fourth RCT). When the minimum measurable change (≥ 0.5 units, accounting for variability between readers, and indicating that at least one of the 2 readers scored at least 1 unit of change) was used as the threshold, the percentage of patients with changes from baseline varied primarily with the number of bones or joints included in the combination. The more locations assessed, the greater the cumulative change measured, e.g., RAMRIS+. However, when SDC was used as the threshold, relatively larger percentages of patients were discriminated by combinations with fewer wrist bones/joints, e.g., S-Sharp.
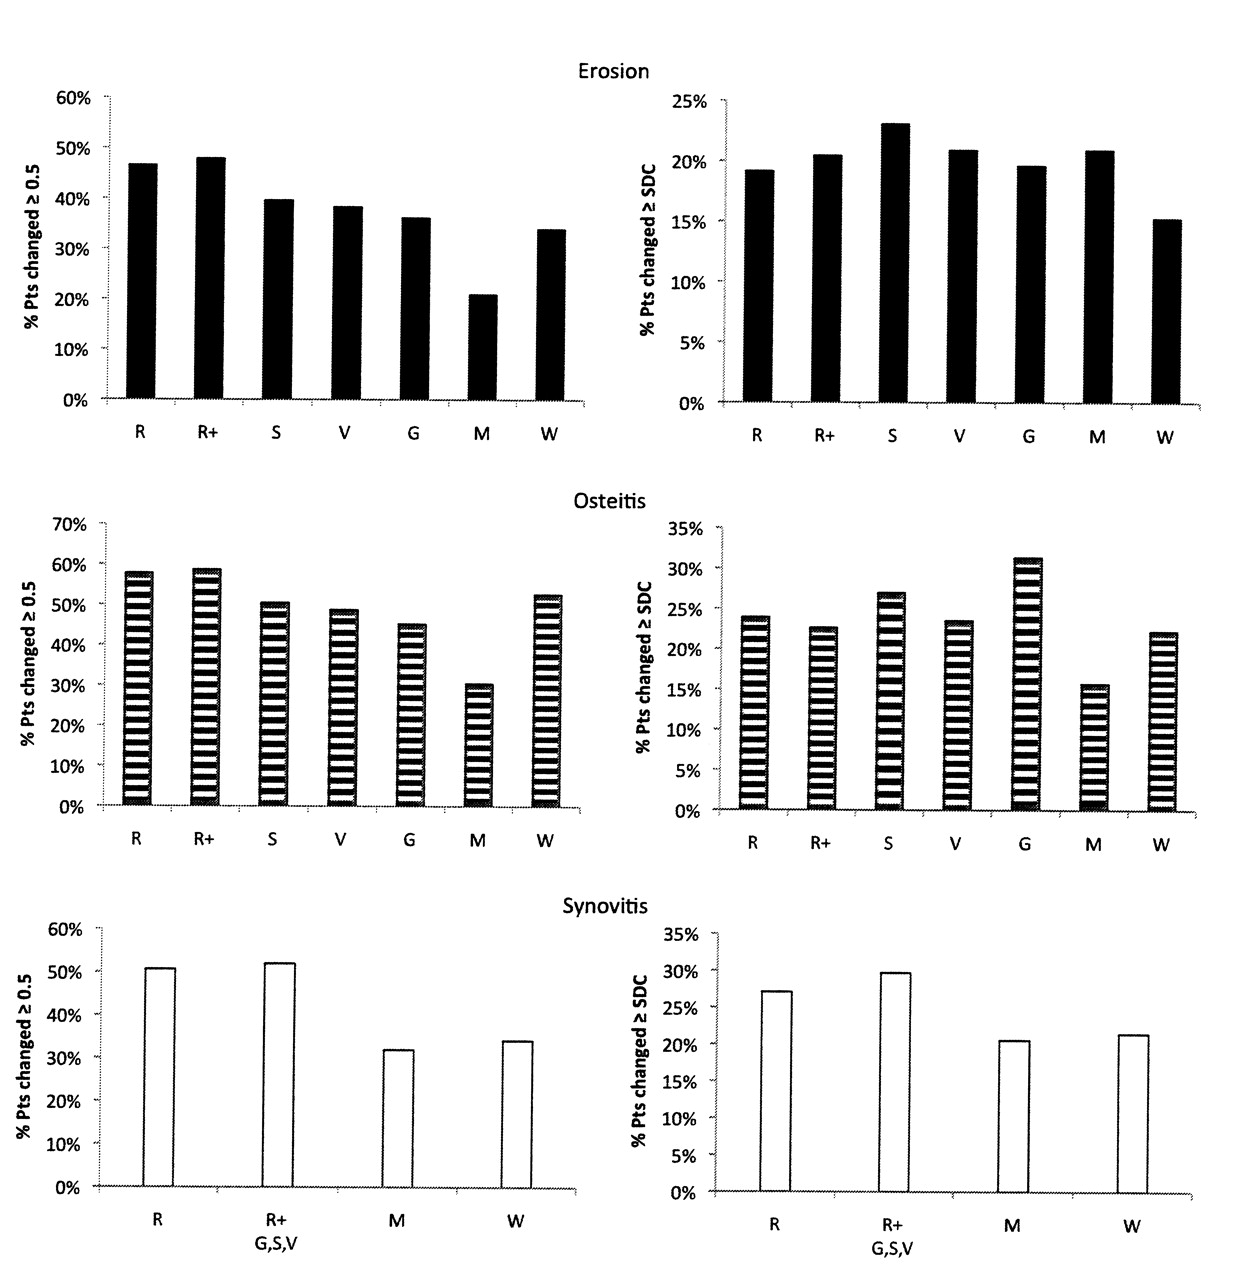
Discriminative power of different combinations for identifying patients who increased or decreased in erosion, osteitis, or synovitis ≥ 0.5 (left) or greater than or equal to smallest detectable change (right). Based on pooled baseline, 12-week, and 24-week data from 3 randomized controlled trials (RCT; the fourth RCT had only baseline data.) R: RAMRIS; R+: RAMRIS+; S: S-Sharp; V: V-Sharp; G: G-Sharp; M: MCP; W: wrist.
DISCUSSION
Erosions and JSN showed similar distributions of relative frequency of involvement by MRI as by radiography, particularly in the hands. However, while the navicular was the most frequently eroded wrist bone with both modalities, by MRI all but one of the remaining wrist bones showed at least 50% of the navicular’s propensity to erode, whereas by radiography only 3 of the same bones were > 40% as likely to show erosion as was the navicular. Also, CMC-2 had a higher relative frequency of JSN, and navicular-trapezium and capitatehamate relatively lower frequencies of JSN by MRI than by radiography. It is not clear whether this was due to differences in the accuracies of the 2 imaging modalities or to differences between cohorts evaluated.
Frequency of osteitis was less than that of erosion at all locations, but followed a similar pattern of involvement, consistent with the current view that osteitis is a precursor of bone erosions7,8,9.
Scoring reliability also varied by bone/joint location, but with a different pattern than that observed for frequency of involvement by erosion, osteitis, and synovitis. Accordingly, the pattern of variability of the percentage of patients with statistically significant changes (greater than or equal to SDC) from baseline between the different combinations of bone/joint locations assessed was complex. As when ≥ 0.5 units was used as the threshold for change, adding MCP-1 to RAMRIS (RAMRIS+) increased discrimination for erosions and synovitis greater than or equal to SDC. However, eliminating certain wrist bones from the assessment also increased discrimination against SDC. Thus, S-Sharp was most discriminative for erosions, and G-Sharp, which included the fewest wrist bones aside from the MCP combination, was most discriminative for osteitis, and equivalent to RAMRIS for erosions. Since RAMRIS+, S-Sharp, V-Sharp, and G-Sharp all included the same combination of joints assessed for synovitis, the same discriminative power for change was demonstrated. Remarkably, eliminating all wrist locations (leaving only MCP) actually increased discrimination for erosions over that with the RAMRIS scoring system. However, MCP showed poorer discrimination for osteitis and synovitis than did the other combinations of bone/joint assessments, including the wrist alone.
One of the strengths of this analysis is that the same radiologists, who were highly experienced in RAMRIS and had worked together for many years, read all the images. Thus, reader variability was minimized. It is possible, however, that readers with different backgrounds or levels of experience performing RAMRIS would yield different results. Additionally, analyses were based on pooled results from patients receiving different structure-modifying therapies, and were blinded to treatment assignment to ensure confidentiality of individual study data and therapeutic efficacy. It is not certain that the pattern of discriminative power for specific therapeutic effects would be the same as that observed for any change using this pooled data.
In conclusion, this investigation demonstrated that bone erosions and JSN exhibit a consistent pattern of involvement in the hand and wrist when visualized with MRI as when visualized with conventional radiography (excluding PIP erosions, which were not examined). Moreover, osteitis shows this same pattern of involvement, consistent with the current view that it is a precursor of erosions. Finally, filtering out bones and joints that are infrequently involved or are difficult to read, such as many of the bones in the wrist, may improve the ability of MRI to discriminate the proportion of patients with significant changes from baseline in bone erosion and osteitis. Interestingly, the optimal combinations of MCP and wrist locations arrived at by Sharp and colleagues for radiographic assessment of RA some 15 years ago appear to be the same combinations that demonstrate the greatest discriminative power with MRI, namely S-Sharp, V-Sharp, and G-Sharp. Determining which combination optimally balances functional relevance with reading reliability, however, requires further investigation.


