

Abstract
Objective. To examine the relationship between arthritis and fracture.
Methods. Women were classified into 3 self-reported groups at baseline: no arthritis (n = 83,295), osteoarthritis (OA; n = 63,402), and rheumatoid arthritis (RA; n = 960). Incident fractures were self-reported throughout followup. Age-adjusted fracture rates by arthritis category were generated, and the Cox proportional hazards model was used to test the association between arthritis and fracture.
Results. After an average of 7.80 years, 24,137 total fractures were reported including 2559 self-reported clinical spinal fractures and 1698 adjudicated hip fractures. For each fracture type, age-adjusted fracture rates were highest in the RA group and lowest in the nonarthritic group. After adjustment for several covariates, report of arthritis was associated with increased risk for spine, hip, and any clinical fractures. Compared to the nonarthritis group, the risk of sustaining any clinical fracture in the OA group was HR 1.09 (95% CI 1.05, 1.13; p < 0.001) and HR 1.49 (95% CI 1.26, 1.75; p < 0.001) in the RA group. The risk of sustaining a hip fracture was not statistically increased in the OA group (HR 1.11; 95% CI 0.98, 1.25; p = 0.122) compared to the nonarthritis group; however, the risk of hip fracture increased significantly (HR 3.03; 95% CI 2.03, 4.51; p < 0.001) in the RA group compared to the nonarthritis group.
Conclusion. The increase in fracture risk confirms the importance of fracture prevention in patients with RA and OA.
With an increasing number of older adults in our society, osteoporosis has become a major public health concern. Fragility fractures, the most devastating outcome associated with osteoporosis, have been shown to lead to increased pain and disability, decreased quality of life1, and higher mortality rates2. Age and bone mineral density (BMD) are the primary risk factors associated with osteoporosis and fragility fractures3, but others noted in the World Health Organization fracture assessment calculator include sex, weight, height, history of fractures, history of parental hip fracture, smoking, alcohol use, history of secondary osteoporosis, glucocorticoid (GC) use, and the presence of certain comorbid conditions such as rheumatoid arthritis (RA)1.
RA is a multisystem inflammatory disorder characterized by inflammation and destruction of synovial joints4. Patients with RA have lower BMD5,6,7 and an increased fracture risk compared to nonarthritic controls8,9,10. RA affects about 1% of the general population11, while osteoarthritis (OA), a commonly used arthritic comparison population in RA studies, affects about 30% of adults, making it the most common arthritic condition.
OA is typically not associated with fractures, and was previously considered a “protective” factor against them. Studies by Cumming and Klineberg12, Dequeker and Johnell13, and Kanis, et al14 showed a reduction in fracture risk in OA cases, and studies by Jones, et al15 and Arden, et al16 showed no increased or reduced risk in fractures among OA cases. In contrast, Bergink, et al17 and a subsequent study by Arden, et al18 found an increased risk in their OA cases.
Arthritis, in general, is one of the largest public health concerns for aging populations. In the United States, direct and indirect costs attributable to arthritis and other rheumatic conditions have been estimated to total $128 billion19, and the number of individuals diagnosed is expected to increase an average of 16% by 203020. If arthritis, particularly OA, is associated with an increased risk of fractures, then the increasing arthritis prevalence would indicate a potential increase in fracture outcomes and associated complications.
Our primary goal was to investigate fracture risk in a group of multiethnic postmenopausal self-reported arthritis cases compared to nonarthritic controls. We tested whether the association is modified by ethnicity or GC use.
MATERIALS AND METHODS
The association between arthritis and fracture was evaluated prospectively using data from the Women’s Health Initiative (WHI). The exposure (arthritis status) was self-reported by participants at baseline. The outcome (incident fractures) was reported over the followup period. All participants gave written consent to participate in the WHI, and the University of Arizona Institutional Review Board approved our study.
Women’s Health Initiative
The WHI is a nationwide study that investigated the risk factors and preventive strategies of the major contributors to morbidity and mortality in postmenopausal women from the United States, including heart disease, breast and colorectal cancer, and osteoporotic fractures21. The WHI recruited 161,808 postmenopausal women aged 50 to 79 years from 40 centers across the country to participate in the clinical trials (CT) component, including the hormone therapy trials, the dietary modification trial, and the calcium and vitamin D trial, or the observational study (OS). Details of recruitment strategies and baseline participant information have been published22.
Defining arthritis status
The WHI health assessment form was used to identify arthritis status at baseline. The participants were asked, “Did your doctor ever tell you that you have arthritis?”, with responses of yes or no. Women responding “yes” were then asked, “What type of arthritis do you have?”, with responses of “rheumatoid arthritis” and “other/do not know.” For this study, the arthritis exposure variable consists of 3 categories: (1) a nonarthritic control group, including the women who answered “no” to the initial arthritis question; (2) an OA group, including those women answering “yes” to the initial arthritis question and answering “other/do not know” on the arthritis type question; and (3) an RA group, those women reporting RA as arthritis type plus one of the commonly used rheumatologic treatment medications.
Wright and colleagues previously published that the “other/do not know” group serves as the proxy for OA23, and Walitt and colleagues found that the combination of self-report and medication had the highest positive predictive value (62.2%) for defining RA within the WHI compared to self-report alone24. Women were excluded if they did not respond to the initial or followup arthritis question, if they reported RA but did not report one of the treatment medications of interest, or if they reported other rheumatologic or inflammatory arthritic conditions including systemic lupus erythematosus or ulcerative colitis.
Fracture determination
The participants self-reported clinical fractures during periodic medical updates (every 6 months for women participating in the CT, and yearly for the women participating in the OS). The WHI collected information on fractures of the upper and lower arm, elbow, spine, tailbone, hip, upper and lower leg, and foot, but excluded fractures of the ribs, sternum, skull, or face. Centrally trained and masked physicians assessed all fractures reported in the CT and all hip fractures (CT and OS) by review of radiological reports or medical records25. The fractures of interest in this analysis included total (all types of fracture), clinical spine, and hip.
Covariates
Variables associated with arthritis and/or fractures were considered as possible covariates including age, race/ethnicity, body mass index (BMI), education, income, physical activity, hospitalizations, number of falls in the previous year, smoking status, alcohol use, hormone use, parental fracture at age > 40 years, total calcium and vitamin D intake, depression score, years since menopause, personal fracture after age 55 years, joint replacements, general health score, and use of certain medications (phenobarbital, anticonvulsants, anti-Parkinson drugs, antidepressants, antianxiety drugs, thyroid medications, thiazolidinediones, proton pump inhibitors, thiazide diuretics, statins, bisphosponates, calcitonins, nonsteroidal antiinflammatory drugs, estrogens, heparin, and selective-estrogen receptor modulators).
All covariates were assessed at baseline. Height and weight were measured using standardized procedures by WHI clinical staff, and were used to calculate BMI (kg/m2). Race/ethnicity was classified into 6 categories: American Indian or Alaskan Native, Asian or Pacific Islander, African American, Hispanic/Latino, White (not of Hispanic origin), or other. Women reported highest level of education completed, if they had been hospitalized in the last 2 years (yes or no), fracture at age of 55 years or older (yes or no), and the number of times they fell to the ground in the past 12 months (0, 1, 2, ≥ 3). Summary variables were generated based on questions regarding parental fractures (yes or no), physical activity (metabolic equivalence units per week), hormone use (never, past, or current user), smoking status (non, past, or current smoker), and alcohol use (non, past, or current drinker). Years since menopause was calculated based on reported last menstrual period. Questions from the Rand 36-Item Health Survey were used to compute a general health measure, and questions from the Center for Epidemiologic Studies Depression Scale (CES-D) were used to calculate a depression score. Dietary calcium and vitamin D amounts generated from food frequency questionnaire data were combined with amounts reported from supplemental use to generate total calcium and vitamin D variables. Binary variables for each class of drugs were used. Bisphosphonates and calcitonin were combined to create an osteoporosis medication summary variable. Variables related to the WHI design, such as clinical trial assignment (not randomized, placebo, or intervention), were also included as covariates.
Statistical analysis
Descriptive statistics by arthritis group were performed using ANOVA for continuous variables and chi-squared tests for categorical variables. Age-adjusted fracture rates and 95% CI by arthritis group were calculated using direct standardization. Cox proportional hazards models were used to test difference in risk of fracture among groups. Days from randomization to fracture served as the event time, and days from randomization to last contact served as the censoring time for those who did not fracture. Marginal analyses were performed for each covariate, which was included in the full model if the covariate was significant (p < 0.2 at the 0.05-α level) in a 2-sided test. Backward elimination techniques were used to produce the final model, including all variables statistically (p < 0.05) or biologically significant. Survival estimates were generated to graphically portray group differences in fracture risk. Ethnicity and GC interactions were tested using cross-product interaction terms (e.g., arthritis*ethnicity) and stratified analyses. All analyses were performed in Stata v. 10 (StataCorp, College Station, TX, USA).
RESULTS
Of the 161,808 women enrolled in the WHI, 147,657 were not missing arthritis information and did not report systemic lupus erythematosus or ulcerative colitis. Of them, 83,295 (56.4%) were included in the nonarthritic control group. Of the women who reported arthritis, 63,402 (43.0%) were placed in the OA group, and 960 women (0.65%) met the criteria for the RA group. All other women were excluded from analyses.
Differences in baseline demographic and lifestyle variables were present by arthritis group. The OA and RA groups were significantly older than the nonarthritic control group, with the OA group being on average 2.92 years older (Bonferroni p value < 0.001) than the nonarthritic control group, and the RA group being on average 2.86 years older (Bonferroni p value < 0.001) than the nonarthritic controls. The arthritis groups had a larger percentage of African Americans compared to the nonarthritic control group (RA: 13.2%, OA: 9.3%, nonarthritic control: 8.2%). In a posthoc chi-squared test, the percentage of African Americans in the OA group was found to be significantly higher than in the nonarthritis group (p < 0.001), and similarly the percentage of African Americans in the RA group was significantly higher (p < 0.001) than in the nonarthritis group. The OA group had the highest mean weight (75.5 kg), followed by the RA group (73.2 kg) and the nonarthritic control group (71.7 kg). The weight of the OA group was significantly higher than that of the nonarthritis group (Bonferroni p value < 0.001) and the RA group (Bonferroni p value < 0.001), and the RA weight was significantly higher than that of the nonarthritis group (Bonferroni p value = 0.025). There were statistically significant differences in the percentage of hospitalization in the last 2 years (RA: 28.0%, OA: 18.4%, no arthritis: 11.6%; overall p < 0.001) and history of fracture at ≥ 55 years of age (RA: 20.0%, OA 18.8%, no arthritis 14.1%; overall p < 0.001). Complete descriptive information with overall ANOVA and chi-squared test p values can be found in Tables 1 and 2.
Baseline characteristics of categorical variables by arthritis status. All variables are significantly different among the 3 groups at p < 0.001, with the exception of thiazolidinediones (p = 0.020).
Baseline characteristics of continuous variables by arthritis status. All variables significantly different among the 3 groups at p < 0.001.
Fractures in the WHI
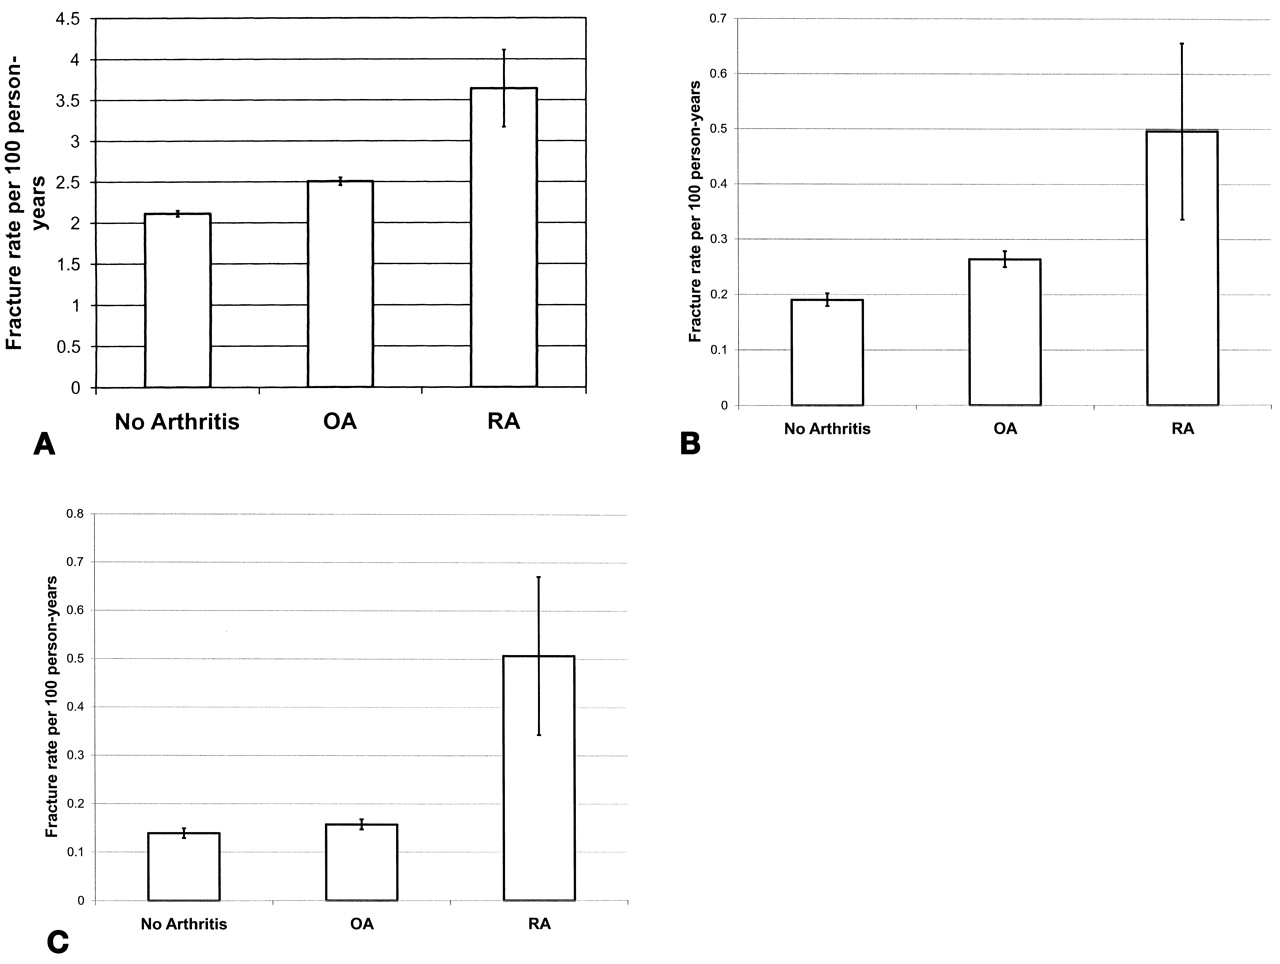
As of March 2008, the women were followed for a mean of 7.80 (SD 1.54) years. There were 24,137 clinical fractures of any type, among them 2559 of the spine and 1698 of the hip (Table 3). The age-adjusted rate per 100 person-years for sustaining total fractures (fracture of any type) was 2.11 (95% CI 2.08, 2.15) in the nonarthritic control group, increasing to 2.51 (95% CI 2.46, 2.55) in the OA group, and 3.64 (95% CI 3.17, 4.11) in the RA group (Figure 1A). The age-adjusted spine fracture rate increased from 0.19 to 0.26 per 100 person-years between the control group and the OA group, and increased again to 0.50 per 100 person-years in the RA group (Figure 1B). There was no difference in hip fracture rates between the control group and the OA group (0.14/100 vs 0.16/100, respectively), but there was an increase in the hip fracture rate in the RA group (0.51/100; Figure 1C).

Fracture rates by arthritis status. Age-adjusted rates per 100 person-years and 95% CI. OA: osteoarthritis; RA: rheumatoid arthritis.
Frequency of fracture in the subjects assessed under the Women’s Health Initiative, sorted by arthritis status.
Testing the association between arthritis and fracture risk
No significant interaction between ethnicity or GC use was found in the association between arthritis and fracture. Covariates included in the final Cox proportional hazards model included age, race/ethnicity, BMI, physical activity, assignment in all clinical trials, hospitalizations, number of falls, smoking status, hormone use, parental fracture > age 40, personal fracture ≥ age 55, total calcium and vitamin D intake, depression score, years since menopause, joint replacements, use of diabetic and osteoporosis medications, and general health score. In comparison to the nonarthritic control group, there was a significant risk for sustaining any type of fracture in both the OA (HR 1.09; 95% CI 1.05, 1.13) and RA groups (HR 1.49; 95% CI 1.26, 1.75; Table 4). In comparison to the nonarthritic control group, the risk of clinical spine fracture was 1.17 (95% CI 1.05, 1.29, p = 0.004) and 1.93 (95% CI 1.29, 2.90, p = 0.001) in OA and RA groups, respectively (Table 4). No significant increase in hip fracture risk was observed in the OA group (HR 1.11; 95% CI 0.98, 1.25) compared to the nonarthritic control group; however, a highly significant increase in hip fracture risk (HR 3.03; 95% CI 2.03, 4.51) was observed in the RA group compared to the nonarthritic control group (Table 4).
The risk of fracture by arthritis group. Data were adjusted for age; race; body mass index; physical activity; assignment in the hormone therapy trials, the dietary modification trial, and the calcium and vitamin D trial; hospitalizations; falls; smoking; hormone use; parental fracture at > age 40 years; calcium and vitamin D intake; depression score; years since menopause; diabetic treatments; osteoporosis medication; general health score; fracture at > age 55 years; and joint replacements.
DISCUSSION
In this large population of postmenopausal women, self-reported arthritis is associated with significant increase in fracture risk in women reporting OA and RA. After controlling for several covariates, the RA group had a highly significant increased risk of all fractures studied (HR total 1.49, HR spine 1.93, HR hip 3.03) in comparison to the nonarthritis group. Modest significant increases in total (HR 1.09) and clinical spine (HR 1.17) fracture risk were seen in the OA group in comparison to the nonarthritis group, but no significant increase in hip fracture risk was seen. The associations found between arthritis and fracture were not modified by race, ethnicity, or GC use in our study.
The RA findings are consistent with the literature, showing an increased risk of fractures in patients with RA9,10,26. Incidence of any, spine, and hip fracture in the Consortium of Rheumatology Researchers of North America (CORRONA) registry was reported to be 3.71, 0.78, and 0.66 per 100 person-years, respectively27. The age-adjusted fracture rates for the RA group were 3.64, 0.49, and 0.50 per 100 person-years for total, spine, and hip fracture in the WHI, and although the CORRONA registry includes premenopausal women and men, the incidence rates of the nationwide CORRONA registry are comparable to the rates found in the WHI.
General lifestyle and demographic osteoporosis risk factors, such as age, smoking, and physical activity, play a significant role in fracture risk1, but the primary risk factor for fracture is low BMD. It has been well documented that patients with RA have lower BMD at many skeletal sites compared to various control populations6,7,28, and although we did not examine BMD, it is highly probable that the associations seen are in part driven by BMD. A sensitivity analysis in the participants from 3 WHI clinical centers with available BMD measurements was proposed; however, it could not be adequately completed because of the low frequency of fractures (total fractures, 22; clinical spine fractures, 2; hip fractures, 3) in the smaller RA group (n = 78).
The risk of sustaining any clinical fracture and a spinal fracture was modestly but significantly increased in the OA group compared to the nonarthritic controls. It is likely that the effects of OA on fracture rate are underestimated in this study because of the misclassification inherent in self-reporting OA. As mentioned, the association between OA and fracture has been mixed in the literature. The most recent study to suggest that OA increases the risk of fractures, by Arden and colleagues, found that after adjustment for falls and the use of walking aids, patients with clinician-diagnosed knee OA had a significant risk for nonvertebral fractures (1.48; 95% CI 1.00, 2.19), and no significant association was seen between clinician-diagnosed knee OA and risk for hip fracture (1.84; 95% CI 0.78, 4.34)18. Although our results are in agreement with the Arden study, the use of patients with clinically diagnosed, site-specific OA yielded higher fracture estimates than those found in our study using self-reported OA cases.
In contrast, the most recent study showing a protective effect of OA on fracture risk was a case-control population-based study conducted in Denmark. After adjustment for several variables, Vestergaard and colleagues found a significant risk reduction for any fracture and hip and spine fractures in participants with OA duration > 2 years29. Population demographics could be the primary explanation for the difference associations seen between the Vestergaard study and our report, as the Danish population used was almost 20 years younger than the WHI population.
Although a consensus has not been reached, several biological mechanisms have been proposed relating OA to fracture. Like RA, the increase in fracture in patients with OA could be driven through a BMD pathway. Studies have shown that BMD in OA populations is typically higher than that in nonarthritic populations30,31,32; therefore, this argument does not provide a good explanation for increases in fracture. Although patients with OA have a higher BMD, the quality or strength of the bones may be compromised compared to other arthritic and nonarthritic populations. Javaid and colleagues assessed hip structural geometry as a marker of bone strength in a group of patients with OA and found that alterations in geometry precede OA diagnosis33, suggesting that a biological process involved in OA potentially alters bone strength.
Falling is another proposed OA fracture mechanism. OA, especially at sites such as the knee and hip, is associated with increased pain, decreased postural stability, and decreased muscle strength, all of which have been shown to be significant contributors to fall risk34,35,36. Falling is a well documented risk factor for fractures1, and early studies have shown that the self-report of OA is associated with increased risk of falls37,38. Foley and colleagues did not see increased risk for falls in cases of radiographic knee and hip OA, but did see that report of pain is highly associated with falls and that patients with OA reported more pain39.
One last possibility is that our results represent the consequences related to behavioral and physiologic changes that occur in individuals who perceive articular discomfort they classify as arthritis. Poor self-rated health has been shown to be an independent risk factor for fractures in many studies40,41,42,43,44. It is possible that self-reported arthritis in the WHI is a measure of autoperception that encompasses a variety of health domains, such as pain, balance confidence, self-efficacy, and functional status.
Strengths and limitations
Our study has several limitations related to the arthritis exposure. The limitations associated with self-report of OA and the use of a proxy measure of OA within the WHI described by Wright and colleagues apply to this analysis23. Walitt and colleagues also found that self-reported OA in the WHI was very sensitive (95.0%), but not particularly specific (23.4%), and had only fair agreement between self-reported OA and chart review (κ = 0.23; unpublished data). The potential for the moderate amount of misclassification in the OA group would bias the results of this study to the null. People experiencing joint pain because of a previous injury, or having other soft-tissue conditions such as tendonitis or other noninflammatory arthritic conditions, may report having OA even though it has not been clinically diagnosed. This could also lead to a moderate amount of misclassification, again biasing the estimates toward the null.
Not having site-specific or radiographically confirmed OA cases is another limitation of this study. Fracture risk is probably different for persons with OA of the hip compared to persons with knee, hand, or spine OA. The OA-affected area may have a higher BMD, while regions without OA have normal or low BMD, potentially altering overall fracture risk.
Regarding the RA classification, the use of medication in the RA definition probably revealed true cases of RA, but these may represent the more severe cases, potentially over-estimating the effect of RA on fracture risk. We did not take into account incident cases of arthritis and the effect it has on fracture risk, nor the additive or multiplicative effect of having both conditions on fracture risk.
The use of self-reported fracture outcomes can also be seen as a limitation. Sensitivity analyses were performed using adjudicated fractures only. Slight changes in the point estimates were observed with the smaller sample size, but the overall conclusions did not change. Chen and colleagues found high agreement between self-report and adjudicated fractures in a WHI substudy45, assuring high quality of the fracture data used in our study.
Our study adjusted for several covariates, but was unable to adjust for GC use, as it was used in the definition of the RA group. To test the possible interaction of GC in the relationship between arthritis and fracture, a categorical variable was created separating users and nonusers in each arthritis group (data not shown). Although no interaction was present, the point estimate of the fracture risk was higher in GC users compared to nonusers, and by not adjusting for GC, the true fracture risk for women not taking GC was overestimated and the risk was underestimated for women using GC.
Although limited by these factors, our study has many strengths. The most notable is the size of the WHI and the size of each of the exposure groups. Having > 63,000 women in the OA group gave more than adequate power to estimate the effects OA has on fracture outcomes. Although not clinically determined, the prevalence of OA in the WHI population was about 43%, comparable to the 42% prevalence of radiographic OA in the hands, knees, and hips of the women age 60 years and older participating in the National Health and Nutrition Examination Survey-III46. The OA limitations presented would have resulted in estimates being biased toward the null; however, significant association remained in our study. Although not reaching general population prevalence estimates, the RA group sample size was large enough to confirm the association between RA and fracture. The WHI also had a larger percentage of women from minority groups, which allowed examination of effect modification by race and ethnicity. The women of the WHI were followed on average almost 8 years, ensuring adequate numbers of fracture outcomes, especially for the more rare hip fracture outcome.
Arthritis and osteoporosis are important public health concerns for older adults. OA and RA affect > 25 million adults in the United States, and fractures cost billions of healthcare dollars annually. The increase in fracture risk found in our study confirms the importance of fracture prevention in patients with RA and OA.
Acknowledgment
Many thanks are extended to the participants of the Women’s Health Initiative, the staff of the Healthy Aging Laboratory, M. Jane Mohler, and Duane Sherrill.
APPENDIX
List of study collaborators: Women’s Health Initiative investigators: Program Office: National Heart, Lung, and Blood Institute, Bethesda, MD: Elizabeth Nabel, Jacques Rossouw, Shari Ludlam, Linda Pottern, Joan McGowan, Leslie Ford, and Nancy Geller. Clinical Coordinating Center: Fred Hutchinson Cancer Research Center, Seattle, WA: Ross Prentice, Garnet Anderson, Andrea LaCroix, Charles L. Kooperberg, Ruth E. Patterson, Anne McTiernan; Wake Forest University School of Medicine, Winston-Salem, NC: Sally Shumaker; Medical Research Labs, Highland Heights, KY: Evan Stein; University of California at San Francisco, San Francisco, CA: Steven Cummings. Clinical Centers: Albert Einstein College of Medicine, Bronx, NY: Sylvia Wassertheil-Smoller; Baylor College of Medicine, Houston, TX: Aleksandar Rajkovic; Brigham and Women’s Hospital, Harvard Medical School, Boston, MA: JoAnn Manson; Brown University, Providence, RI: Annlouise R. Assaf; Emory University, Atlanta, GA: Lawrence Phillips; Fred Hutchinson Cancer Research Center, Seattle, WA: Shirley Beresford; George Washington University Medical Center, Washington, DC: Judith Hsia; Los Angeles Biomedical Research Institute at Harbor—UCLA Medical Center, Torrance, CA: Rowan Chlebowski; Kaiser Permanente Center for Health Research, Portland, OR: Evelyn Whitlock; Kaiser Permanente Division of Research, Oakland, CA: Bette Caan; Medical College of Wisconsin, Milwaukee, WI: Jane Morley Kotchen; MedStar Research Institute/Howard University, Washington, DC: Barbara V. Howard; Northwestern University, Chicago/Evanston, IL: Linda Van Horn; Rush Medical Center, Chicago, IL: Henry Black; Stanford Prevention Research Center, Stanford, CA: Marcia L. Stefanick; State University of New York at Stony Brook, Stony Brook, NY: Dorothy Lane; The Ohio State University, Columbus, OH: Rebecca Jackson; University of Alabama at Birmingham, Birmingham, AL: Cora E. Lewis; University of Arizona, Tucson/Phoenix, AZ: Tamsen Bassford; State University at Buffalo, Buffalo, NY: Jean Wactawski-Wende; University of California at Davis, Sacramento, CA: John Robbins; University of California at Irvine, CA: F. Allan Hubbell; University of California at Los Angeles, Los Angeles, CA: Lauren Nathan; University of California at San Diego, LaJolla/Chula Vista, CA: Robert D. Langer; University of Cincinnati, Cincinnati, OH: Margery Gass; University of Florida, Gainesville/Jacksonville, FL: Marian Limacher; University of Hawaii, Honolulu, HI: David Curb; University of Iowa, Iowa City/Davenport, IA: Robert Wallace; University of Massachusetts/Fallon Clinic, Worcester, MA: Judith Ockene; University of Medicine and Dentistry of New Jersey, Newark, NJ: Norman Lasser; University of Miami, Miami, FL: Mary Jo O’Sullivan; University of Minnesota, Minneapolis, MN: Karen Margolis; University of Nevada, Reno, NV: Robert Brunner; University of North Carolina, Chapel Hill, NC: Gerardo Heiss; University of Pittsburgh, Pittsburgh, PA: Lewis Kuller; University of Tennessee, Memphis, TN: Karen C. Johnson; University of Texas Health Science Center, San Antonio, TX: Robert Brzyski; University of Wisconsin, Madison, WI: Gloria E. Sarto; Wake Forest University School of Medicine, Winston-Salem, NC: Mara Vitolins; Wayne State University School of Medicine/Hutzel Hospital, Detroit, MI: Susan Hendrix.
Footnotes
-
Supported by the National Institute of Arthritis and Musculoskeletal and Skin Diseases (R01 AR049411-04S1). The Women’s Health Initiative program is funded by the National Heart, Lung, and Blood Institute through contracts N01WH22110, 24152, 32100-2, 32105-6, 32108-9, 32111-13, 32115, 32118-32119, 32122, 42107-26, 42129-32, and 44221.
- Accepted for publication March 22, 2011.


