

Abstract
Objective. To assess whether different forms of arthritis and disease activity could be distinguished by peripheral blood expression profiles of bone-regulatory factors including tumor necrosis factor (TNF)-superfamily [TNF-related apoptosis-inducing ligand (TRAIL), the Fas ligand (FasL), and the ligand for herpesvirus entry mediator (LIGHT)] and bone morphogenetic protein (BMP)-family members (BMP-2, BMP-4, BMP-6) as well as osteoblast differentiation gene Runx2.
Methods. Blood cells from healthy controls (n = 25) and patients at different disease stages with rheumatoid arthritis (RA; n = 49), osteoarthritis (OA; n = 17), or spondyloarthritis, including ankylosing spondylitis (AS; n = 27) or psoriatic arthritis (PsA; n = 23), were processed for quantitative polymerase chain reaction. Gene expression was assessed in comparison with control samples, correlated with clinical data of different forms of arthritis, and analyzed for discriminative efficacy between groups by receiver-operation characteristic (ROC) curves. Results were confirmed on diagnostic RA (n = 5) and AS (n = 8) samples.
Results. BMP-4, BMP-6, and Runx2 expressions were significantly decreased in patients with RA and OA versus controls. Patients with RA also had decreased FasL and LIGHT expression, while patients with AS had increased Runx2 expression. Negative correlation with disease activity was found for BMP-4, FasL, and Runx2 in RA and for Runx2 in PsA, while positive correlation was found for BMP-4 in PsA. Gene expression was higher in the therapy-resistant form of AS (for BMP-4, LIGHT, and Runx2) and in methotrexate-treated patients in RA (for BMP-2 and LIGHT). ROC curve analysis confirmed discrimination between groups, particularly decreased LIGHT and Runx2 for RA and increased Runx2 for AS.
Conclusion. Our study identified BMP and Runx2 as possible biomarkers of bone metabolism in several forms of arthritis, while lower FasL and LIGHT were associated with RA. Correlation between gene expression and disease activity may be clinically useful in assessing therapeutic effectiveness and disease monitoring.
Chronic joint diseases affect more than a third of the world’s population and represent a major health problem because they cause disability, have progressive morbidity, and the therapy is only partially successful1–3. Several forms are classified in clinical practice, depending on their pathogenic mechanisms and primary target tissue as well as the severity of bone and cartilage destruction and intensity of reparative compensatory processes: osteoarthritis (OA), rheumatoid arthritis (RA), and spondyloarthritis (SpA)4–7. The latter includes ankylosing spondylitis (AS), psoriatic arthritis (PsA), reactive arthritis, arthritis associated with inflammatory bowel disease, and juvenile and undifferentiated forms of arthritis1,7.
Many cytokines and growth factors play a role in the pathogenesis of different forms of arthritis, and can act either as anabolic or catabolic regulators6–9. Their expression is altered not only at local sites of joint lesions but also systemically, affecting bone metabolism in general8–10. One of the best-studied groups of cytokines involved in arthritic disease is the tumor necrosis factor (TNF) superfamily, which includes several immunomodulatory and apoptotic mediators in arthritis 8–12. TNF-α, by its ability to promote inflammation and enhance osteoclastogenesis, drives the disease process in RA12,13, while the balance between receptor activator of nuclear factor-κB ligand and its decoy receptor osteoprotegerin determines the severity of bone resorption11,13. Defective TNF-related apoptosis-inducing ligand (TRAIL) and Fas ligand (FasL) apoptotic pathways are described as the underlying mechanisms of deficient apoptosis of autoreactive T lymphocyte and synovial cells in RA, leading to invasive synovitis characterized by cartilage destruction and subchondral bone erosion14–16. In addition, the ligand for herpesvirus entry mediator (LIGHT) and the proliferation-inducing ligand (APRIL) support lymphocyte infiltration and synovial fibroblast activation17–19. On the other hand, growth factors such as bone morphogenetic proteins (BMP), members of the transforming growth factor (TGF)-ß superfamily, have osteoinductive properties and may induce bone formation during tissue repair in arthritis6,7,20,21. Nevertheless, extensive heterotopic cartilage and bone formation deteriorates in some forms of arthritis, cumulating in joint ankylosis5,21.
The milieu of bone-regulatory cytokines and growth factors affects osteoblast differentiation and activity8–10, thus controlling extent of bone formation over destruction and reparative processes. Although the local effects of those factors are well studied in arthritis22, the role of systemic changes of their network in the regulation of bone metabolism in general is only partially revealed23–25. The gene of critical importance in the regulation of bone formation is runt-related transcription factor 2 (Runx2), essential for the expression of the osteoblast-specific genes and osteoblast differentiation26,27. Therefore, our aim was to assess if the systemic expression of various bone-regulatory factors including TNF superfamily and BMP family members as well as osteoblast differentiation gene Runx2 vary in different forms of arthritis and correlate with the disease activity, applied therapy, arthritis subtype, and other clinical variables. Gene expression profiling of those factors may identify novel molecular biomarkers of arthritis.
MATERIALS AND METHODS
Patient characteristics
After obtaining approval from the regional Ethics Committee and informed consent from patients, we included in the study patients with the following diseases: RA (n = 49); SpA, including AS (n = 27) and PsA (n = 23); and OA (n = 17). We also included healthy control subjects (n = 25) without history of autoimmune or joint diseases. Patients were enrolled on the basis of clinical diagnosis; their conventional treatment (depending on the diagnosis and clinical status) included disease-modifying antirheumatic drugs [DMARD; methotrexate (MTX), sulfasalazine, leflunomide, antimalaric agents, gold salts], corticosteroids and/or nonsteroidal antiinflammatory drugs (NSAID). For each type of arthritis, patients were clinically evaluated using standard clinical variables (Table 1). RA was diagnosed according to the revised American College of Rheumatology (ACR) criteria32, AS according to the modified New York criteria33, PsA according to the Moll and Wright’s criteria34 and OA according to ACR clinical classification criteria35. Demographic and clinical data of patients included in the study are summarized in Table 2. Patients with RA were divided into 2 subgroups by age: younger than 65 years (RA < 65) and older than 65 years (RA > 65). Those subgroups also differ in radiological Larsen score (Table 2). RA > 65 subgroup and patients with OA were significantly older than other groups. For selected patients with RA (n = 10) and AS (n = 10), who were treated with conventional therapy and showed improvement of the clinical status, followup of gene expression analysis was performed at five 3-month intervals after the initial sample collection. Finally, to confirm the findings obtained on patients already under treatment, we included diagnostic samples of a small group of patients with AS (n = 8) or RA (n = 5).
Clinical variables recorded in patients with different forms of arthritis.
Demographic and clinical data for arthritic patients and controls. Values are mean ± SD.
Quantitative polymerase chain reaction amplification
Peripheral blood was obtained from patients during routine clinical assessment, followed by peripheral blood mononuclear cell (PBMC) separation using Histopaque (Sigma-Aldrich, St. Louis, MO, USA). Total RNA was extracted from separated cells using the 6100 Nucleic Acid PrepStation (Applied Biosystems, Foster City, CA, USA). For polymerase chain reaction (PCR) amplification, 2 μg of total RNA were converted to cDNA by reverse transcriptase (Applied Biosystems). The amount of cDNA corresponding to 20 ng of reversely transcribed RNA was amplified by quantitative PCR, using specific commercially available TaqMan Assays (Applied Biosystems) in the ABI Prism 7000 Sequence Detection system (Applied Biosystems). Each reaction was performed in duplicate in a 25 μl reaction volume36. The relative quantities of unknown samples were calculated by using the standard curve designed from 6 serial dilutions of the calibrator sample (control PBMC). According to the standard curve, the relative amounts of messenger RNA for target genes were calculated as the ratio of the quantity of the target gene normalized to GAPDH as the endogenous control.
Statistics
Clinical data for each type of arthritis were presented as mean ± SD and compared using analysis of variance. Gene expression values between arthritic and control samples were expressed as median with the interquartile range (IQR) and compared using the nonparametric Kruskal-Wallis test followed by the Mann-Whitney test with Bonferroni’s correction for multiple testing. Differences in gene expression for each type of arthritis for binomic variables, such as resistance to therapy, were also assessed by the Mann-Whitney test. Difference between gene expression and disease activity score [DAS; DAS28 for RA and Bath Ankylosing Spondylitis Disease Activity Index (BASDAI) for AS] for the first and final followup time-point was tested using the Wilcoxon test. The receiver-operating characteristic (ROC) curve analysis was presented as area under the curve (AUC) with its 95% confidence interval (CI) and used to determine the efficacy of gene expression values to discriminate between different forms of arthritis and the control group. Diagnostic efficacy for gene expression values was assessed using the sensitivity and specificity at a cut-off point. Gene expression values were correlated to each other and to clinical data using rank correlation and Spearman’s coefficient rho (ρ) with its 95% CI. Statistical analysis was performed using the MedCalc software package (Mariakerke, Belgium). For all experiments, α-level was set at 0.05.
RESULTS
Gene expression in patients with arthritis and control samples
Because cytokines and growth factors mediate many of the local and systemic effects of chronic joint diseases6–9, we analyzed the expression of several BMP, TNF-superfamily molecules, and the osteoblast differentiation gene Runx2 in different forms of arthritis compared with control subjects. Patients with RA were divided into 2 subgroups depending on the patients’ age (RA < 65 and RA > 65; Table 2) because it allowed us to compare the expression of bone-regulatory factors depending on patients’ age, since some of the analyzed molecules may be age-regulated37; the RA < 65 subgroup was aged-matched with control, AS, and PsA groups; and the RA > 65 subgroup was age-matched with the OA group. Nevertheless, no statistical difference was found between the 2 RA patient subgroups (Figure 1), therefore in further analysis, in respect to the clinical measurements, we merged both RA subgroups.

Expression of bone morphogenetic protein (BMP-2, BMP-4, and BMP-6), tumor necrosis factor (TNF)-superfamily molecules [TNF-related apoptosis-inducing ligand (TRAIL), the Fas ligand (FasL), and the ligand for herpesvirus entry mediator (LIGHT)], and osteoblast differentiation gene Runx2 in the peripheral blood of control subjects (Ctrl) and patients with psoriatic arthritis (PsA), ankylosing spondylitis (AS), rheumatoid arthritis (RA < 65 years and RA > 65 years) and osteoarthritis (OA). Values are presented as RNA relative quantity in qPCR (quantitative polymerase chain reaction; median with interquartile range). *Significant difference compared with Ctrl samples (p ≤ 0.01). ** Significant difference compared with AS samples for BMP-4, FasL, and LIGHT expression; and PsA and AS samples for Runx2 expression (p ≤ 0.01). Kruskal-Wallis test followed by Mann-Whitney test with Bonferroni’s correction for multiple testing.
Expression of BMP-4 and BMP-6 was lower in patients with RA and OA in comparison to the controls (Figure 1). TNF-superfamily members LIGHT and FasL were also downregulated in patients with RA (Figure 1). In addition, the expression of BMP-4, FasL, and LIGHT was significantly lower in both RA subgroups compared with patients with AS (Figure 1). Expression of osteoblast differentiation gene Runx2 was decreased in patients with RA or OA and increased in patients with AS compared with controls (Figure 1), closely reflecting the pathological mechanisms of those forms of arthritis1,7. Runx2 expression was down-regulated in patients with RA or OA compared with patients with PsA or AS as well.
To confirm the significance of the analyzed molecules to distinguish between different forms of arthritis, we additionally analyzed diagnostic PBMC samples and found decreased expression of the following genes in patients with RA (n = 5) compared with patients with AS (n = 8): Runx2 (3.36, IQR 2.27–3.66 vs 5.47, IQR 4.40–6.01), BMP-6 (3.54, IQR 2.36–5.09 vs 6.36, IQR 4.37–10.01), and LIGHT (0.59, IQR 0.49–0.76 vs 0.82, IQR 0.57–3.05; p < 0.05, Mann-Whitney test).
Correlation of gene expression and disease variables
In addition to the comparison in gene expression between patients with arthritis and controls, we also correlated gene expression values with several clinical variables recorded at the time of venipuncture.
For patients with RA (including both RA subgroups, n = 49), we analyzed the association of gene expression values with patients’ clinical and demographic variables, including patient age, disease duration, applied therapy, disease activity [Larsen score, DAS28, erythrocyte sedimentation rate (ESR), C-reactive protein (CRP), patient and physician assessment of disease activity, patient assessment of pain and fatigue] and disability (Health Assessment Questionnaire and Medical Outcomes Study Short Form-36 SF36; Table 1). Negative correlation was found for the expression of Runx2 and Larsen score, physician assessment of disease activity, and DAS28, as well as for BMP-4 and physician assessment of disease activity, patient assessment of fatigue, and DAS28 (Table 3, Figure 2A). Nevertheless, correlations for BMP-4 expression and disease variables were borderline (p = 0.05, rank correlation; Table 3 and Figure 2A). Among TNF-superfamily molecules, negative correlation was found for FasL and physician assessment of disease activity and patient assessment of fatigue (Table 3). Patients with RA were further analyzed according to therapy with MTX vs other drugs (other DMARD, corticosteroids, and NSAID), revealing higher expression of BMP-2 (p = 0.003, Mann-Whitney test) and LIGHT (p = 0.03, Mann-Whitney test) in patients treated with MTX (Figure 2B).
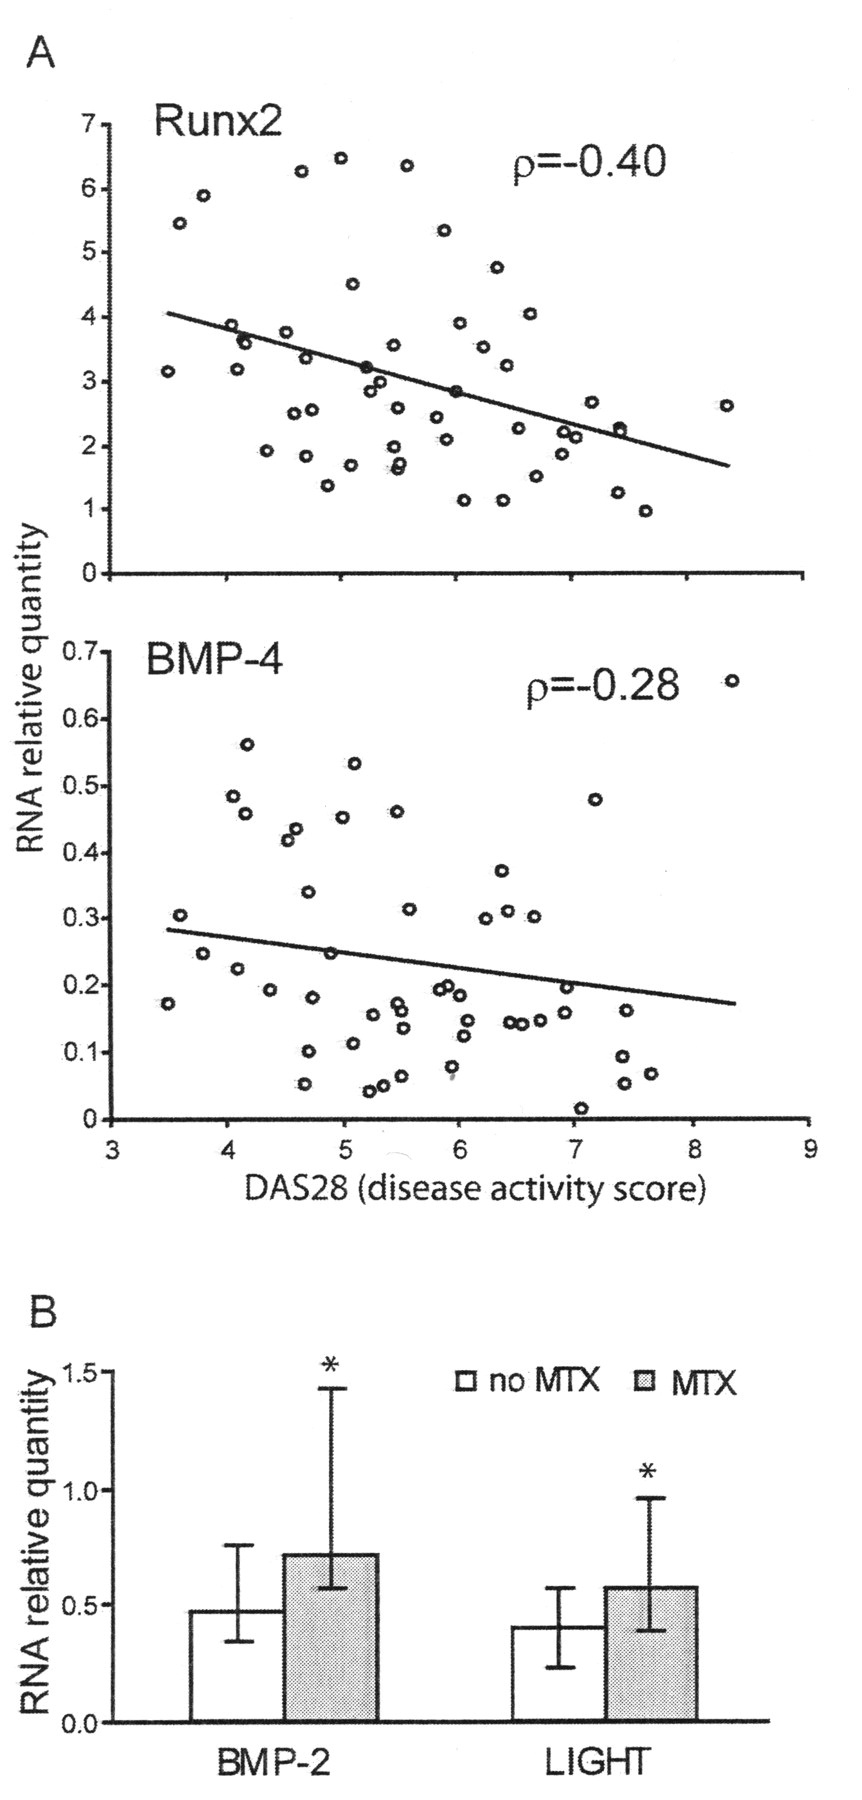
Analysis of gene expression values in relation to the clinical variables of disease in patients with RA. A. Correlation of gene expression for Runx2 and bone morphogenetic protein (BMP-4) with disease activity score (DAS28; Spearman’s coefficient ρ, p ≤ 0.05, rank correlation). B. Difference in gene expression for BMP-2 and the ligand for herpesvirus entry mediator (LIGHT) between patients treated with methotrexate (MTX) and other types of conventional therapy (no MTX). Values are presented as RNA relative quantity in qPCR (quantitative polymerase chain reaction; median with interquartile range). * Significant difference (p ≤ 0.05, Mann-Whitney test).
Correlation of gene expression with disease activity in patients with RA and PsA.
Patients with SpA, including AS and PsA groups, were also analyzed in relation to the appropriate disease variables (Table 1). Among tested clinical variables for patients with AS, higher expression of BMP-4 (p = 0.04, Mann-Whitney test), LIGHT (p = 0.05, Mann-Whitney test), and Runx2 (p = 0.04, Mann-Whitney test) was found in patients resistant to therapy with sulfasalazine and/or NSAID compared with patients clinically responding to those drugs (Figure 3A). Those patients with AS resistant to therapy compared to nonresistant patients with AS had significantly higher values of physician assessment of disease activity (66, IQR 53–89 vs 46, IQR 20–92, p = 0.03, Mann-Whitney test). Statistical analysis of clinical data in patients with PsA showed positive correlation between BMP-4 expression and BASDAI index, patient assessment of disease activity and pain as well as negative correlation between Runx2 expression and the enthesial pain (Table 3, Figure 3B).

Analysis of gene expression values in relation to the clinical variables of disease in patients with spondyloarthritis [ankylosing spondylitis (AS) or psoriatic arthritis (PsA)]. A. Difference in gene expression of bone morphogenetic protein (BMP-4), ligand for herpesvirus entry mediator (LIGHT), and Runx2 between patients with AS who are resistant to therapy and patients responding to conventional therapy. Values are presented as RNA relative quantity in qPCR (quantitative polymerase chain reaction; median with interquartile range). *Significant difference (p ≤ 0.05, Mann-Whitney test). B. Correlation of gene expression for BMP-4 with Bath Ankylosing Spondylitis Disease Activity Index (BASDAI) and Runx2 with enthesial pain in patients with PsA (Spearman’s coefficient ρ, p < 0.05, rank correlation).
In addition to the correlation with the disease variables, we also correlated the expression of selected bone-regulatory factors with osteoblast differentiation gene Runx2 for each type of arthritis. Significant positive correlation was found for BMP-2, BMP-4, FasL, and LIGHT with Runx2 expression in patients with RA or AS (Table 4).
Correlation of gene expression of BMP and TNF-superfamily molecules with Runx2. Gene expression values were correlated using rank correlation and Spearman’s coefficient ρ with its 95% confidence interval (CI). Significant correlation was found in patients with RA and AS.
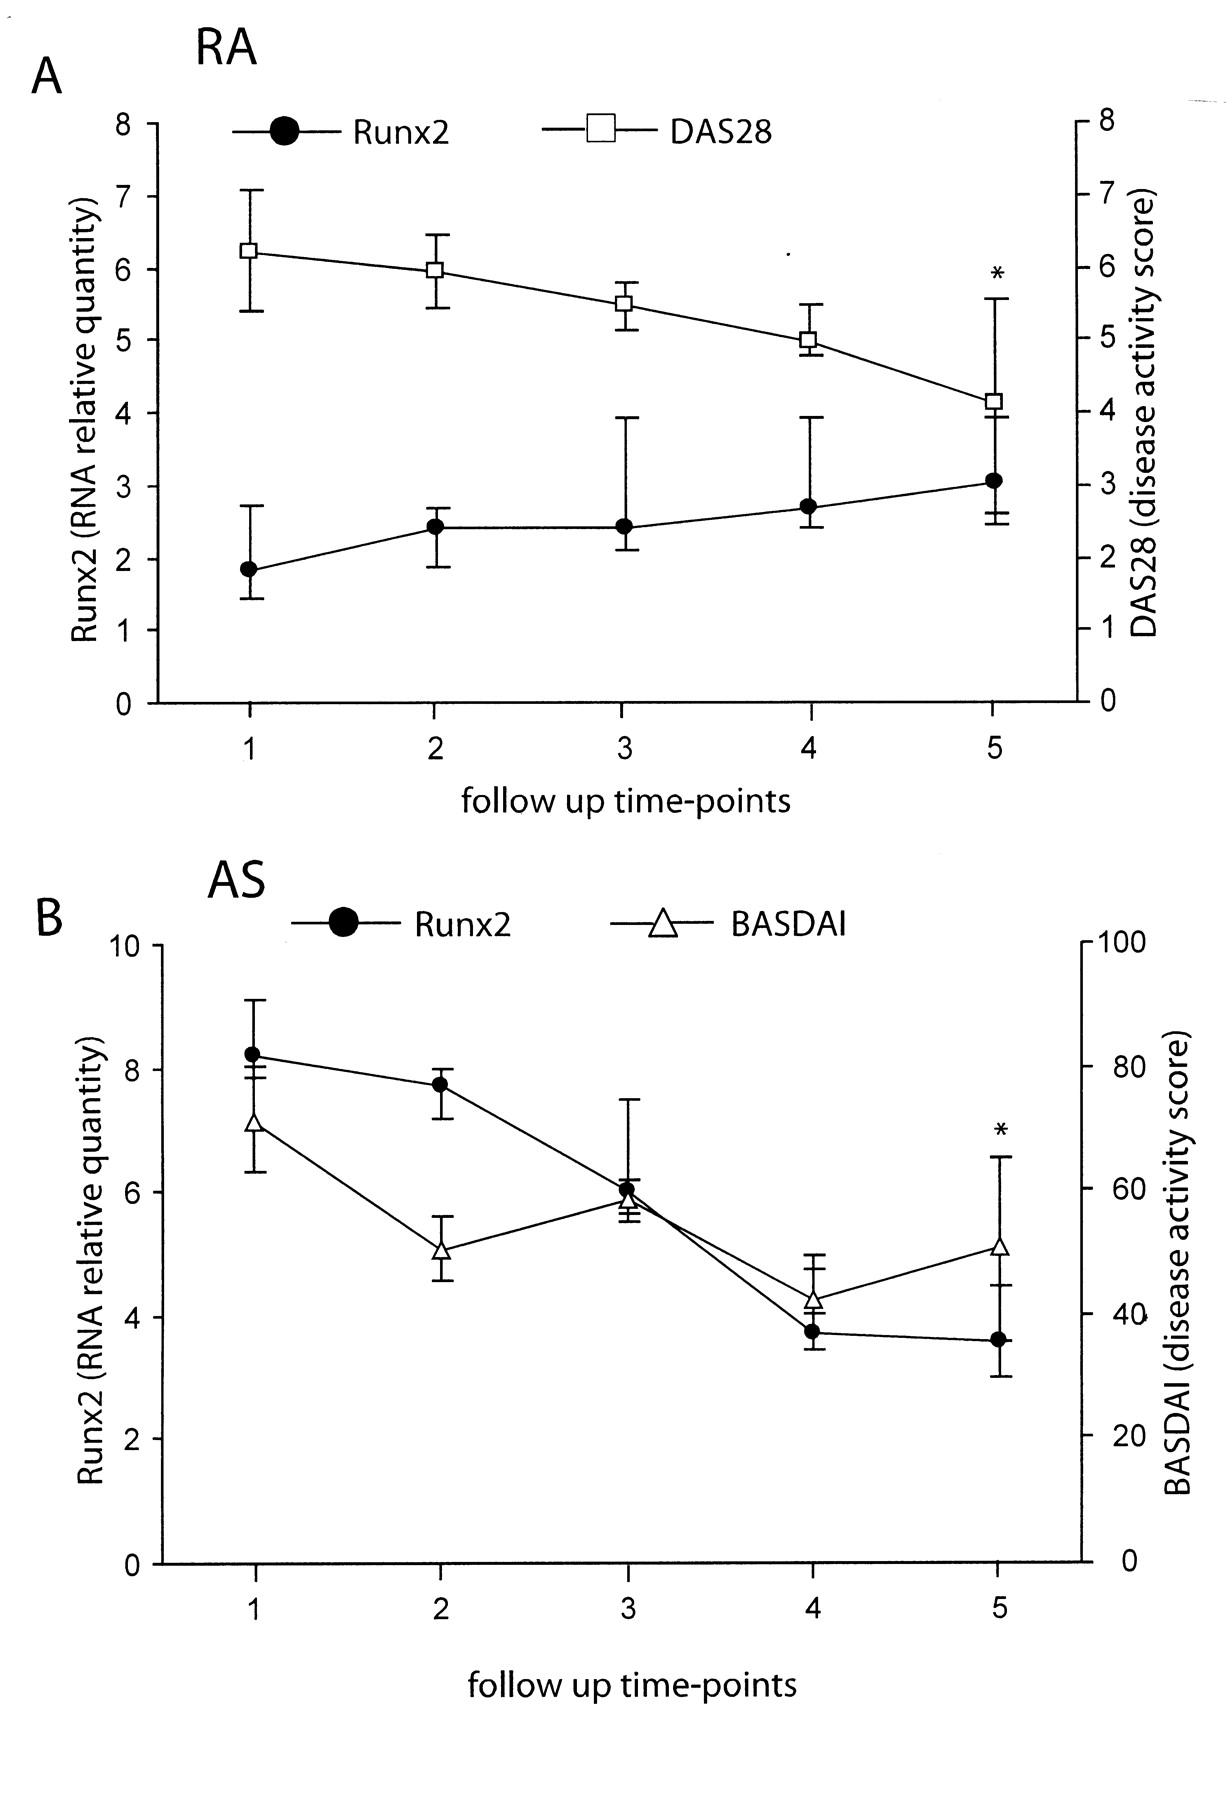
Finally, we analyzed the dynamics of Runx2 expression in patients with RA or AS who showed improvement in disease activity indices after the intensive conventional treatment. Expression of Runx2 gene gradually increased in patients with RA but decreased in patients with AS (Figure 4), with the statistically significant difference between the first and final followup time-point for Runx2 expression (p = 0.02, Wilcoxon test) and DAS28 (p < 0.01, Wilcoxon test) in RA and Runx2 expression (p = 0.02, Wilcoxon test) and BASDAI (p = 0.02, Wilcoxon test) in patients with AS. As with Runx2, we observed an increase in BMP-6, FasL, and LIGHT expression over the followup period in patients with RA (data not shown), with the statistically significant difference between the first and final followup time-point for BMP-6 (3.27, IQR 1.25–9.34 vs 5.59, IQR 1.05–28.44, p = 0.04, Wilcoxon test).

Followup of gene expression values for Runx2 and disease activity indices [disease activity score (DAS28) for rheumatoid arthritis (RA) and Bath Ankylosing Spondylitis (AS) Disease Activity Index (BASDAI) for AS] in selected patients with rheumatoid arthritis (RA; n = 10) or AS (n = 10) at five 3-month checkups. Values are presented as RNA relative quantity in qPCR (quantitative polymerase chain reaction) and activity score (median with interquartile range). *Significant difference between the first and final time-point (p ≤ 0.02, Wilcoxon test).
Discrimination between arthritic and control samples
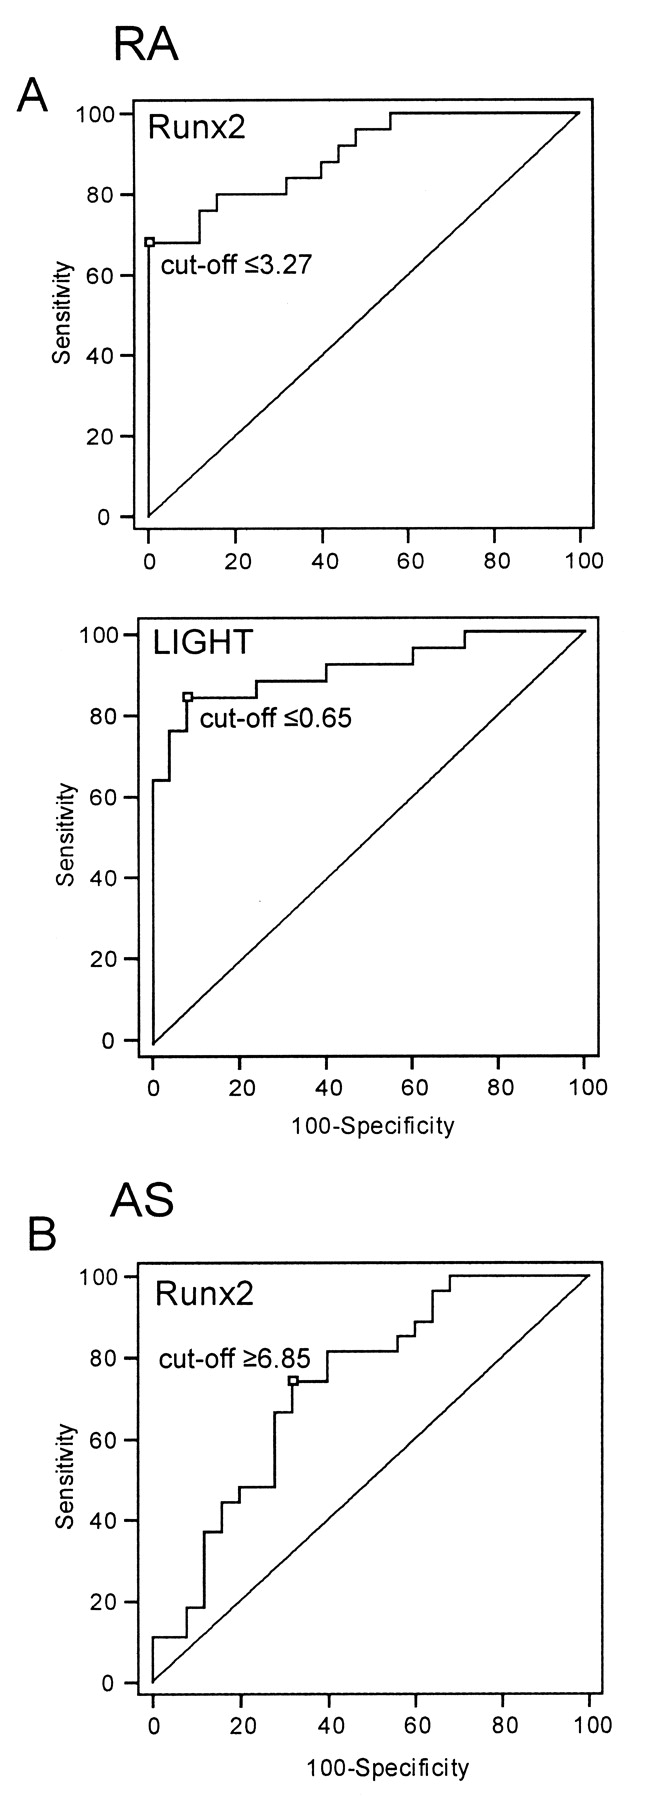
To evaluate the usefulness of gene expression values as the disease molecular markers, we performed ROC curve analysis and assessed the ability of the expression of several genes to discriminate between arthritic and control samples (Figure 5). For patients with RA, significant discrimination was found for BMP-4 (AUC = 0.82, 95% CI 0.69–0.91, p < 0.001), FasL (AUC = 0.79, 95% CI 0.65–0.89, p < 0.001), LIGHT (AUC = 0.91, 95% CI 0.80–0.97, p < 0.001), and Runx2 (AUC = 0.90, 95% CI 0.78–0.96, p < 0.001), while for patients with AS, significant discrimination was found only for Runx2 (AUC = 0.73, 95% CI 0.59–0.85, p < 0.001). Compared with control samples, the best diagnostic efficiency and highest sensitivity and specificity were found for LIGHT expression that was decreased in patients with RA (sensitivity 83% and specificity 92% at the cutoff point = 0.65) as well as for Runx2 expression that was decreased in patients with RA (sensitivity 68% and specificity 100% at the cutoff point = 3.27) and increased in patients with AS (sensitivity 74% and specificity 68% at the cutoff point = 6.85).

Discriminatory ability of gene expression values between samples of patients with rheumatoid arthritis (RA) and ankylosing spondylitis (AS), and control samples. A. Receiver-operating characteristic (ROC) curves for the expression of Runx2 and LIGHT in RA. B. ROC curves for the expression of Runx2 in AS. ROC curve analyses, p (area under curve = 0.5) < 0.001.
To further distinguish patients with RA from other arthritic patients, we performed ROC curve analysis for Runx2 expression between RA and other forms of arthritis and found significant discrimination (p < 0.001) between RA and both SpA groups (AS and PsA). If the cutoff point for the Runx2 expression level used to discriminate between RA and the control group (= 3.27) were applied to separate patients with RA from patients with AS or PsA, the values of sensitivity and specificity were comparable to the ones for the comparison between RA and controls (sensitivity 68% and specificity 100% for RA vs AS; sensitivity 68% and specificity 95% for RA vs PsA). In other words, patients with RA were characterized by lower expression of Runx2 and that characteristic enabled their discrimination from both patients with SpA and control subjects with high specificity.
DISCUSSION
We primarily aimed to identify new biomarkers of the forms of arthritis, disease activity, and therapeutic responsiveness, particularly in respect to the bone metabolism. We showed that patients with arthritis could be distinguished from healthy controls by the PBMC gene expression signature of several immunomodulatory and bone-inducing molecules of the BMP family and the TNF superfamily. Patients with RA or OA had lower expression of BMP-4 and BMP-6 and patients with RA also had decreased expression of FasL and LIGHT. Moreover, expression of osteoblast differentiation gene Runx2 was decreased in patients with RA or OA and increased in patients with AS, closely reflecting the pathological mechanisms of those forms of arthritis. Negative correlation was found for the expression of BMP-4, FasL, and Runx2 with the disease activity variables in patients with RA and Runx2 in patients with PsA, while positive correlation was found for BMP-4 in patients with PsA. ROC curve analysis confirmed the clinical importance of gene expression values in discriminating between arthritic and control samples and their potential usefulness as molecular markers, particularly lower LIGHT and Runx2 for RA and higher Runx2 for AS. The analysis of patients allowed us to assess gene expression values for selected molecules as markers of the disease stage and therapeutic responsiveness. To rule out the possible bias that gene expression was affected mostly by the applied treatment, we confirmed the differences in gene expression values in PBMC RA and AS diagnostic samples for BMP-6, LIGHT, and Runx2.
RA, an autoimmune-type arthritis accompanied by chronic inflammation and excessive bone and cartilage destruction4,9,10, was associated with lower expression of BMP, known as potent osteoinductive agents that promote new bone formation6,7. Also, the expression of BMP-4 showed inverse, although borderline, correlation with disease activity, possibly indicating downregulation of BMP-4 in more severe forms of disease. Similarly, OA, a form of degenerative arthritis associated with older age1,6, was paralleled by the decreased expression of BMP-4 and BMP-6. Nevertheless, this lower expression in aged patients may in part reflect slower bone formation described in senile osteoporosis7,37. In general, the observed differences in gene expression of bone-inducing factors were most similar in patients with RA or OA, both known to have insufficient bone and cartilage reparative processes1,7. In contrast to osteodestruction in RA, patients with SpA had enhanced new bone formation and heterotopic ossification in inflamed entheses1,5,7. Other authors have shown that patients with AS had increased serum levels of BMP-2 and BMP-7, which correlated with the BASDAI and Bath AS Radiological Index38. Although we did not observe increased gene expression of BMP in patients with AS compared with controls, we found higher expression of BMP-4 in patients with AS who were resistant to conventional therapy. Interestingly, expression of BMP-4 in PsA correlated positively with disease activity variables, identifying BMP-4 as a disease severity marker in both PsA and AS.
Several immunomodulatory and apoptosis-inducing molecules from the TNF superfamily are considered as catabolic regulators of arthritis, involved in synovial tissue proliferation and inflammatory bone destruction7,11,17,18. We observed downregulation of LIGHT expression in PBMC of patients with RA, in contrast to increased LIGHT levels found by several studies in RA17,18,39. Those studies made conclusions based on different experimental approaches used to analyze serum and synovial fluid17,39,40 or peripheral blood and synovial cell populations40,41. Reported observations were not always concordant but could be considered as complementary attempts to reveal the true biological role of LIGHT in arthritis. Possible discrepancy between gene expression in PBMC and protein serum level could be further explained by the fact that cells other than PBMC, such as granulocytes, may produce LIGHT42. Finally, despite lower gene expression in PBMC, the soluble form of LIGHT may be released in a joint, similarly as FasL by matrix-degrading enzymes43. Interestingly, we found that patients with RA treated with MTX had higher LIGHT expression. Although we did not investigate the mechanism of MTX action in RA, which is still not completely revealed44, new indicators of MTX responsiveness may be useful in identifying patients with RA who are more likely to benefit from that treatment. On the other hand, patients with AS resistant to conventional therapy had increased LIGHT expression, so they may benefit from treatment with biological therapeutics against LIGHT, still in clinical trials for the treatment of RA9.
FasL and TRAIL have been described as important apoptotic regulators of immune system homeostasis, but they also have a role in bone metabolism in physiological and pathological conditions10,45–47. Our study revealed decreased expression of FasL in PBMC of patients with RA compared with controls, as well as negative correlation of FasL expression with physician assessment of disease activity. Studies on the local tissues of the affected joints in patients with RA observed high expression of Fas and FasL15 and high synovial fluid levels of soluble FasL43. Nevertheless, immune and inflammatory cells of patients with RA are resistant to FasL-mediated apoptosis, thus contributing to synovial hyperplasia and invasiveness of synovial fibroblasts15,48. The systemic downregulation of FasL observed in our study may indicate a systemic defect in PBMC apoptosis.
Although PBMC may not be the most relevant cells to investigate joint disease, several forms of arthritis, including RA, AS, and PsA fulfill the criteria for the systemic immune-mediated inflammatory diseases49 and it is reasonable to assume that at least some disease processes would be reflected in blood leukocytes50. Moreover, analysis of PBMC has the advantage of being a rapid and minimally invasive way of obtaining cells from patients23. So far, systemic changes of different cytokines, mostly inflammatory mediators and apoptosis-inducing molecules, have been investigated in different forms of arthritis13,24,49–53. Nevertheless, immune cells may contribute to the disease pathophysiology not only by secreting inflammatory cytokines but also through production of bone-regulatory factors6,7,10,23–25. In addition, hematopoietic/osteoclast and mesenchymal/osteoblast progenitor cells may be found in the peripheral blood and serve as a source of bone-regulatory factors54,55. Finally, the changes in the expression of the bone-regulatory molecules could be similarly regulated in PBMC as in bone cells. For example, polymorphisms in Runx genes, which could affect their expression, have been associated with the autoimmune diseases, including RA56.
The potential usefulness of gene expression values of different cytokines and growth factors as molecular biomarkers in disease diagnosis and monitoring should be evaluated in relation to the markers of bone tissue metabolism13,23–25. We propose that Runx2, as the crucial osteoblast differentiation gene26,27, may be such an anabolic marker that positively correlates with the intensity of bone formation in arthritis. Importantly, Runx2 was downregulated in RA, known to be the most destructive type of arthritis, and upregulated in AS, a prototype of a remodeling arthritis1,7,11. Even more important, Runx2 expression negatively correlated with disease activity variables in RA, meaning that the more aggressive form of the disease with extensive tissue destruction, evident as increased DAS28 activity index and radiological Larsen score, was paralleled by lower Runx2 expression. Followup of Runx2 expression in selected patients with RA and AS showed trends toward control values upon therapeutic improvement. From the clinical point of view it is important to emphasize the high diagnostic efficiency of PBMC Runx2 expression for RA and AS, assessed by ROC curve profiles. ROC curve analysis is considered to be more biologically (clinically) relevant than simple group comparison (t-test or Mann-Whitney test)57. Moreover, once the cutoff point is defined by the ROC curve analysis at desirable sensitivity and specificity, additional samples could be classified in respect to this cutoff value, as we showed for the discrimination between RA and control as well as SpA groups. Many disease biomarkers exist for RA and other forms of arthritis, such as indicators of disease activity (CRP, ESR, DAS28), inflammation [interleukin 1 (IL-1), IL-6, IL-17, TNF-α], tissue degradation (matrix metalloprotease 3, C-telopeptide, C2C) and autoimmunity (rheumatoid factor, anti-citrullinated peptide antibodies, anti-Sa antibodies)13,24,49–53,58. They have been extensively studied as diagnostic markers and predictors of the therapeutic response or disease progression. In general, specificity of the known markers was above 95% while sensitivity varied, meaning that markers have not been detected in all patients51,52,58. Hence it has been proposed to use a combination of several markers to increase the sensitivity of diagnostic testing. The results of our study pointed to the Runx2 as a diagnostic marker in arthritis that could complement other already validated markers, specifically in respect to bone metabolism.
Chronic joint diseases have a complex pathophysiology which involves disturbed production of immunomodulatory and bone-regulatory factors. In the clinical context it would be beneficial to establish novel molecular biomarkers, which would indicate restoration of bone metabolism homeostasis and stimulation of tissue repair and not just inflammatory and destructive processes. We showed that profiles of BMP and Runx2 reflect intensity of bone formation in RA, OA, and AS, while lower FasL and LIGHT expression was associated with RA. Up to a 3-fold difference that was observed in PBMC gene expression between arthritic and control samples should be considered biologically and clinically relevant57. Combination of gene expression data with clinical scores and serum markers may provide more sensitive and predictive measures of arthritic disease activity. In addition, correlation between gene expression values and disease activity observed in our study may be helpful to assess effectiveness of novel therapeutic approaches aimed to modulate systemic expression of immunoregulatory and apoptotic factors2,13,14,16,49.
Acknowledgments
We thank Katerina Zrinski-Petrovic and Dr. Iva Topic for their help in collecting the blood samples.
Footnotes
-
Supported by grants from the Croatian Ministry of Science, Sport and Education (108-1080229-0142, 108-1080229-0140, TP-0210108-02).
- Accepted for publication September 23, 2009.


