The number needed to treat: a clinically useful nomogram in its proper context
BMJ 1996; 312 doi: https://doi.org/10.1136/bmj.312.7028.426 (Published 17 February 1996) Cite this as: BMJ 1996;312:426
- Gilles Chatellier, senior registrara,
- Eric Zapletal, computer scientista,
- David Lemaitre, computer scientista,
- Joel Menard, professor of internal medicineb,
- Patrice Degoulet, professor of medical informaticsa
- a Medical Informatics Department, Broussais Hospital, 75674 Paris CEDEX 14, France
- b Clinical Investigation Centre
- Correspondence to: Dr Chatellier.
- Accepted 23 November 1995
The number needed to treat is a meaningful way of expressing the benefit of an active treatment over a control. It can be used either for summarising the results of a therapeutic trial or for medical decision making about an individual patient, but its use at the bedside has been impeded by the need for time consuming calculations. A nomogram has therefore been devised that will greatly simplify the calculations. Since calculations are now easy, the number needed to treat can be used to assess the value of several interventions, although it does have its limitations. In particular it should not be used when it is not known whether the relative risk reduction associated with an intervention is constant for all levels of risk, or for periods of time longer than that studied in the original trials.
In most medical disciplines the gold standard for evaluating the benefit of an active treatment is the randomised controlled trial. Many obstacles exist, however, to the correct use of the results of clinical trials. Inadequate dissemination of results may, for example, explain the differences between doctors in awareness of key advances in myocardial infarction.1 Another influence on clinicians' views of the effectiveness of treatments may be the way in which the results of therapeutic trials are presented.2 3 4
An informative way of presenting results is the number needed to treat described by Laupacis et al.5 As recently underlined by Cook and Sackett, this very simple index is attractive since the meaning of a sentence such as “20 patients need to be treated to avoid 1 death over a five year period” is easily understood by both doctors and patients.6 Nevertheless, the authors underline that the calculations needed—that is, the multiplying of two numbers followed by the taking of the inverse of the result—are cumbersome and can lead to errors. We have therefore devised a nomogram for calculating the number needed to treat (see fig 1). This nomogram could be used alongside the one proposed by Sackett et al for applying Bayes's formula when assessing the informative value of diagnostic tests, either for interpreting the results of a therapeutic trial or for making therapeutic decisions in individual patients.7

Nomogram for calculating the number needed to be treated
The nomogram for summarising results of therapeutic trials
The number needed to treat in a therapeutic trial is simply the inverse of the absolute benefit of intervention—that is, the difference between the proportion of events in the control group (Pc) and the proportion of events in the intervention group (Pi): Number needed to treat=1/(Pc-Pi)
The absolute benefit of intervention is most relevant for addressing public health concerns about reductions in the incidence of disease attributable to treatment. However, when this additive model is used for representing the effect of treatment it means that the risk of disease in the intervention group is equal to the risk in the control group minus a quantity Q, which corresponds to the effect of treatment. If this model is to be used in another population with a different value of Pc, it is necessary to assume there is no relation between Pc and Q, which is often unproved. For example, if proportions of death are 10% and 20% in the treatment and control groups of a therapeutic trial, respectively, Q is equal to 20%-10%=10%. Clearly, if the proportion of deaths is only 2% in the control group, Q cannot be equal to 10%. Therefore, although the issue is much debated, a multiplicative model based on the use of the relative risk or of the odds ratio appears to be more appropriate when trying to measure the strength of an effect.8 These ratios summarise the treatment effect and are often assumed to be independent of the value of Pi and Pc. In fact, this assumption of a constant relative treatment effect should be carefully verified in every trial by stratifying patients according to their baseline risk. Meta-analysis can also be used for this purpose. Examples are given later in this paper.
The most widely used measure of effect in therapeutic trials is the relative risk: Relative risk=Pi/Pc
The odds ratio is another measure frequently used in multiplicative models. It can be obtained through the following formula: Odds ratio=Pi/(1-Pt)/Pc/(1-Pc)
The odds ratio approximates to the relative risk only when the probability of endpoints is lower than 10%. Above this threshold the odds ratio will overestimate the relative risk. It is easy to verify the “lower than 10%” rule, or to derive the relative risk from the odds ratio by using the following formula: Relative risk=Odds ratio/1+Pcx(odds ratio-1)
Finally, the relative risk reduction (frequently expressed as a percentage) is an appealing way of expressing the benefit of intervention, and it can be more easily remembered than the odds ratio or the relative risk. It is either already provided in papers or easily calculable by subtracting the relative risk from 1. For example, if the relative risk is 0.80 then the relative risk reduction is 1-0.80=0.20=20%.
The number needed to treat can finally be derived from Pc and the relative risk reduction by the simple formula: 1/Pcxrelative risk reduction
For example, if the relative risk reduction is 20% and the spontaneous risk of events 10% then the number needed to treat=1/(0.2 × 0.1)=50.
The nomogram allows the number needed to treat to be obtained directly without any calculation: a straight line should be drawn from the point corresponding to the proportion of events in the control group on the left hand scale to the point corresponding to the relative risk reduction measured in the trial on the central scale. The point of intercept of this line with the right hand scale gives the number needed to treat. By taking the upper and lower limits of the confidence interval of the relative risk reduction we can then obtain the upper and lower limits of the number needed to treat. This allows us to assess the precision of the result and the magnitude of effectiveness on the most optimistic and the most pessimistic hypotheses.
The potential advantages of using the nomogram are illustrated in table 1. The prescription of captopril in patients with left ventricular dysfunction 3 to 15 days after a myocardial infarction is associated with a considerable benefit at 42 months (only 23 patients need to be treated to avoid one death).9 Even the smallest number needed to treat obtained from the lower limit of the 95% confidence interval of the relative risk reduction is associated with a sizeable benefit: 122 patients to be treated to avoid one death. In comparison, 167 patients with mild to moderate hypertension (diastolic pressure # 110 mm Hg) need to be treated for five years to avoid one stroke.11 The benefit is lower when captopril is prescribed to all patients with suspected myocardial infarction within 24 hours of the onset of symptoms.10 Two hundred patients need to be treated to avoid one death, a result relevant only for the five weeks after myocardial infarction. The upper limit of the 95% confidence interval gives 1451 patients to be treated to avoid one death, a number suggesting almost no clinical benefit.
Using the nomogram in individual patients USING THE RESULTS OF AN INDIVIDUAL TRIAL
The number needed to treat summarises, by means of a single number, the results of a therapeutic trial in the same way that the arithmetic mean of a variable summarises all the measurements performed on each individual of the sample. Nevertheless, the arithmetic mean is only the most probable value of a population (provided the variable is normally distributed) and is not the value observed in every individual. Accordingly, the number needed to treat measured in a trial does not provide an estimate of the benefit for each patient treated. Cook and Sackett therefore propose that decisions should be made in individual patients by using the number needed to treat calculated from the relative risk reduction measured in the trial and the baseline risk in the absence of treatment estimated for this individual patient.6 This gives another reason to use the relative reduction instead of the absolute reduction.
As an example we will use this approach for the decision to perform coronary artery bypass graft surgery in patients with stable coronary heart disease. In their overview of the effects of this type of surgery on survival Yusuf et al also developed an eight variable risk score predicting mortality.12 The five year mortality was 6.3%, 13.9%, and 25.2% in the lowest, middle, and highest third of risk respectively. The nomogram makes it easy to calculate that if the same 39% reduction of the five year risk of mortality exists in each subgroup (see discussion of this point below) 40, 18, and 10 patients need to be operated on to avoid one death in the lowest, middle, and highest thirds of risk respectively.
COMBINING THE RESULTS OF SEVERAL TRIALS
Two or more interventions can be proposed for the same patient, particularly for cardiovascular disease. The best way for obtaining data on the joint effect of two or more drugs is the factorial design. In such trials it is possible to test whether the effects of two drugs are independent of each other. When this hypothesis holds true the relative risk observed with the combination of drugs is the product of the relative risks observed with each drug. Let us consider two drugs inducing relative risk reductions of 40% (relative risk 0.60) and 15% (relative risk 0.85) respectively. If the patient's risk is 5% the nomogram gives a number needed to treat of 50 for the first drug and 133 for the second. If we combine the two drugs the relative risk is 0.60x0.85=0.51, the relative risk reduction 49%, and the number needed to treat 41. The small additional benefit conferred by the combination of drugs over the prescription of only the most effective drug should therefore be weighted with the risks and side effects of the combination of the two drugs. A practical example was derived from the International Study of Infarct Survival (table 2).10 In the group receiving only captopril or only mononitrate the relative risks of death are 0.885 and 0.974 respectively. In the group receiving the combination of captopril and mononitrate the observed relative risk is 0.859, a value close to that obtained by multiplying the two individual relative risks. The numbers needed to treat estimated by using the two methods are therefore almost identical, 91 and 93 patients to be treated to avoid one death.
Individual and joint effects of converting enzyme inhibitor captopril and oral mononitrate after myocardial infarction in the International Study of Infarct Survival 410
If there is no trial that has used a factorial design then there will be no strong evidence about interactions between drugs and the type of interaction. When indirect evidence against interaction is also lacking using the method described above may either underestimate or overestimate the true benefit of a drug combination.
Some limitations of the method
The number needed to treat is an appealing measure which is always valid as a measure of treatment effect in a clinical trial. In bedside medical decision making a valid use of the number needed to treat requires two further assumptions: (a) the relative risk reduction is independent of the baseline risk; and (b) it is possible to extrapolate results to time points not considered in available clinical trials. Other problems are difficulties of estimating subjective probabilities and the value of numbers.
EXTRAPOLATING THE NUMBER NEEDED TO TREAT TO BASELINE RISKS NOT CONSIDERED IN TRIALS
When using the arithmetic mean to calculate the mean of a population one makes the assumption that the arithmetic mean is a valid estimate of the central location of a distribution, which is not always true. Adjusting the number needed to treat for the baseline risk of the patient implies, as underlined by Cook and Sackett,6 that the relative risk reduction is constant for all levels of disease severity. This assumption is true for hypertension treatment, where the overview of Collins et al clearly shows a typical 40% relative reduction in risk of stroke for all degrees of hypertension.11 This is not always the case: for example, in the International Study of Infarct Survival 410 the relative reduction was 17% in patients with a history of previous myocardial infarction versus only 3% for patients without such a history. In the overview of the effects of coronary artery bypass graft surgery in patients with stable coronary heart disease the relative risk reductions attributable to surgery, instead of being equal to 39% in each third of risk, were around 45% in both the middle and highest thirds of risk, whereas there was a 17% relative risk increase in the lowest third.12
EXTRAPOLATING THE NUMBER NEEDED TO TREAT TO TIME POINTS NOT CONSIDERED IN TRIALS
A second issue concerns the impact of time, which can affect the number needed to treat in two different ways. Firstly, in most clinical situations the longer the follow up the greater the number of events. Since for the same relative risk reduction of 50% the number needed to treat is lower if the proportion of events in the control group is 20% than if it is 2% the number needed to treat will be generally lower (meaning a greater individual benefit) in trials with long follow up than in trials with short follow up. This is exemplified above in the trials of angiotensin converting enzyme inhibition after myocardial infarction (table 1). Secondly, the relative risk reduction may or may not vary with time.
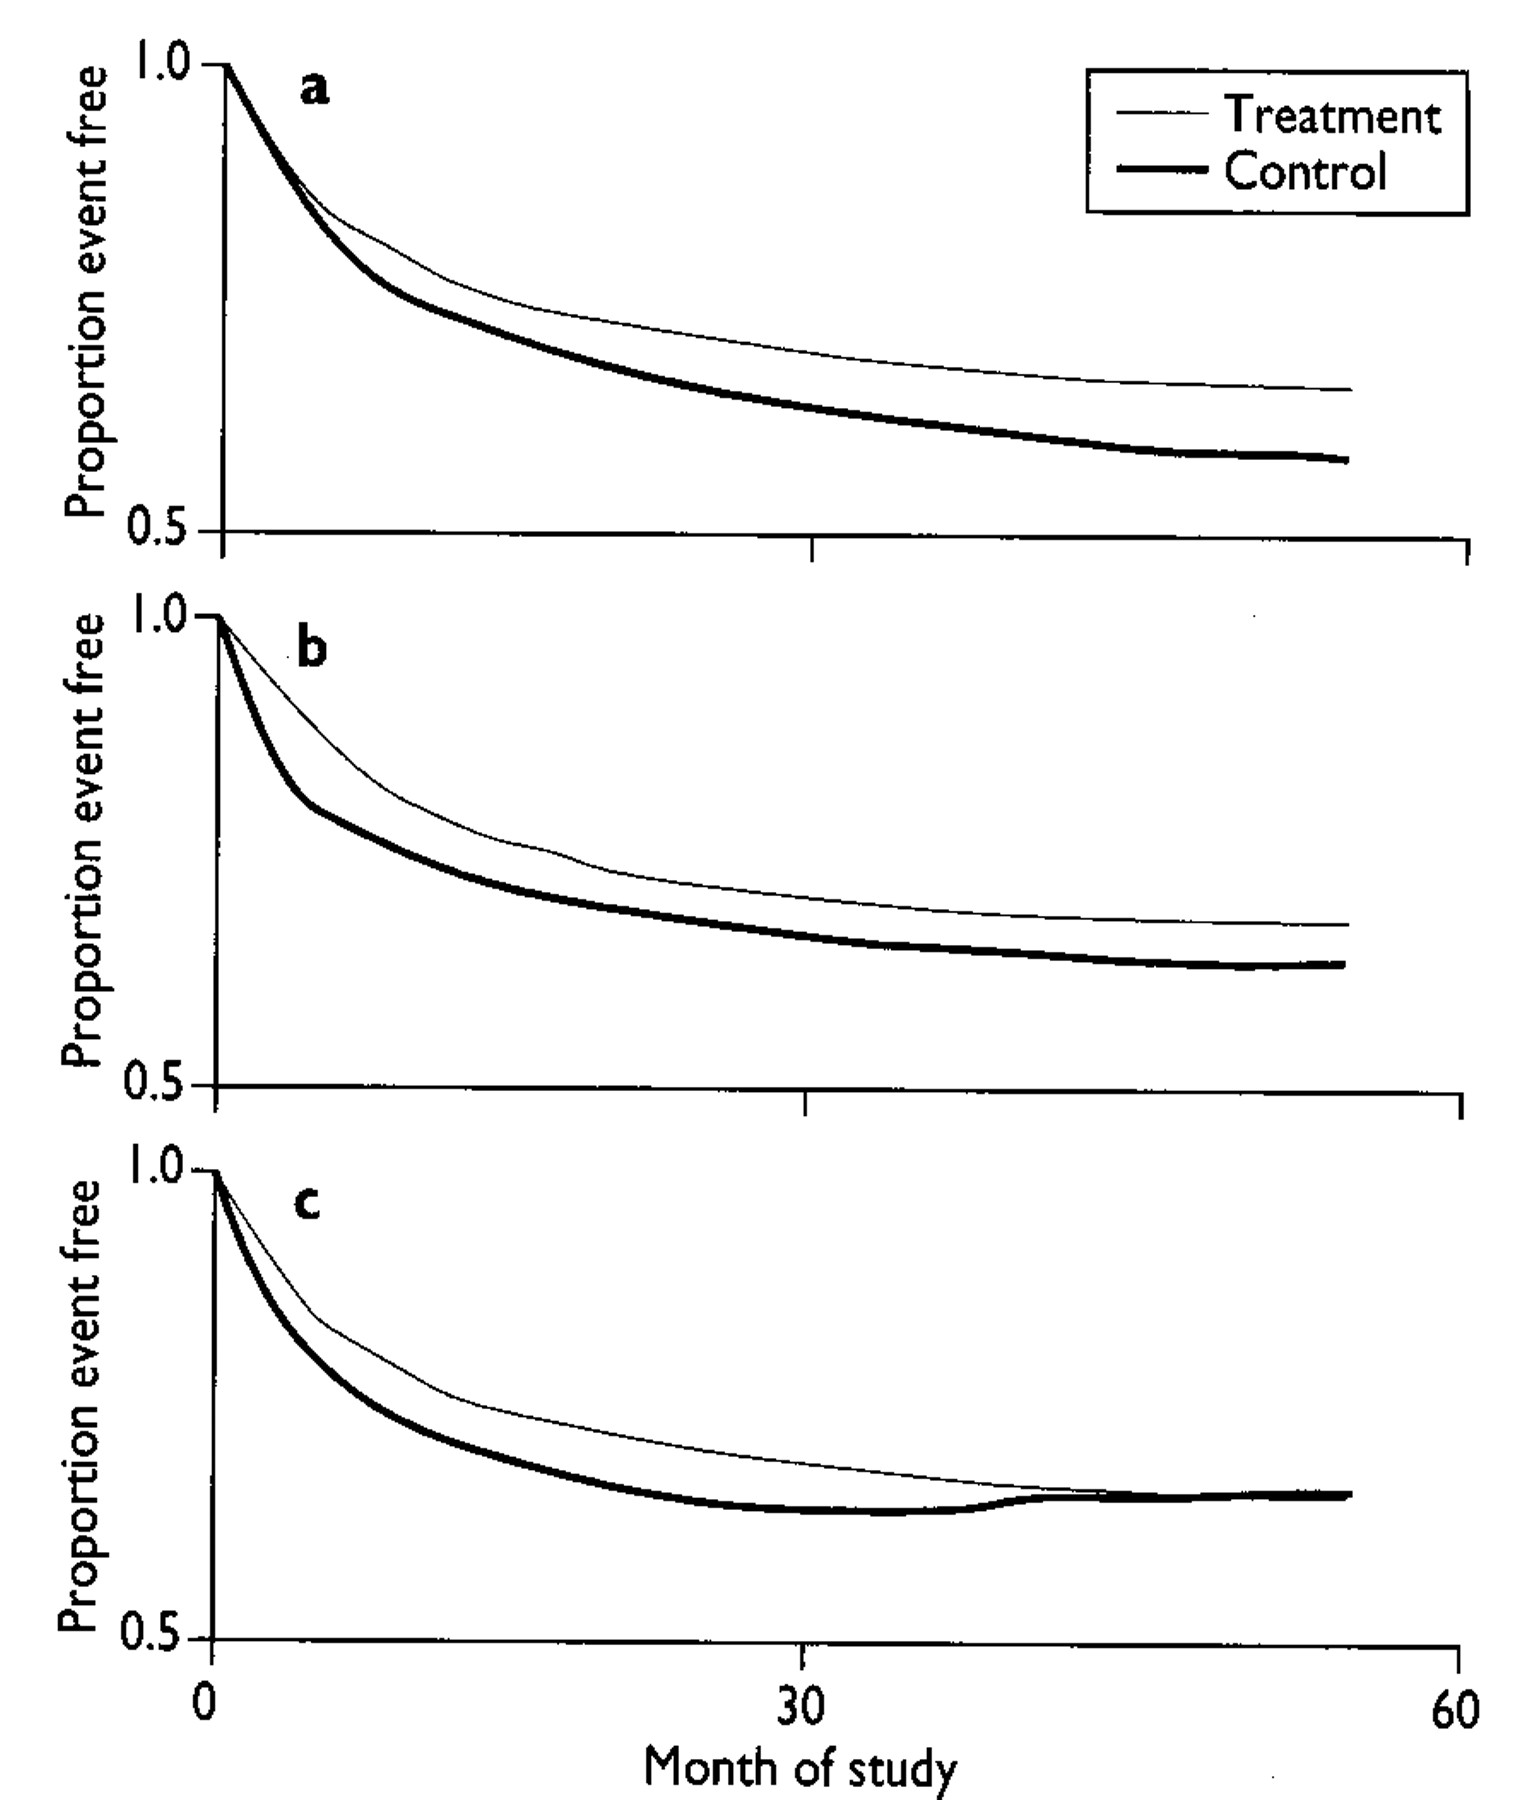
The three possibilities are shown in fig 2 for hypothetical trials lasting 30 months. In panel A treatment produces a constant relative risk reduction over time, continuing after the 30 month follow up. In panel C the relative risk reduction decreases after 30 months and is almost abolished at 60 months. In panel B treatment produces a constant relative risk reduction during the first months of treatment and no further benefit afterwards. This example shows that when data are available only at 30 months extrapolation for the following 30 months may be invalid. Further discussion of this point can be found in Laupacis et al.5 Extended follow up of randomised trials has provided examples of these various models.

Evolution of risk reduction with time. Three hypothetical examples: (a) constant reduction in relative risk; the distance between survival curves increases with time; (b) constant difference in risk; after the first few months of treatment the survival curves are the same distance apart; (c) a relative reduction in risk is observed until the 30th month, after which the relative risk increases until there is no benefit by month 60
In the secondary prevention of myocardial infarction, the three year beneficial effect of β blockers after infarction was maintained for at least six years with timolol,13 whereas, among the one year survivors of the β blocker in the Heart Attack Trial a continuing treatment benefit appeared to be restricted to patients at highest risk.14 In the Hypertension Detection and Follow up Program the benefit observed on completion of the five year trial extended up to 8.3 years, despite discontinuation of the formal stepped care programme in the intervention group, according to the pattern shown in fig 2a.15 Six years of follow up after the Lipid Research Clinics Coronary Primary Prevention Trial have not provided conclusive evidence of a benefit with cholestyramine treatment beyond that which was evident at the cessation of the seven year trial, this following the hypothesis illustrated in fig 2b.16 Finally, in the overview of the effect of coronary artery bypass graft surgery on survival the relative risk reduction reached a maximum of 39% at five years and decreased thereafter (32% at seven years, and 17% at 10 years), as in fig 2c.12
In trials where a large proportion of patients present at least one of the trial endpoints during a relatively short period of follow up—for example, in the SAVE trial one patient out of four died during the 42 week follow up9—there is no need to adjust the number needed to treat for a longer period. Conversely, in other trials, such as the International Study of Infarct Survival 4, the great majority (around 92.5%) of patients survived at five weeks. In cases such as this, although the number needed to treat is useful for estimating the short term benefit, it does not provide an answer about whether this benefit is maintained for a clinically meaningful period—for example, a year. In the International Study of Infarct Survival 4 data provided in the article shows that the 0.49% reduction in absolute risk reduction at five weeks was maintained after one year, when a 0.54% absolute risk reduction was observed. As to treatment of hypertension, it may not be valid to extrapolate from the available five year trials the benefit expected after 20 years, the clinically relevant time frame for patients with mild hypertension. Use of the five year number needed to treat may therefore unpredictably underestimate or overestimate the benefit of 20 years of treatment and may be misleading for decision making.
SUBJECTIVE PROBABILITIES AND THE VALUE OF NUMBERS
Bias in estimations of probabilities was described 20 years ago by Tversky and Kahneman.17 We have shown large variations between and within five hypertension specialists in their estimation of absolute cardiovascular risk.18 A study among primary care doctors in Canada has also shown that assessment of coronary risk was difficult for many doctors.19 Since, in both cases, doctors tended to overestimate the absolute risk, the use of an estimated absolute risk in decision making will result in a reduction in the number needed to treat and therefore an overestimation of the benefit of intervention. The use of computerised tools based on published equations of risk, such as the Framingham equation,20 will certainly be helpful for predicting risk more reliably, at least in cardiovascular medicine.
The impact of this quantification on decision making is the last issue. What is the clinical meaning of a number needed to treat of 100 for five years to avoid one clinical event for the average doctor? Some doctors will probably consider that this number represents an important health benefit, whereas others will consider the benefit as only moderate or even slight. This variability between doctors will reflect only the different opinions of doctors on risk or the value they ascribe to a given health state. At present most doctors probably overlook the fact that this number needed to treat of 100 is the summary measure of the preventive effect of antihypertensive treatment on coronary heart disease and stroke among patients with mild to moderate hypertension (diastolic blood pressure <110 mm Hg).11 The extent to which this number needed to treat value could influence medical decision making in mild to moderate hypertension is unknown and therefore requires testing in clinical practice, taking into account both the doctor's and the patient's points of view.
Conclusion
The use of the nomogram proposed in this paper makes it possible to calculate the number needed to treat at the patient's bedside for medical decision making. This decision making tool should be used only after an educational course in clinical epidemiology, covering especially elementary probabilities, prognostic studies, and randomised clinical trials. Caution about decisions based on “magic” numbers should remain part of good clinical sense.