Article Text

Abstract
Objectives In rheumatoid arthritis (RA), predictive biomarkers for subsequent radiographic progression (RP) could improve therapeutic choices for individual patients. We previously showed that the multibiomarker disease activity (MBDA) score in patients with newly diagnosed RA identified patients at risk for RP. We evaluated the MBDA score at multiple time-points as a predictor of RP during 2 years of follow-up.
Methods A subset of patients with RA (N=220) from the Swedish Farmacotherapy (SWEFOT) trial were analysed for MBDA score, disease activity score of 28 joints (DAS28), C reactive protein (CRP) and erythrocyte sedimentation rate (ESR) at baseline (BL), month 3 and year 1, for predicting RP based on modified Sharp/van der Heijde scores at BL, year 1 and year 2.
Results Patients with persistently low MBDA (<30) scores or those with a decrease from moderate (30–44) to low MBDA scores, did not develop RP during 2 years of follow-up. The highest risk for RP during 2 years of follow-up (42%) was observed among patients with persistently high (>44) MBDA scores. Among methotrexate non-responders with a high MBDA score at BL or month 3, significantly more of those who received triple therapy had RP at year 2 compared with those who received antitumour necrosis factor therapy.
Conclusions Measuring the MBDA score both before and during treatment in RA was useful for the assessment of individual patient risk for RP during 2 years of follow-up. In comparison with low CRP, ESR or DAS28, a low MBDA score at any time-point was associated with numerically lower proportions of RP.
Trial registration number NCT00764725.
- Rheumatoid Arthritis
- Anti-TNF
- Cytokines
- Disease Activity
- Patient perspective
This is an Open Access article distributed in accordance with the Creative Commons Attribution Non Commercial (CC BY-NC 4.0) license, which permits others to distribute, remix, adapt, build upon this work non-commercially, and license their derivative works on different terms, provided the original work is properly cited and the use is non-commercial. See: http://creativecommons.org/licenses/by-nc/4.0/
Statistics from Altmetric.com
Key messages
A low multibiomarker disease activity (MBDA) score at baseline was associated with a very low risk of radiographic progression (RP).
Achievement of a low MBDA score at later time-points also was associated with low risk of RP.
Among patients with low C reactive protein or erythrocyte sedimentation rate, the majority had high/moderate MBDA score and a substantial proportion had RP.
Combination of MBDA score at multiple time-points may help choose optimal therapy, since patients with a high MBDA score might be better protected from RP while using biologics compared with patients having a low/moderate MBDA score.
Introduction
In rheumatoid arthritis (RA), early therapeutic intervention increases the chances of achieving better clinical and radiographic outcomes.1 ,2 However, radiographic progression (RP) is not always associated with clinically severe signs and symptoms.3–7 Early identification of patients at a risk for RP would be beneficial for the optimal therapy choice leading to prevention of RP.
There are several factors reported to be independent predictors of RP, including biomarkers (anticyclic citrullinated peptide (anti-CCP) autoantibody status, erythrocyte sedimentation rate (ESR), C reactive protein (CRP)), radiographic destruction at baseline (BL) (bone erosions and joint space narrowing) and smoking status.8–19
The multibiomarker disease activity (MBDA) score (Vectra DA) is an RA disease activity measure based on serum concentrations of 12 protein biomarkers.20 ,21 In established RA, limited RP has been reported among patients in remission according to the MBDA score, while those with high (>44) MBDA score, despite being in remission according to the disease activity score of 28 joints based on CRP (DAS28-CRP) or to the American College of Rheumatology and European League Against Rheumatism (ACR/EULAR) criteria, were found to be at significantly higher risk.22
Using data from the Swedish Farmacotherapy (SWEFOT) clinical trial23 ,24 of early RA (eRA), we have previously shown that BL MBDA score, taken before the initiation of disease-modifying anti-rheumatic drugs (DMARDs), could define patients who were at very low versus higher risk of rapid RP (RRP) during 1 year of follow-up.25 However, patients for whom screening with biomarkers is of interest are not necessarily DMARD naïve.
Thus, we further studied the MBDA score, CRP, ESR and DAS28 at multiple time-points in a subset of patients from the SWEFOT trial, to evaluate these measures as predictors of high versus low risk of subsequent RRP in RA patients.
Methods
Study population
Overall, 487 patients with eRA were recruited to the SWEFOT trial,23 with age ≥18 years, symptom duration <1 year and DAS28>3.2. After 3 months of methotrexate (MTX) monotherapy, responders (DAS28≤3.2) continued the treatment and non-responders (DAS28>3.2) were randomly assigned to receive (1) non-biological (MTX+sulfasalazine (SSZ)+hydroxychloroquine (HCQ)) DMARD triple therapy (TT) or (2) in addition to MTX, biological (antitumour necrosis factor (anti-TNF): infliximab) therapy. The analyses of RP from BL to year 1 and to year 2 for this study were performed on a subset of 220 patients with eRA for whom the MBDA scores, CRP, ESR and DAS28 were available at BL. Of the 220 patients, data on these four disease activity measures at month 3 and year 1 were available for 205 and 133 patients, respectively. From the study subset, 76 patients responded to MTX monotherapy and 144 were randomised to the TT (n=73) or anti-TNF (n=71) treatment arms. The SWEFOT study was approved by regional ethics committees of all participating units.
Disease outcomes
The categorisation of disease activity at BL, month 3 and year 1 by DAS28 and CRP, was as follows: for DAS28, EULAR cut-offs were used—low ≤3.2, moderate >3.2–5.1 and high >5.126; for CRP, low ≤10 mg/L, moderate >10–30 mg/L and high >30 mg/L.27 As there is no defined threshold value for categorisation of disease activity according to ESR, tertiles at BL were used: low ≤26 mm/h, moderate 27–45 mm/h and high >45 mm/h. The modified Sharp/van der Heijde scores (SHSs)28 from radiographs of hands and feet were evaluated (by 2 certified assessors) at BL, year 1 and year 2, and patients with an increase of the SHS at any subsequent time-point by >5 (ΔSHS>5) were considered as RRP.29 ,30 In addition, we analysed a threshold defined for clinically relevant RP (CRRP, (ΔSHS>3)).31
Biomarker measurement and the MBDA score
The biomarkers were measured by Crescendo Bioscience (South San Francisco, California, USA). The following 12 biomarkers were used for calculation of the MBDA score: vascular cell adhesion molecule 1, epidermal growth factor, vascular endothelial growth factor, interleukin 6, TNF receptor 1, matrix metalloproteinases 1 and 3, cartilage glycoprotein 39 (YKL-40), leptin, resistin, serum amyloid A and CRP. The biomarkers were measured by electrochemiluminescence-based multiplex immunoassay on the Meso Scale Discovery Multi-Array platform.32 The MBDA score was calculated using the Vectra DA algorithm; it has a scale from 1 (lowest disease activity) to 100 (highest disease activity). Threshold values of MBDA score grouped patients into three disease activity categories: low <30, moderate 30–44 and high >44.21 ,22
Statistical analyses
BL characteristics and demographic data were analysed by descriptive statistics. The comparison of these data between RRP and non-progressors was carried out using the Mann-Whitney U test. Proportions of patients with RRP between the TT and anti-TNF therapy arms (among MTX non-responders) as well as among patients with low, moderate or high disease activity categories, were evaluated by χ2 test or, in case of limited sample size, Fisher's Exact test. The ΔSHS values among patients with low, moderate or high disease activity categories according to MBDA score, CRP and DAS28, were compared using the Kruskal-Wallis test. The data were analysed using IBM SPSS Statistics software V.22.
Results
BL characteristics
BL characteristics and demographic data of the 220 patient subset with available samples for biomarker analyses were similar to the whole SWEFOT cohort (table 1). As expected from our previous studies on predictors of RP, ESR, CRP and MBDA, scores were significantly higher at BL in patients with RRP at year 1 versus those without RRP, whereas no significant difference was detected regarding DAS28 (table 1 and figure 1), Clinical Disease Activity Index (CDAI) or Simplified Disease Activity Index (SDAI) (figure 1). Similar results were found based on 2-year radiographic data (results not shown).
Baseline characteristics and demographic data of patients from the SWEFOT trial

Distribution of disease activity measures among radiographic progressors (Δ Sharp/van der Heijde score (ΔSHS) >5) and non-progressors (ΔSHS≤5). Multibiomarker disease activity (MBDA) score, C reactive protein (CRP), erythrocyte sedimentation rate (ESR), disease activity score of 28 joints (DAS28), Clinical Disease Activity Index (CDAI) and Simplified Disease Activity Index (SDAI) at baseline among patients with radiographic progression (grey boxes) and without progression (white boxes) from baseline to year 1.
Relationship of disease activity categories at different time-points with frequency of RRP
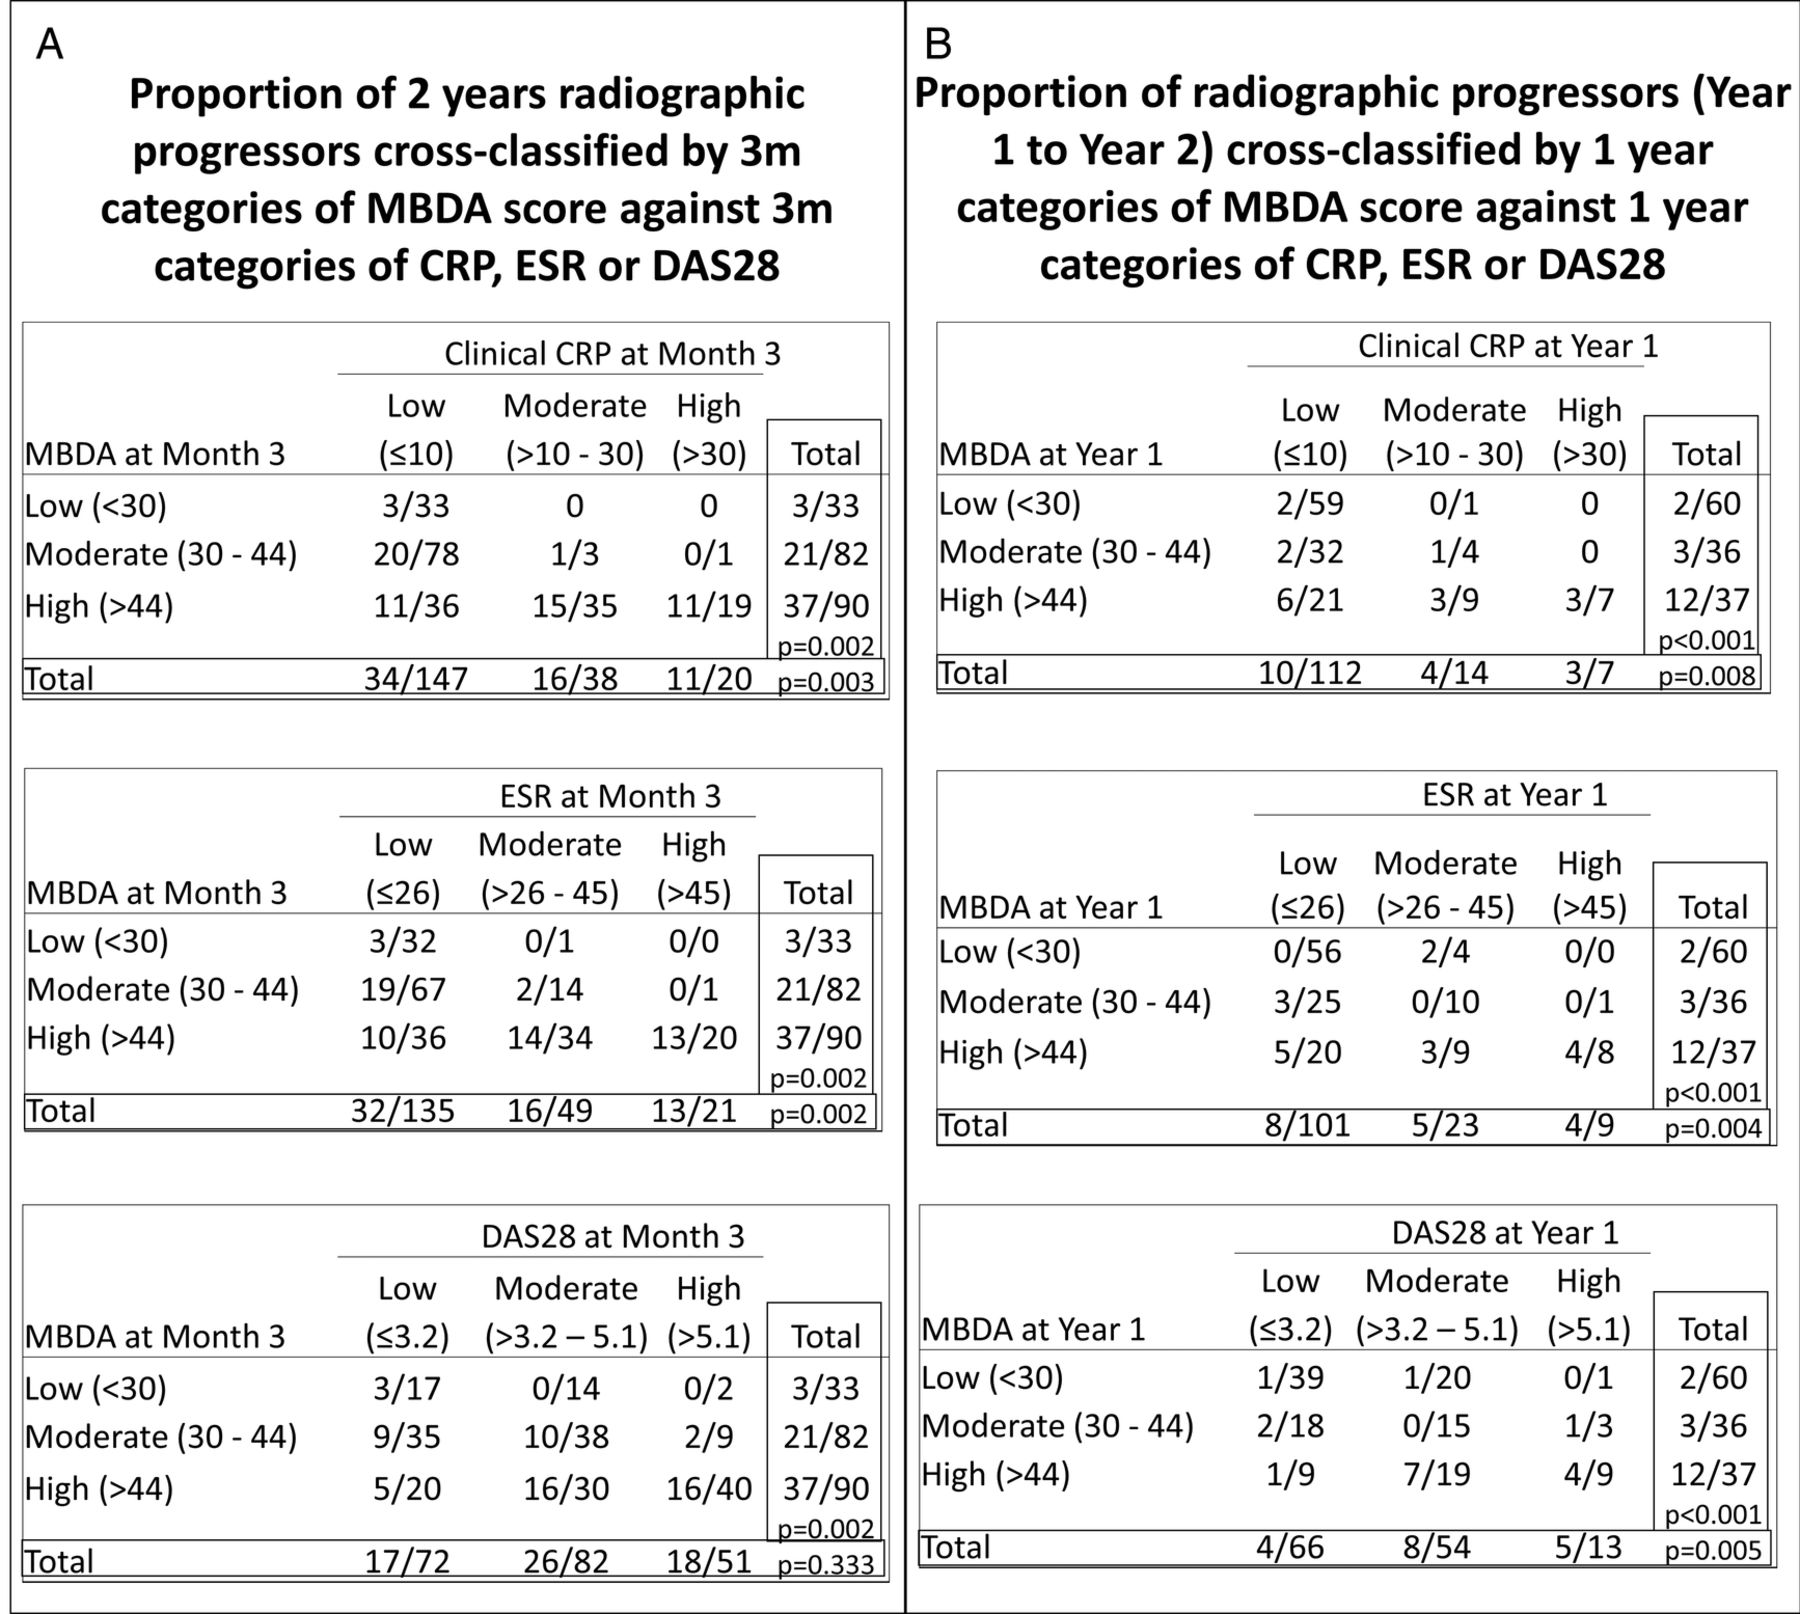
Proportions of patients with subsequent RRP (BL–year 2 and year 1–2) were compared among patients with low, moderate or high disease activity according to the MBDA score, CRP, ESR or DAS28 at month 3 or year 1 (figure 2). The categorisation of patients by MBDA score, CRP and ESR at month 3 showed a significant difference in the proportion of RRP during 2-year follow-up (p=0.002, p=0.003 and p=0.002, respectively; figure 2A); while the same was not true for DAS28 (p=0.333). When assessed at year 1, all these four disease activity markers showed a significantly different proportion of patients with subsequent RRP from year 1 to 2 (p<0.001, p=0.008, p=0.004 and p=0.005, respectively; figure 2B). The categories of the MBDA score showed similar results when ΔSHS>3 cut-off was used for CRRP (see online supplementary figure S1).
Supplementary figures

Proportion of radiographic progressors in patients with rheumatoid arthritis during 2 years follow-up according to categories of multibiomarker disease activity (MBDA) score, C reactive protein (CRP), erythrocyte sedimentation rate (ESR) and disease activity score of 28 joints (DAS28) at multiple time-points. The proportion of radiographic progression (RP) (A) at year 2 in patients whose 3-month categories of MBDA score are cross classified versus CRP, ESR and DAS28 at month 3 and (B) from year 1 to 2 in patients whose 1 year categories of MBDA score are cross-classified versus categories of CRP, ESR or DAS28 at year 1.
Relationship of disease activity categories at different time-points with the change of the SHS
The changes of SHS (ΔSHS) from BL to year 1 and to year 2 as well as from year 1 to 2 were compared among RA patients with low, moderate or high disease activity categories according to the MBDA score, CRP and DAS28 at month 3 (n=205) and year 1 (n=133; table 2). The ΔSHS was significantly different across low/moderate/high categories of the MBDA score and CRP, at month 3 and year 1, while no significant differences were observed across DAS28 categories (table 2A). When compared among patients within the same categories of different disease activity measures (table 2B), patients with a low MBDA score at month 3 had significantly lower ΔSHS from BL to year 1 (0.5) than those with low CRP (2.2) or low DAS28 (2.2), p=0.029, and significantly lower ΔSHS from BL to year 2 (1.5, 3.5 and 3.7, respectively; p=0.037). Patients with moderate MBDA score at year 1 had significantly lower ΔSHS (1.0) during the subsequent year than those with moderate CRP (4.1) or DAS28 (1.9); p=0.048. In the rest of the cases, patients with low or moderate MBDA scores at any time-point had numerically but not significantly lower ΔSHS during the subsequent year compared with those having a low or moderate CRP or DAS28. And there was no significant difference in ΔSHS among patients with a high MBDA score, CRP or DAS28 (table 2B).
The change of SHS from BL to year 1 and year 2, and from year 1 to 2, among early RA patients with low, moderate and high MBDA scores, CRP and DAS28 at multiple time-points
Relation of the MBDA score categories with those of CRP and ESR, and RRP
When stratified across low/moderate/high categories of CRP, ESR or DAS28, all 33 patients with a low MBDA scores at month 3 also had low CRP and low ESR, with the exception of 1 patient with moderate ESR, and 17 had low DAS28 (figure 2A). Of these 33 patients, only 3 had RRP at year 2. In contrast, among patients with low CRP, ESR or DAS28 at month 3, the majority had a moderate/high MBDA score, and 23%, 24% and 24% of them, respectively, had RRP at year 2 (figure 2A). Of these patients with RRP, only three had a low MBDA score. Among patients with a low MBDA score at year 1 (n=60), 1 had moderate CRP, 4 had moderate ESR, 20 had moderate DAS28 and 1 had high DAS28 (figure 2B). Of these 60 patients, only 2 (3%) had RRP from year 1 to 2. In contrast, among patients with low CRP (n=112), low ESR (n=101) or low DAS28 (n=66) at year 1, almost half had a moderate/high MBDA score, and of the 9% with low CRP who had RRP from year 1 to 2, only two patients had a low MBDA score.
Association of conversions in MBDA score categories with subsequent RRP
Changes of disease activity category (low, moderate and high) according to the MBDA scores, CRP or ESR from BL to month 3 or to year 1 were analysed versus subsequent RRP (from BL to year 1 and from year 1 to 2, respectively; figure 3). For the five patients with low MBDA scores at BL, all five remained low at month 3 (figure 3A, left bar graph), as did the four with available MBDA data at year 1 (figure 3B, left bar graph) and none had RRP over the 2 years of follow-up. Likewise, none of the patients who shifted from a moderate MBDA score at BL to low at month 3 or year 1 progressed radiographically during the subsequent 1 year. In contrast, the highest proportion of patients with RRP was detected among patients with a high MBDA score at BL that remained high at month 3 or year 1. Those whose MBDA scores had decreased from a high to a low category at month 3 or to low/moderate at year 1, had significantly lower frequencies of RRP compared with those whose MBDA score remained at high levels at these time-points (figure 3A, B left bar graphs). In contrast, patients who remained with low disease activity at month 3 or year 1 according to CRP or ESR (figure 3A, B, middle and right bar graphs, respectively) still had some occurrence of RRP. Patients who shifted to low CRP or ESR at month 3 or year 1 had a 3–24% risk of RRP over the subsequent year, with the exception of patients decreasing from moderate to low levels of ESR at year 1, who did not develop RRP over the following year (figure 3B, right bar graph).

Association of radiographic progression with change in disease activity categories according to the MBDA score, CRP and ESR. Change in categories according to MBDA score, CRP or ESR (A) from BL to month 3 and radiographic progression from BL to year 1, and (B) from BL to year 1 and radiographic progression from year 1 to 2. BL, baseline; CRP, C reactive protein; ESR, erythrocyte sedimentation rate; MBDA, multibiomarker disease activity; SHS, Sharp/van der Heijde score.
In general, when using the MBDA score at a single time-point, comparison of low/moderate versus high MBDA scores at BL and at year 1 was the most optimal grouping for discrimination of patients at low versus higher risk of RRP during the following year, whereas at month 3, low versus moderate/high grouping was better (figure 3 and online supplementary table S1). When using the MBDA score at single time points for evaluation of RRP from BL to year 1, both BL and month 3 data were equally predictive for a subset at low risk of RRP. Of patients with a low/moderate MBDA score at BL (n=33) or with a low MBDA score at month 3 (n=33), only one had RRP at year 1. Combination of these two time-points, however, allowed an increase in sample size of the patients at low risk of RRP, that is, of the patients with a low/moderate MBDA score at BL, or those whose MBDA score dropped from high at BL to low at month 3 (n=50), only two patients had RRP at year 1 (figure 3 and online supplementary table S1).
Supplementary table S1
Predictive capacity of the MBDA score at multiple time-points
Evaluation of the MBDA score at BL, month 3 and year 1 for prediction of RRP during the second year of follow-up (from year 1 to 2) revealed that the latest time-point (year 1) was the best single time-point for identification of a subgroup of patients at very low risk of RRP (5 of 87). Combination of two time-points (change of the MBDA categories from BL to year 1 or from month 3 to year 1) slightly increased the sample size of patients who were identified to be at very low risk of RRP. Thus, 5 of 90 patients who had a low/moderate MBDA score at BL or whose score decreased from high at BL to low/moderate at year 1, had RRP. When considering change of the MBDA categories from month 3 to year 1: 5 of 88 patients who had a low MBDA score at month 3 or decreased MBDA score from high (month 3) to low/moderate (year 1) or had persistent moderate MBDA score, had RRP from year 1 to 2 (see online supplementary table S1).
RRP in triple versus anti-TNF therapy arms and its relation to MBDA score categories
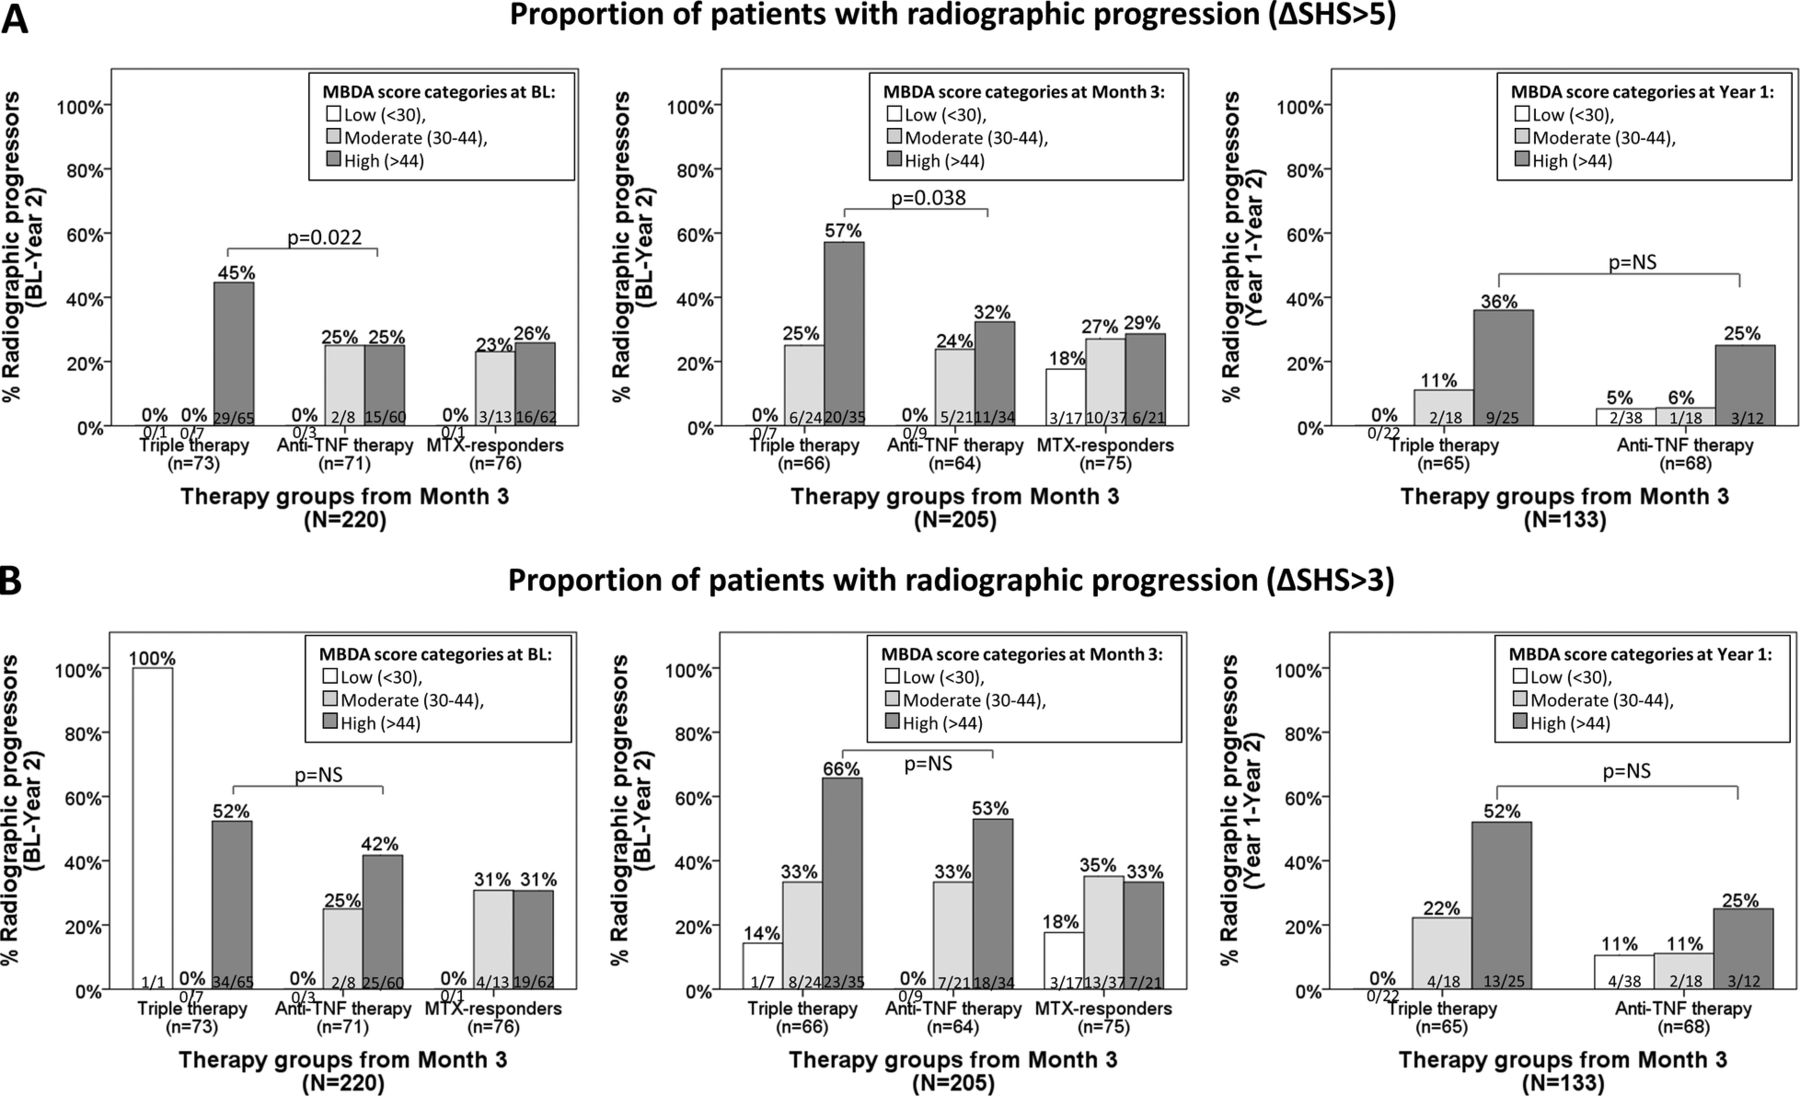
In this study, patients categorised by the MBDA score (low, moderate and high) within each therapy group (TT, anti-TNF and MTX monotherapy) had similar patterns for the risk of RRP during the subsequent year as if looked at all therapy groups together (results not shown). As has been previously reported, in the SWEFOT trial, there was a significantly higher proportion of RRP over 2 years in the TT group as compared with patients randomised to anti-TNF therapy.24 When considering MBDA score categories, the proportions of RRP in the MTX non-responders with a low/moderate MBDA score were not statistically significantly different between the TT and anti-TNF treatment arms (figure 4). However, patients with a high MBDA score at BL or month 3 had a significantly higher proportion of RRP at year 2 in the TT group, compared with the anti-TNF group (45% vs 25%, p=0.022 and 57% vs 32%, p=0.038, respectively; figure 4A, left and middle bar graphs); and a numerically but not significantly greater rate of RRP (year 1 to 2) in the triple versus anti-TNF-treated patients with a high MBDA score at year 1 (figure 4A, right bar graph). When using ΔSHS>3 as a definition of CRRP, patients with high MBDA scores in the TT arm had a numerically higher proportion of CRRP than those in the anti-TNF therapy group (figure 4B). Patients with high CRP at BL, month 3 or year 1 did not differ significantly in proportion or RRP among TT and anti-TNF treated groups (see online supplementary figure S2).
Radiographic progression among three therapy groups (triple therapy group, anti-TNF treatment group and MTX responders) stratified by MBDA categories at multiple time-points. Proportion of patients with radiographic progression defined as (A) ΔSHS>5 and (B) ΔSHS>3. Left and middle bar graphs represent proportion of patients with 2-year radiographic progression stratified by the MBDA score at BL and month 3, respectively. Right bar graph shows radiographic progression from year 1 to 2 among patients stratified by the MBDA score at year 1. BL, baseline; MBDA, multibiomarker disease activity; MTX, methotrexate; NS, not significant; SHS, Sharp/van der Heijde score; TNF, tumour necrosis factor.
Discussion
In this study on patients with eRA who participated in the SWEFOT trial, the 12 serum biomarker-based MBDA score at BL, month 3 and year 1 was associated with the status of subsequent RRP. Thus, having a low MBDA score at BL, or a score reducing to a low level at any of the later time-points, was associated with a lower risk of subsequent RRP. Furthermore, numerically smaller proportions of RRP were observed among patients with a low MBDA score as compared with patients having low CRP, ESR or DAS28 at the respective time-points.
These results confirm and extend previously published findings. During development of the MBDA score, Centola et al20 demonstrated (using data from multiple clinical cohorts) that scores based on those candidate biomarkers at BL and year 1 were correlated with subsequent change of SHS from BL to year 1 and from year 1 to 2, respectively. Van der Helm-van Mil et al22 showed that patients in remission according to the MBDA score had a lower risk of RP, compared with those in remission according to DAS28-CRP or ACR/EULAR criteria. In contrast, Bakker et al could not show BL MBDA scores to significantly predict RP over 2 years in the CAMERA trial. After inclusion of rheumatoid factor and BL erosions in multivariate logistic regression analyses, however, the MBDA score at BL, but not DAS28-CRP, achieved borderline significance.33
In our previous study based on this trial, we demonstrated the independent predictive ability of the MBDA score at BL for subsequent 1 year RRP.25 This result posed a question concerning the role of the MBDA score in patients with RA whose disease (and MBDA score) is already affected by treatment. Therefore, here we assessed the predictive capacity of the MBDA score at month 3 (patients on MTX monotherapy) for RRP from BL to year 1 and year 2, as well as at year 1 (MTX non-responders, either on TT or on anti-TNF therapy) as a predictor of RRP from year 1 to 2. DAS28, CRP and ESR were studied in parallel with the MBDA scores from each time-point.
In this study, the proportions of patients with RRP during the first and second years as well as the 1-year change in SHS from BL differed significantly between patients with low/moderate/high MBDA scores or CRP at month 3 or year 1 (figure 2 and table 2). In order to elucidate the objectiveness of cut-off values for MBDA and CRP, the data on ΔSHS was plotted against MBDA score, CRP and ESR values (see online supplementary figure S3). This figure illustrates that some patients at very low CRP levels at all three time-points have RRP over 2 years, while those with low or moderate MBDA scores have lower proportions with RRP. Moreover, when comparing proportions of patients with RRP from BL to year 2 between the TT and anti-TNF treated groups, patients with a high MBDA score at BL or month 3 differed significantly, whereas those with high CRP did not (see figure 4 and online supplementary figures S2). Although using ΔSHS>3 cut-off did not show a significantly, but only numerically, higher proportion of patients with CRRP in the TT versus anti-TNF therapy group (figure 4B), when comparing all patients together, the associations of the MBDA score categories with risk of CRRP were similar to the association with RRP using ΔSHS>5 cut-off (see online supplementary figure S1).
When comparing predictive ability of the MBDA score at different time-points, we noticed that combination of the MBDA score from BL and month 3 substantially improved the identification of patients at a low risk of RRP during the first year of the trial compared with single time-points, due mainly to an increase in the sample size from n=33 to n=50 (see online supplementary table S1). As for the prediction of RRP during the second year of follow-up, year 1 was the best single time-point for identification of patients at a low risk of RRP. Simultaneous use of the MBDA score from BL and year 1 or from month 3 and year 1 slightly increased the sample size of this subset of patients (from 87, to 90 and 88, respectively).
One of the limitations of this study is that it was based on one cohort, which was not a full representation of the RA population. However, the SWEFOT trial was designed to include a real-life eRA population. Another limitation was that the MTX responder population lacked MBDA data at year 1, which limited our ability to perform analyses. Next, because of the lack of information about cut-offs for CRP and ESR categories, we had to use non-validated cut-offs for CRP and tertiles for ESR in order to define low/moderate/high levels of disease activity. This makes the comparison with MBDA score more limited and the health-economic point of view cannot be evaluated. Changes in the treatment of patients from different arms could affect the radiographic outcome. And, finally, in comparison of proportion of RRP within each therapy group, some subgroups of patients are very small. Considering this and the fact of multiple testing, the results of significant difference of proportions of RRP between TT and anti-TNF therapy groups need to be confirmed.
The strength of this study is the availability of data from multiple time-points, which provides a more comprehensive evaluation of the MBDA score as a predictor of RRP at the onset of the disease, and also during subsequent treatment. The presence of two different treatment strategies (TT vs biological therapy) gave an opportunity to study the MBDA score as a predictor of patients at high versus low risk of RRP for each therapy group, separately. As the data from figure 4 suggest, patients with a high MBDA score would benefit more from anti-TNF therapy than from TT, decreasing their risk of RRP by year 2. Thus, while MBDA testing is more expensive than using conventional biomarkers (ie, ESR and CRP), targeting (biological) therapies to the patients with the greatest potential benefit may generate considerable savings.
In conclusion, a low MBDA score at BL, month 3 and year 1, was predictive for low risk of RRP over 2 years of follow-up in patients with eRA, and this association was stronger (non-significantly) than associations with low DAS28, CRP or ESR. The MBDA score may thereby become a useful tool for guiding treatment choices in individual patients.
Acknowledgments
The SWEFOT trial investigating groups, besides the authors: Johan Bratt, Stockholm, Ingemar Petersson, Lund, Pierre Geborek, Lund, Sofia Ernestam, Stockholm; Kristina Albertsson, Stockholm; Lars Cöster, Linköping; Eva Waltbrand, Borås; Agneta Zickert, Stockholm; Jan Theander, Kristianstad; Åke Thörner, Eskilstuna; Helena Hellström, Falun; Annika Teleman, Halmstad; Christina Dackhammar, Mölndal; Finn Akre, Örebro; Lotta Ljung, Umeå; Rolf Oding, Västerås; Katerina Chatzidionysiou, Stockholm; Margareta Wörnert, Stockholm. The authors would like to thank all participating patients and the study nurses, co-investigators and colleagues who made this trial possible.
References
Footnotes
Contributors KH had the lead role in management of the merged clinical and serological data sets, and analyses thereof, discussions with collaborators, drafting of the manuscript and its final approval for submission. SS contributed to the management of the merged clinical and serological data sets, and had a lead role in the statistical analyses thereof, participated in discussions with collaborators, critically reviewed the manuscript and approved the final version for submission. RJB, SEC, EHS and DC were responsible for the serum analyses and MBDA score generation, and quality control of these data, and contributed to analysis and interpretations of these data; they all reviewed the manuscript critically and approved the final version for submission. KF was mainly responsible for radiological scoring in the SWEFOT trial, and supported the statistical analyses and interpretations thereof, participated in discussions with collaborators, critically reviewed the manuscript and approved the final version for submission. JKW was a key investigator and steering committee member in the SWEFOT trial. He supported the statistical analyses and interpretations of the data in the current study, participated in discussions with collaborators, critically reviewed the manuscript and approved the final version for submission. RFvV was the investigator in the SWEFOT trial as well as being the investigator responsible for the study reported here. He designed the study and organised the collaboration with Crescendo Biosciences Inc, for the patients’ serum analyses and the MBDA score generation. He also discussed and reviewed the manuscript critically and gave his final approval for submission of the manuscript.
Funding The work was supported in part by a grant from the Swedish Rheumatism Association. Some of the authors were supported by clinical research funds from Stockholm County (ALF funds). An annual unrestricted grant was provided by Schering-Plough Sweden, which was used to support a study coordinator and a medical monitor for the original clinical trial. The analyses of the MBDA score were performed by Crescendo Bioscience Inc (South San Francisco, California, USA), at no cost to the investigators.
Competing interests RFvV received a grant/research support from: AbbVie, BMS, GSK, Pfizer, Roche, UCB; was a consultant for: AbbVie, Biotest, BMS, Crescendo Bioscience, GSK, Janssen, Lilly, Merck, Pfizer, Roche, UCB, Vertex. JKW reported participating in an advisory board for Novartis, unrelated to the present work. RJB is a shareholder of: Myriad Genetics Inc, and an employee of: Crescendo Bioscience, a wholly owned subsidiary of Myriad Genetics, Inc. EHS is a shareholder of: Myriad Genetics Inc, and an employee of: Crescendo Bioscience, a wholly owned subsidiary of Myriad Genetics, Inc. DC is a consultant for: Crescendo Bioscience, a wholly owned subsidiary of Myriad Genetics, Inc. SEC is an independent contractor to Crescendo Bioscience Inc, and is paid on an hourly basis. KH, SS and KF: None declared.
Ethics approval The study was approved by the regional ethics committees of all participating units.
Provenance and peer review Not commissioned; externally peer reviewed.
Data sharing statement No additional data are available.