Article Text

Abstract
Objectives To explore the impact of socioeconomic factors on physical and mental health of patients with musculoskeletal disorders (MSKDs) and compare it across patients with other disorders.
Methods A representative sample of the Dutch population (n=8904) completed a survey on sociodemographics, physician-diagnosed (co-) morbidities, and physical (physical component summary, PCS) and mental (mental component summary, MCS) subscales of SF-12 (outcome variables). Regression models were computed first in the total group of patients with MSKDs, with education, age, gender, origin and place of residence as independent variables, and, second, in individuals expected to have paid work, adding a variable on social status. Models were repeated for five other subgroups of chronic disorders (cardiovascular (CVD), diabetes, cancer, mental and respiratory) and for healthy individuals.
Results MSKDs confirmed by a physician were reported by 1766 (20%) participants (mean age 59 years, 38% male), 547 (6%) respondents reported to have diabetes, 1855 (21%) CVD, 270 (3%) cancer, 526 (6%) mental disorders, 679 (8%) respiratory disorders and 4525 (51%) did not report any disease. In patients with MSKDs, (primary school vs university education (−5.3 (PCS) and −3.3 (MCS)) and having a state subsidy vs paid work (−5.3 (PCS) and −4.7 (MCS)) were consistently associated with worse physical and mental health. Gender was only relevant for PCS (female vs male −2.1). Comparable differences in health by education and social status were observed in the other diseases, except for cancer.
Conclusions Education and social status in MSKD have the same strong and independent association with health as in other chronic diseases. These health gradients are unfair and partly avoidable, and require consorted attention and action in and outside healthcare.
- Epidemiology
- Outcomes research
- Multidisciplinary team-care
This is an Open Access article distributed in accordance with the Creative Commons Attribution Non Commercial (CC BY-NC 4.0) license, which permits others to distribute, remix, adapt, build upon this work non-commercially, and license their derivative works on different terms, provided the original work is properly cited and the use is non-commercial. See: http://creativecommons.org/licenses/by-nc/4.0/
Statistics from Altmetric.com
Key messages
What is already known on this subject?
In spite of constant efforts, gaps in health by socioeconomic status (SES) have become wider in the last decades. Lower SES has been associated with worse disease outcomes, higher prevalence of morbidities and increased mortality.
What does this study add?
To our knowledge, no studies have been performed comparing the physical as well as mental health gradients according to SES across the major chronic diseases. While we found that absolute health levels between diseases are different, the relative decrease in health caused by socioeconomic factors were similar in all chronic diseases and even present in the persons without a (diagnosed) disease. Overall, the decreases in physical health in persons with lower SES were more important than the decrease in mental health.
How might this impact on clinical practice?
Low educated persons may have less skills and capacities to manage health and often have less opportunities to cope with the consequences of their disease. Healthcare systems should become more aware that individuals with low SES may benefit from preventive and clinical care, tailored to specific needs of these persons, independently of the type of the disease they suffer from.
Introduction
In spite of constant efforts, gaps in health by socioeconomic status (SES) have become wider in the last decades. Lower SES has been associated with a higher prevalence of morbidities and increased mortality.1–3 SES of an individual can be defined by factors brought together in the PROGRESS-plus framework, which is an acronym for Place of residence, Race/ethnicity, Occupation, Gender, Religion, Education, Socioeconomic status (SES), Social capital, and Plus for age, disability, sexual orientation and literacy.4–6 In general, the individual has little or no direct control over these factors. It is therefore important that healthcare, social and economic policies, and political processes, monitor differences in health across these factors, decide whether they are unfair and avoidable (in which case we call them inequities), and develop action plans to reduce inequities in health.7
While socioeconomic determinants have an influence on the occurrence of disease,8 they can also play a role in the level of impact a disease has on quality of life. In musculoskeletal disorders (MSKDs), several studies documented the role of individual socioeconomic factors such as age, education, social class, race/ethnicity and place of residence in health inequities.9–16 However, insight into the magnitude of the influence of socioeconomic determinants on the health of patients with chronic diseases remains incomplete. First, to the best of our knowledge, there have been no studies exploring which of the PROGRESS factors have the strongest independent influence on health. Further, there are no studies comparing the role of PROGRESS factors in health-related quality of life (HRQoL) across patients with different diseases. Together with MSKDs, cardiovascular disease (CVD), respiratory disease, mental disease cancer and diabetes were mentioned among the diseases causing the highest burden in the most recent Burden of Disease report.17 It is important to understand whether socioeconomic gradients in health in patients with MSKD are different or similar in persons with other chronic non-communicable diseases. Disadvantage may occur in relation to physical or mental health, or both. Better understanding of the role of socioeconomic factors in the health of patients with various chronic diseases could support and complement health policies.
The objective of this study was (1) to explore which PROGRESS factors are most importantly associated with physical and mental health in patients with MSKDs and (2) to compare the relative contribution of these factors to health across several chronic diseases (diabetes, CVD, cancer, respiratory and mental disorders) and in healthy individuals.
Methods
Subjects
Data from The National Monitor on Musculoskeletal System 2010, a survey conducted by the Dutch organisation for applied scientific research for the Dutch Arthritis Foundation in early March to 15 April 2010, were used. The aim of this survey was to assess the prevalence of rheumatic diseases in the non-institutionalised adult Dutch population (>18 years old).18 Information on sociodemographics and lifestyle, and also on major chronic diseases, was collected. A questionnaire was sent to a random sample of 40 000 households selected from an address registry of a subsidiary undertaking of the Dutch Thomas Nationwide Transport post.18 ,19 In each household, a participant 18 years or older who was the first to have their next birthday was asked to complete the questionnaire. The study was approved by a Medical Ethical Committee of the Leiden University Medical Center.
Assessments
Participants completed a questionnaire including several (proxies for) PROGRESS factors:
Age and gender;
SES (education classified into 5 educational groups, ordered by the level of diploma, and further specified by the number of years of formal education from the age of 4 onwards): person at most achieved lowest school diploma (0–8 years of formal education), lower professional school (14 years), middle or professional secondary school (16 years), secondary school diploma (13–14 years), and university diploma (16–18 years)). Parents are obliged to enrol their children in formal education at the age of 4.
Social status (paid work, (early) retired, unemployed, work disabled, receiving state living allowance (subsidy), housewife/man, or student));
Ethnic origin (respondent's place of birth and parents’ place of birth): The standard definition of Statistics Netherlands was further used to define ethnic origin,20 that is, a person was considered to be of non-Western origin if at least one of the parents was born in a non-Western country or continent, that is, Turkey, Africa, Latin America or Asia;
Place of residence (4-digit postal code).
HRQoL was measured with the validated Dutch version of 12-Item Short-Form Health Survey (SF-12) consisting of two parts, the physical (physical component summary, PCS: overall perceived health, pain, limitations in amount, type and quality of accomplishment of daily activities due to physical health) and mental component score (mental component summary, MCS: limitations in daily activities due to emotional state, overall energy level and presence of depressed feelings), each ranging from 0 (worst health) to 100 (best health).21 ,22
The presence of 13 common chronic diseases was enquired, with three answer categories possible (no; yes, but not ascertained by a physician; yes, and ascertained by a physician). Only disorders ascertained by a physician were considered for the analyses (some diagnoses were lumped together according to the organ system involved, resulting in nine groups of chronic disorders): MSKD (severe or persistent symptoms in/or around joints (pain, stiffness and/or swelling)), CVD (hypertension, cerebral haemorrhage, myocardial infarction, other heart diseases and peripheral vascular disease), diabetes, cancer, mental disorder, respiratory disorder, skin disorder, gastrointestinal disorder and migraine or recurring headaches. A variable reflecting simple count of morbidities was computed (MSKD, CVD, diabetes, cancer, mental disorder, respiratory disorder, skin disorders and others, one point per morbidity group). The disease in question was always excluded from the index (eg, diabetes was not included in comorbidities count when analysing the subgroup of patients with diabetes). Those participants who did not report any chronic disease ascertained by a physician were referred to as the ‘healthy population’. Finally, height (cm), weight (kg) and smoking status (never smoked, smoked before, current smoker) were collected. Body mass index (BMI) was computed and classified into underweight (BMI<18.5), normal weight (18.5≥BMI<25.0), overweight (25.0<BMI≤30.0) and obese (BMI>30.0).23 ,24
Statistical analyses
Linear regression analyses were performed to explore the association between socioeconomic variables, and physical and mental health. For each analysis, first univariable linear regressions were computed with all available PROGRESS factors as independent variables (education (university education as a reference group), age, gender and origin (western origin as a reference group)) to explore the association between these factors, and PCS and MCS, respectively. Second, those factors that were significant (p<0.1) in the univariable model were entered into a multivariable model using forward procedure, taking into account BMI, smoking status and number of comorbidities (always excluding the disease by which the group was defined) as potential confounders. Finally, a multilevel linear regression model with random intercepts for place of residence (4-digit postal code) was computed. Likelihood ratio test was used to decide whether a multilevel model showed a better fit (p<0.05). Interactions between education and/or social status with age, gender and comorbidities were tested, and, if relevant (p value <0.01), stratified analyses were performed.
Univariable and multivariable linear regression models were built separately to model each of the outcomes. All models were developed in patients with MSKD and then repeated in patients with diabetes, cancer, CVD, respiratory and mental disorders, as well as in the healthy population, so that the regression coefficients for PROGRESS factors could be compared across diseases. Two main models were computed in the group of respondents with each of the diseases. In the first series of models (model I) all participants were included. In the second series of models (model II), only participants younger than 65 years of age who were expected to have paid work (ie, having paid work, unemployed or receiving state living allowance) were included, in order to focus on the additional effect of social status on health.
Missing cases on PCS, MCS, age, gender, education, social status, ethnic origin, smoking status and BMI, were imputed using multiple imputation (imputed datasets n=20). Chained imputations using a regression-based method were used.25–27 Predictive mean matching was used for a continuous variable, logistic regression for binary variables and multinomial logistic regression for a nominal variable. Main analyses were performed on imputed data. To assess robustness of findings, we performed a number of sensitivity analyses. First, we repeated the statistical models on complete cases (no missing in any variable) only. Second, missing values on PCS and MCS were manually imputed in two extreme scenarios, being replaced by 9th and 1st deciles of the distribution, respectively. Results were compared. Stata Statistical Software V.12 was used.28
Results
The questionnaire was completed and returned by 22.4% of the contacted persons, resulting in a total sample of 8904 study subjects. The characteristics of the sample were generally similar to characteristics of the Dutch population in terms of age, gender, education levels, ethnic origin and BMI (see online supplementary appendix 1). The proportion of missing values did not exceed 6% across the different variables, except missing values in the outcome variables PCS and MCS, where it varied between 8% and 20%. MSKD confirmed by a physician was reported by 1766 (20%) participants (mean age 59 years, 38% male). A total of 1855 (21%) respondents had physician-diagnosed CVD, 547 (6%) diabetes, 526 (6%) mental disorders, 270 (3%) were indicated to have cancer, 679 (8%) respiratory disorder and 4525 (51%) reported no disease (healthy population) (table 1).
Demographic and health characteristics of participants according to disease
PROGRESS factors in relation to physical and mental health in patients with MSKDs
Overall, in patients with MSKD, lower education, lower social status and older age were the PROGRESS factors consistently associated with lower PCS and MCS. In the model I (unrestricted sample of patients with MSKD), patients with primary school education scored 5.3 and 3.3 points lower in PCS and MCS, respectively, compared to patients with a university diploma. In those expected to work (model II), persons receiving state living allowance scored 5.0 and 4.7 points lower on PCS and MCS scales, respectively, than patients with paid work. In this subgroup, education did not have an independent influence on MCS. As for the other PROGRESS factors in both models, gender was only significantly associated with PCS: females scored physical health 2.1 points lower than males. Age always had a significant but negligible contribution to PCS and MSC (around 0.1 point change in health per year of age, or 1 point per 10 years). Ethnic origin and place of residence (postal code) did not influence health outcomes in any model, including univariable analyses. Smoking status and the number of comorbidities were relevant confounders in all analyses with both PCS and MCS. BMI was an important confounder when PCS was the outcome (tables 2 and 3). Education and/or social status had stronger impact on physical and mental health compared with age or gender.
Comparison of associations between PROGRESS factors and SF-12 physical component across subpopulations with different diseases for the whole population (model I), and subgroup of persons expected to have paid employment (model II)
Comparison of associations between PROGRESS factors and SF-12 mental component across subpopulations with different diseases for the whole population (model I), and subgroup of persons expected to have paid employment (model II)
Comparison of impact of PROGRESS factors on physical health in patients with MSKD and other disorders
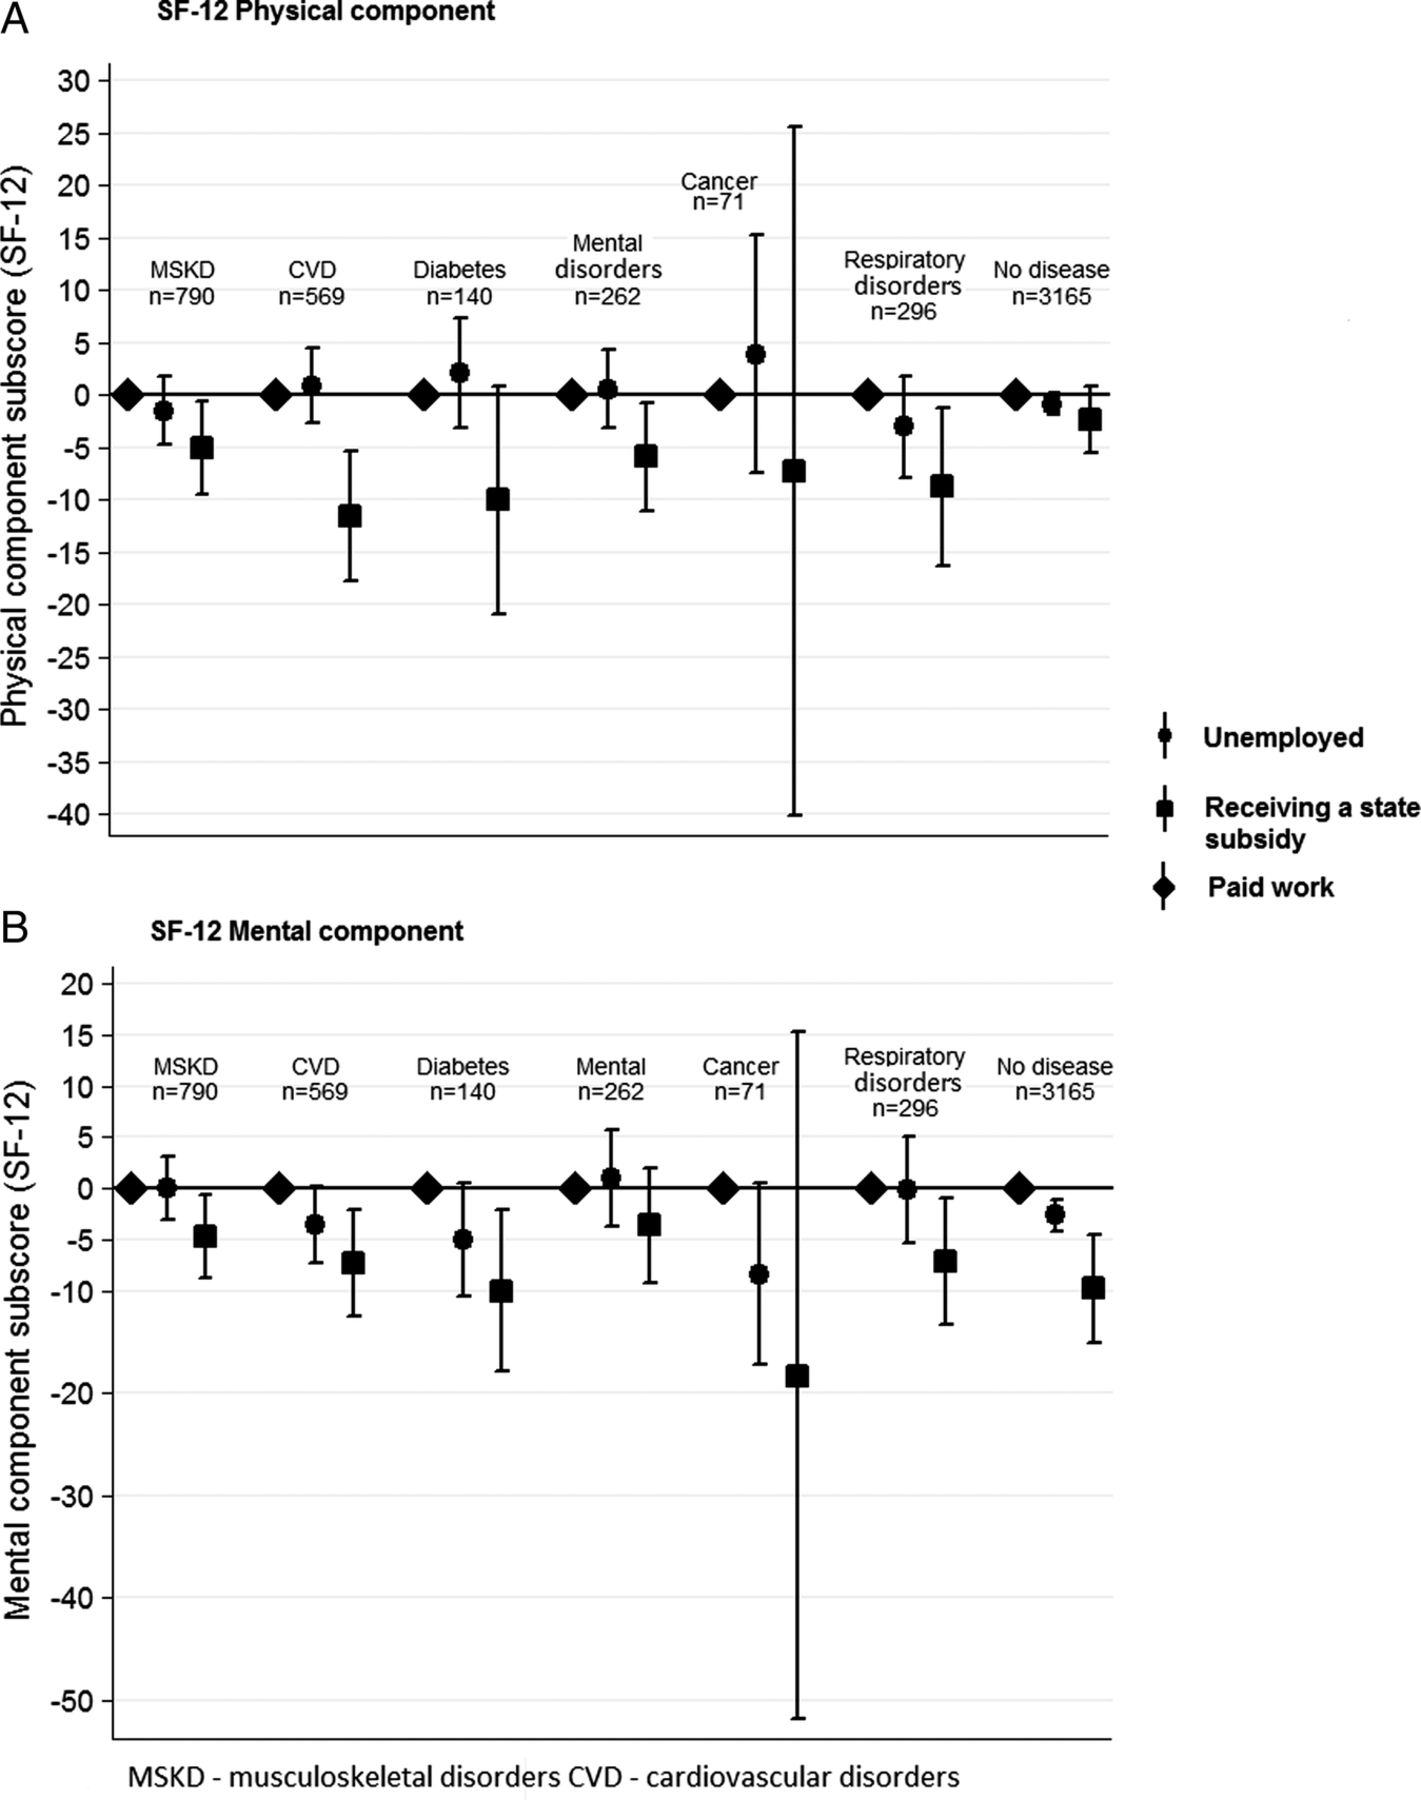
The gradient in physical health by educational level in the total sample (model I) observed in patients with MSKD was also present in comparable magnitude in patients with CVD (lower educated persons with CVD had a 6.6 points lower score on PCS compared with university graduates) and even stronger in patients with mental disorder (8.0 points lower) and respiratory disorders (9.1 points lower). Gradients were also seen in patients with diabetes (5.0 points lower) and in the healthy population (4.2 points lower), and these were slightly lower than in MSKD (table 2 and figure 1A). When the analysis was limited to those expected to work (model II), differences in PCS between employed persons and those receiving state living allowance among patients with CVD, mental disorders and respiratory disorders were higher compared to patients with MSKD (eg, in MSKD, employed patients had on average 5 points higher score on PCS, and in CVD, mental and respiratory disorder, those differences reached 11.6, 5.9 and 8.8 points, respectively). No significant health gradients across social status were observed in patients with cancer or diabetes, or in the healthy population.

Relative impact of the different levels of education on the physical and mental components of SF-12 across the different chronic disorders. University education level was always considered the reference category, that is, the impact of the other education categories on physical and mental components of SF-12 is considered in comparison to university education (SF-12, 12-item Short-Form Health Survey).
Comparison of impact of PROGRESS factors on mental health in patients with MSKD and other disorders
In the total group (model I), a health gradient by education in relation to mental health was present across MSKD and patients with CVD in comparable magnitude; mental health in persons with the lowest educational attainment (vs the highest) was on average 3.8 points lower in those with a CVD and 3.3 lower in those with an MSKD. In all other diseases, a trend to have worse mental health in lower educated individuals was present but did not reach statistical significance (figure 1B). Older age was associated with better mental health outcomes in all groups of diseases except cancer (where the effect of age was not statistically significant) but the effect never exceeded 0.13 points per year (table 3). In those expected to be in paid employment (model II), the gradient in mental health by social status in patients with MSKD was less strong compared to patients with CVD, diabetes and respiratory disorders, and in healthy individuals. In patients with MSKD, the average difference between a person with a paid job and a person who received state living allowance was 4.7 points, and this difference mounted to be 7.3, 10.0, 7.2 and 9.8 points in patients with CVD, diabetes and respiratory disorder, and in the healthy population, respectively (table 3 and figure 2B). Social status did not appear to be significantly related to mental health in patients with cancer and those with mental disorders.

Relative impact of social status on the physical and mental components of SF-12 across the different chronic disorders in patients expected to have paid work. Paid work was always considered the reference category, that is, the impact of the other social status categories on physical and mental components of SF-12 is considered in comparison to paid work (SF-12, 12-item Short-Form Health Survey).
Significant interaction between social status and the number of other morbidities was detected in analyses restricted to patients with MSKD who were expected to have paid work. Among patients who in addition to MSKD had at least one other disease, those receiving state subsidy scored 8.1 lower on MCS compared to patients with paid work, compared to a small and non-significant difference of 3 points on MCS scale of social status in those having only an MSKD and no comorbidity. This amplifying effect of comorbidity did not hold true for other diseases.
Models based on non-imputed data and extreme scenarios were compared with the main analysis (based on imputed dataset). The observed gradients in health outcomes across PROGRESS factors persisted under the extreme scenarios (see online supplementary appendix 2), and coefficients derived from models based on imputed data did not differ by more than 15% from the models computed using non-imputed data. These additional analyses indicate that models were robust.
Discussion
MSKD in the Dutch population was not only prevalent (reported by 20% of respondents), but was also associated with the lowest level of physical health. From the PROGRESS factors explored, lower education and adverse social status (having to rely on living allowance) were the most important factors related to gradients in physical and mental health among patients with MSKD. The contribution of these factors was more pronounced in relation to physical than to mental health. In the subsample of persons who were expected to have paid work, lower education had no contribution to mental health in addition to social status. The observed effects of low education and adverse social status exceeded the thresholds of what is considered the minimal clinical important difference for the SF-12 at an individual level, namely 2.5–5 points.29 ,30 Differences by age and gender were statistically significant, but negligibly small. We did not observe any health gradients by ethnic origin or place of residence. Importantly, comorbidities and smoking status were always important confounders for both physical and mental health of patients with chronic diseases, and BMI was particularly relevant for physical function. It is of note that the presence of comorbidities even amplified the effect of not having paid employment (having to rely on living allowance) on mental health.
Previous studies consistently showed that low SES was associated with poorer disease outcomes in patients with different MSKD, among other studies on rheumatoid arthritis (RA), gout, osteoarthritis, joint arthroplasty and systemic lupus erythematosus.11 ,15 ,31–35 Our findings with regard to education, social status, age and gender are consistent with existing evidence. However, in contrast to our findings, which showed that ethnic origin was not associated with health even in unadjusted analyses, some studies also observed racial and ethnical disparities.35–39 Hispanics and African-Americans have been described as having worse disease outcomes compared with Caucasians, and SES, sociocultural beliefs, racism and biology were mentioned among the possible explanatory factors.36 ,38 Notably, this evidence comes exclusively from the USA. In Europe, one recent Swedish study compared patients with RA with different immigration status in terms of disease characteristics and treatment outcomes. The authors observed no differences in objective measures of inflammation while immigrants reported more pain, worse function and tender joint count, but only in the first 2 years of observation.40 It can be that due to equal provision of health insurance, overall more egalitarian societies and the smaller proportion of ethnical minorities compared to US society, the problem is less pronounced and apparently temporary in Sweden. Also, our findings confirm that there is no difference in health between persons of western or non-western origin. Absolute numbers of non-western origin individuals in the Netherlands was low (about 11% in general population) and even lower in our sample (5%). The fact that those with lowest literacy and poorest health did not participate in this survey cannot be excluded. At the same time, it is important to note that we could only distinguish between western and first and second generation non-western origin. Notwithstanding, this is a common classification suggested by Statistics Netherlands.20 Further studies of ethnic/racial differences in Europe would be helpful to validate our findings.
Place of residence in our study was measured as a four-digit postcode, referring to an administrative area within a city of about 8.3 km2 and with approximately 4000 residents,41 and was not relevant to health outcomes in our study. Although place of residence has been previously shown to be related to rheumatic health independently of individual SES,42 defining and measuring this factor remains a challenge, and may be a reason for negative results in our study.43 In the Netherlands, the four-digit position postcode has been used in studies that explored neighbourhood influence on life style and perceived health in the general population.41 ,44 At the same time, smaller and more homogenous administrative divisions (such as neighbourhoods) exist in the Netherlands and may be more suitable to capture cultural climate, socioeconomic deprivation and certain characteristics of environment that are important for an individual's health.45 ,46 Our data did not allow such detailed analyses.
An important finding of our study was that comparable gradients by education in physical health were present across all other chronic diseases except cancer. For mental health, lower education was only significantly associated with worse mental health in those with CVD while in all other diseases trends towards worse mental health were seen but these did not reach statistical significance. It is of note that statistical significance is strongly related to sample size, and MSKD and CVD were the largest groups in our sample. The regression coefficients suggest that education is of similar importance in all chronic diseases, to contribute to gradients in mental and physical health. Also, in those expected to have work, gradients by social status did not reach statistical significance in all diseases (the sample of those expected to have paid employment was relatively small), but regression coefficients invariably pointed to worse physical and mental health in persons receiving state living allowance independent of the disease.
An interesting secondary finding was that inequalities in physical and mental health, attributable to lower education and adverse social status (relying on state living allowance), were also observed in the healthy population in a similar direction but with smaller magnitude, compared with subgroups of patients with chronic diseases. It appears that SES mainly influences the absolute level of health-related quality of life, while the gradient remains or is slightly amplified in the presence of disease. This effect was somewhat more pronounced for the physical component of SF-12.
This study has some limitations. First, a low response to the survey (22.4%) can limit the generalisability of findings. However, it has been previously shown that low response rates are typical for these types of surveys and are not an indicator of poor survey quality.47 ,48 Furthermore, when comparing demographics of the sample with data from the Dutch Bureau of Statistics, the sample seemed representative with the exception of a somewhat lower representation of lower educated respondents. Second, it is known that in self-administered surveys it is more difficult to reach respondents with low levels of education and literacy.49 This could lead to underestimation of the extent of the problem but is unlikely to compromise the general findings. Furthermore, MSKDs were defined as ‘severe or persistent symptoms in/or around the joints’ and data did not allow making further distinction between MSKDs, warranting future research to understand whether SE gradients are similar in all rheumatological diseases. At the same time, the sample was large enough to allow analyses in subgroups of patients with major groups of chronic disorders and across these groups, and this constitutes a clear strength of this study. Third, the presence of chronic disorders was self-reported, which can present a somewhat blurred picture of reality. However, self-report diseases have been previously shown to have generally good agreement with the data from medical records, and respondents were asked to report the diagnoses that were previously confirmed by a physician, which additionally increases the reliability of the collected data.50 ,51 Next, a number of PROGRESS factors were not available in the survey, namely disability, reliable data on occupation, religion, income, social capital, as well as sexual orientation and literacy. These factors are not routinely measured in surveys, however, they can be very important for advancing the understanding of health inequities.7 For example, a recent study of health literacy among patients with RA showed that lower literacy was more strongly associated with functional status than prednisone use, smoking history and biological agent use, and was independent of educational attainment.52 Next, a cross-sectional design does not allow the uncovering of causal relationships. Health and social status likely reinforce each other. While poor health limits employment possibilities, unemployment leads to economic deprivation and psychological stress, which worsen health outcomes. Further research and more sophisticated study designs are needed to understand the factors that mediate the relationship between education, social status and health. For example, we can hypothesise that low SES leads to less access to health-promoting services, hinders capacities to understand the information related to healthy life style choices or creates higher levels of stress, all of which could have a direct impact on self-reported health-related quality of life. Last but not least, the disease groups were rather broad, and there was no opportunity to distinguish between the relative severities of diseases within the groups.
To the best of our knowledge, no studies have been performed comparing the physical and mental health gradients according to SES across diseases. It appears that lower SES individuals may benefit from preventive and clinical care that is tailored for this particular group independently of the type of disease they suffer from. Joint efforts across medical specialities to develop such tailored care are justified by the fact that lower SES patients in major groups of chronic diseases experience comparable disadvantages.
In conclusion, we found that health-related quality of life in individuals across various chronic disorders was strongly associated with socioeconomic position defined by lower education and adverse social status, while age and gender had limited contribution. While there were differences in absolute health levels between diseases, the relative gradients caused by socioeconomic factors were similar and even present in the persons who did not report a physician-diagnosed disorder. Low-educated persons may in general have less skills and capacities, and often less opportunities to cope with the consequences of their disease.
Inequities across PROGRESS factors and pathways between socioeconomic disadvantages should be further explored across a whole range of factors and, more importantly, results should be considered in clinical practice, intervention studies and in the broader context of policy decisions. Low SES of the patient should be a signal for healthcare professionals and other stakeholders to join efforts in order to reduce health inequities.
References
Supplementary materials
Supplementary Data
This web only file has been produced by the BMJ Publishing Group from an electronic file supplied by the author(s) and has not been edited for content.
- Data supplement 1 - Online appendix1
- Data supplement 2 - Online appendix2
Footnotes
PP and SR are joint first authors.
Contributors AB conceived the idea for the manuscript and APK provided advice on statistical analyses. PP, SR, AMC and AB conducted the analyses and drafted the manuscript. All authors contributed to the interpretation of the results, reviewed and approved the manuscript before submission.
Funding This study was initiated and financially supported by the Dutch Arthritis Foundation.
Competing interests None.
Ethics approval The study was approved by the Medical Ethical Committee of the Leiden University Medical Center.
Provenance and peer review Not commissioned; externally peer reviewed.
Data sharing statement No additional data are available.