Article Text

Abstract
Objective: To investigate the intra-articular vascularisation of the synovial pannus in the knee of patients with rheumatoid arthritis (RA) with power Doppler ultrasonography (PDS) and an echo contrast agent and correlate the area under the time-intensity curves with the clinical findings and laboratory measures of disease activity.
Method: Forty two patients with RA (31 women, 11 men) with history and signs of knee arthritis, classified according to a modified index of synovitis activity (active, moderately active, and inactive), were studied. Clinical and functional assessment (number of swollen joints, intensity of pain, general health—visual analogue scale, disability index—Health Assessment Questionnaire, Ritchie articular index) and a laboratory evaluation were made on all patients. Disease activity was evaluated using the disease activity score (DAS) and the chronic arthritis systemic index (CASI) for each patient. All patients were examined with conventional ultrasonography and PDS before injection of intravenous ultrasound contrast agent (Levovist). The quantitative estimation of the vascularisation of the synovial membrane was performed with time-intensity curves and calculation of the area under the curves.
Results: The mean (SD) value of the area underlying time-intensity curves was 216.2 (33.4) in patients with active synovitis, 186.8 (25.8) in patients with moderately active synovitis, and 169.6 (20.6) in those with inactive synovitis. The mean value of the areas differed significantly between the patients with active and those with inactive synovitis (p<0.01). The mean value of the area under the curve of the entire group was weakly correlated with the number of swollen joints (p=0.038), but a strong correlation was found with composite indexes of disease activity such as the DAS (p=0.006) and CASI (p=0.01). No correlation was found with age, disease duration, and other laboratory and clinical variables.
Conclusion: PDS may be a valuable tool to detect fractional vascular volume and to assist clinicians in distinguishing between inflammatory and non-inflammatory pannus. The transit of microbubbles of ultrasound contrast across a tissue can be used to estimate haemodynamic alterations and may have a role in assessing synovial activity and the therapeutic response to treatment of synovitis of the knee joint.
- power Doppler sonography
- echo contrast agent
- rheumatoid arthritis
- synovial tissue
- ANA, antinuclear antibody
- CASI, chronic arthritis systemic index
- DAS, disease activity score
- ESR, erythrocyte sedimentation rate
- HAQ, Health Assessment Questionnaire
- IV, intravenous
- MRI, magnetic resonance imaging
- PDS, power Doppler sonography
- RA, rheumatoid arthritis
- RAI, Ritchie articular index
- RF, rheumatoid factor
- SF, synovial fluid
- US, ultrasound
- VAS, visual analogue scale
Statistics from Altmetric.com
- ANA, antinuclear antibody
- CASI, chronic arthritis systemic index
- DAS, disease activity score
- ESR, erythrocyte sedimentation rate
- HAQ, Health Assessment Questionnaire
- IV, intravenous
- MRI, magnetic resonance imaging
- PDS, power Doppler sonography
- RA, rheumatoid arthritis
- RAI, Ritchie articular index
- RF, rheumatoid factor
- SF, synovial fluid
- US, ultrasound
- VAS, visual analogue scale
Evaluation of joint synovitis a nd its response to treatment in patients with rheumatoid arthritis (RA) or other inflammatory arthropathies is based largely on clinical findings. Proliferation of the synovial tissue resulting in the formation of synovial pannus is an early event in the course of the disease and can be seen before destruction of cartilage and bone.1 Vascularisation of the synovial pannus appears to be crucial to its invasive and destructive behaviour and correlates with disease activity.2 It has recently been shown that synovial membrane volumes as estimated by magnetic resonance imaging (MRI) are closely related to the rate of progressive joint destruction.3 However, MRI is an expensive and time consuming technique and, therefore, cannot be used routinely.4 Ultrasonography (US) offers a non-invasive, reproducible, non-radiating, and relatively inexpensive method for detecting joint effusion and bursal fluid collection and may depict hyperplastic synovium and underlying erosive disease.5,6 Conventional US, however, does not provide colour maps of tissue and direct information about haemodynamic alterations, which may occur in soft tissue inflammation. With modern high quality sonographic equipment, power Doppler sonography (PDS) has been shown to depict the soft tissue vascular volume in musculoskeletal inflammatory diseases and may be helpful in evaluating the inflammatory activity and efficacy of the therapeutic regimens.7,8 However, PDS reflects the power generated by the movement of blood cells within a vessel and many factors, such as the machine, the operator, and the acoustic conditions, are involved in image processing.9 The use of intravenous contrast medium enhancement may potentially increase the sensitivity of the examination, enhancing the thickened, hypervascular, and inflamed synovium.10 Ultrasound contrast agents add further information and provide a means of quantifying inflammatory disease by estimation of the US signal intensity changes after contrast agent injection—that is, by contrast enhancement curves.11 Estimation of the area under US contrast enhancement curves may help to produce a method of measuring synovial activity.
This study aimed at exploring the intra-articular vascularisation of the synovial pannus in the knees of patients with RA with an echo contrast agent, and correlating US contrast enhancement curves with the clinical findings and laboratory measures of disease activity.
PATIENTS AND METHODS
Patient group
Forty two patients (31 women, 11 men) with RA diagnosed according to the 1987 ACR criteria,12 attending the care facilities of the department of rheumatology of Ancona, were recruited to a cross sectional study over a six month period. All the patients had a history and signs of knee arthritis. Additional inclusion criteria were age of at least 18 years and no major cognitive deficits or psychiatric disturbances that would preclude completion of the questionnaire. Patients were also excluded if they had received intra-articular steroid injections in the preceding six months, physiotherapy for their knee during the preceding three months, or had other clinical unstable medical conditions. All patients gave informed consent to participate in the study, which was performed according to the criteria of the Helsinki Declaration and approved by the institutional review board for human research.
Clinical and functional assessment
The patients were examined by an experienced rheumatologist. Clinical activity of knee inflammation was classified according to a modified index of synovitis activity,13 as active if the knee was swollen, warm, and tender, moderately active if it was swollen and tender, and inactive if it was only swollen or was neither swollen, warm, nor tender. In addition, the following variables were considered: number of swollen joints (of a total of 44 diarthrodial joints); intensity of pain, assessed by a 100 mm visual analogue scale (VAS) (0, no pain; 100, worst possible pain); general health on a VAS (0, best possible; 100, worst possible), and disability index, assessed by the Health Assessment Questionnaire (HAQ) (range 0–3).14 A version of the HAQ adopted for use among Italian patients was used in this study.15 The Ritchie articular index (RAI), obtained according to the original description (53 joints in 26 units, graded for tenderness on pressure (0, no pain; 1, patient complains of pain; 2, patient complains of pain and winces; 3, patient complains, winces, and withdraws; maximum score 78)), was used to assess the degree of joint tenderness.16
Disease activity was also evaluated using either the disease activity score (DAS)17–23 or the chronic arthritis systemic index (CASI)20,21 for each patient. The range of DAS varies from 0 to 10.8,9 The CASI includes the patient's assessment of pain by VAS, RAI, erythrocyte sedimentation rate (ESR), and HAQ (10,21). These four items were used to construct a CASI according to the following formula:

The theoretical maximum possible value of the CASI is 74.10,21 The CASI has proved to be very useful for discriminating between high and low disease activity11 and monitoring the course of the arthritis, as well as the response to therapeutic regimens.10,21
Laboratory evaluation
In each patient laboratory evaluation included determination of rheumatoid factor (RF) by nephelometry (RF positive at a titre of >20 IU/ml) and antinuclear antibody (ANA) by immunofluorescence using HEp-2 cells as substrate (positive at a dilution of >1:40). Synovial fluid (SF) was obtained from knee joints (therapeutic aspirations) in 32 of the 42 (76%) rheumatoid patients. Total leucocyte count was determined in an aliquot of heparinised SF, with the remainder being centrifuged to remove cells.
Ultrasonographic and colour Doppler examinations
Informed consent was obtained before the US examination, which was carried out immediately after the clinical examination. US was performed by an experienced radiologist (MC) who was unaware of the results of the clinical examination of the patients. The investigator used an AU5 Harmonic (Esaote Biomedica, Genova), equipped with software for online image storage, analysis, and automatic quantification of the US signal intensity changes after contrast agent injection—that is, by contrast enhancement curves. The technical parameters of the examinations included 10–13 linear transducer, pulse repetition frequency of 1000–1500 Hz, highest gain level without background noise, and high colour persistence and low filter. The knee joint was first investigated with conventional grey scale US and PDS was also performed. The knee was examined with the patient in the recumbent position, in moderate flexion (30°), obtaining both transverse and longitudinal scans of the suprapatellar region and the lateral and medial recesses, according to EULAR guidelines for US.22 In each study both knees were examined, either because patients had bilateral arthritis or because contralateral asymptomatic knees were used as comparison. The sonographic signs of arthritis such as joint effusion, Baker's cysts, thickness of echogenic intra-articular structures, such as pannus, synovial proliferation, or synovial villi, were recorded. Synovial villi could be measured in the suprapatellar recess. The thickness was graded on the same scale used in other studies23,24: 0, <2 mm; 1, 2–5 mm; 2, 6–8 mm; 3, >8 mm. PDS imaging was performed on the suprapatellar pouch by selecting a region of interest that included soft tissue and underlying bone. An intravenous injection of ultrasound contrast agent (Levovist, Schering, Germany) was given and the vascularisation in the synovial membrane was estimated quantitatively with contrast enhancement curves; the area under the time-intensity curve for a vascular region of interest was calculated using dedicated software. A single dose of 2.5 g of Levovist was prepared at a concentration of 300 mg/ml in saline solution. After shaking for 10 seconds, the suspension was left for two minutes before intravenous injection (as recommended by the manufacturers). Contrast medium was injected into an antecubital vein by an 18–20 G needle and slow infusion (one minute) to improve image quality by minimising saturation artefacts. The PDS data were obtained on a predetermined plane of acquisition that was maintained constant for five minutes.
Statistical analyses
Statistical analysis was performed using two statistical packages (Medcalc software for Windows and Stat View II for Macintosh, Abacus Conceps). Results are presented as mean (standard deviation) or prevalence rates. The non-parametric Mann-Whitney U test was used for comparison of the areas under the curves derived from the sample of patients. Correlations between areas and clinical data and laboratory findings of the patients with RA were analysed by Spearman's (rs) rank correlation test. The level of statistical significance was established at 5% for all tests.
RESULTS
Patient characteristics
At the time of examination the mean age of the 42 patients was 53 years (range 24–76), and the disease duration was 5.9 years (range 6 months–14 years). Thirty one (74%) patients were positive for RF, and 13 (31%) for ANA. At study entry, 33 (79%) patients were receiving non-steroidal anti-inflammatory drugs and 15 (36%) were taking low daily doses of 6-methylprednisolone (<8 mg/day). In addition, 38 (90%) patients were being treated with one or more disease modifying antirheumatic drugs: 14 with methotrexate, five with sulfasalazine, six with hydroxychloroquine, 10 with methotrexate plus cyclosporin A, and three with methotrexate plus both hydroxychloroquine and cyclosporin A. Table 1 shows the disease characteristics of the study patients.
Disease characteristics of the study patients at the time of examination (n=42)
Findings in RA knee joints
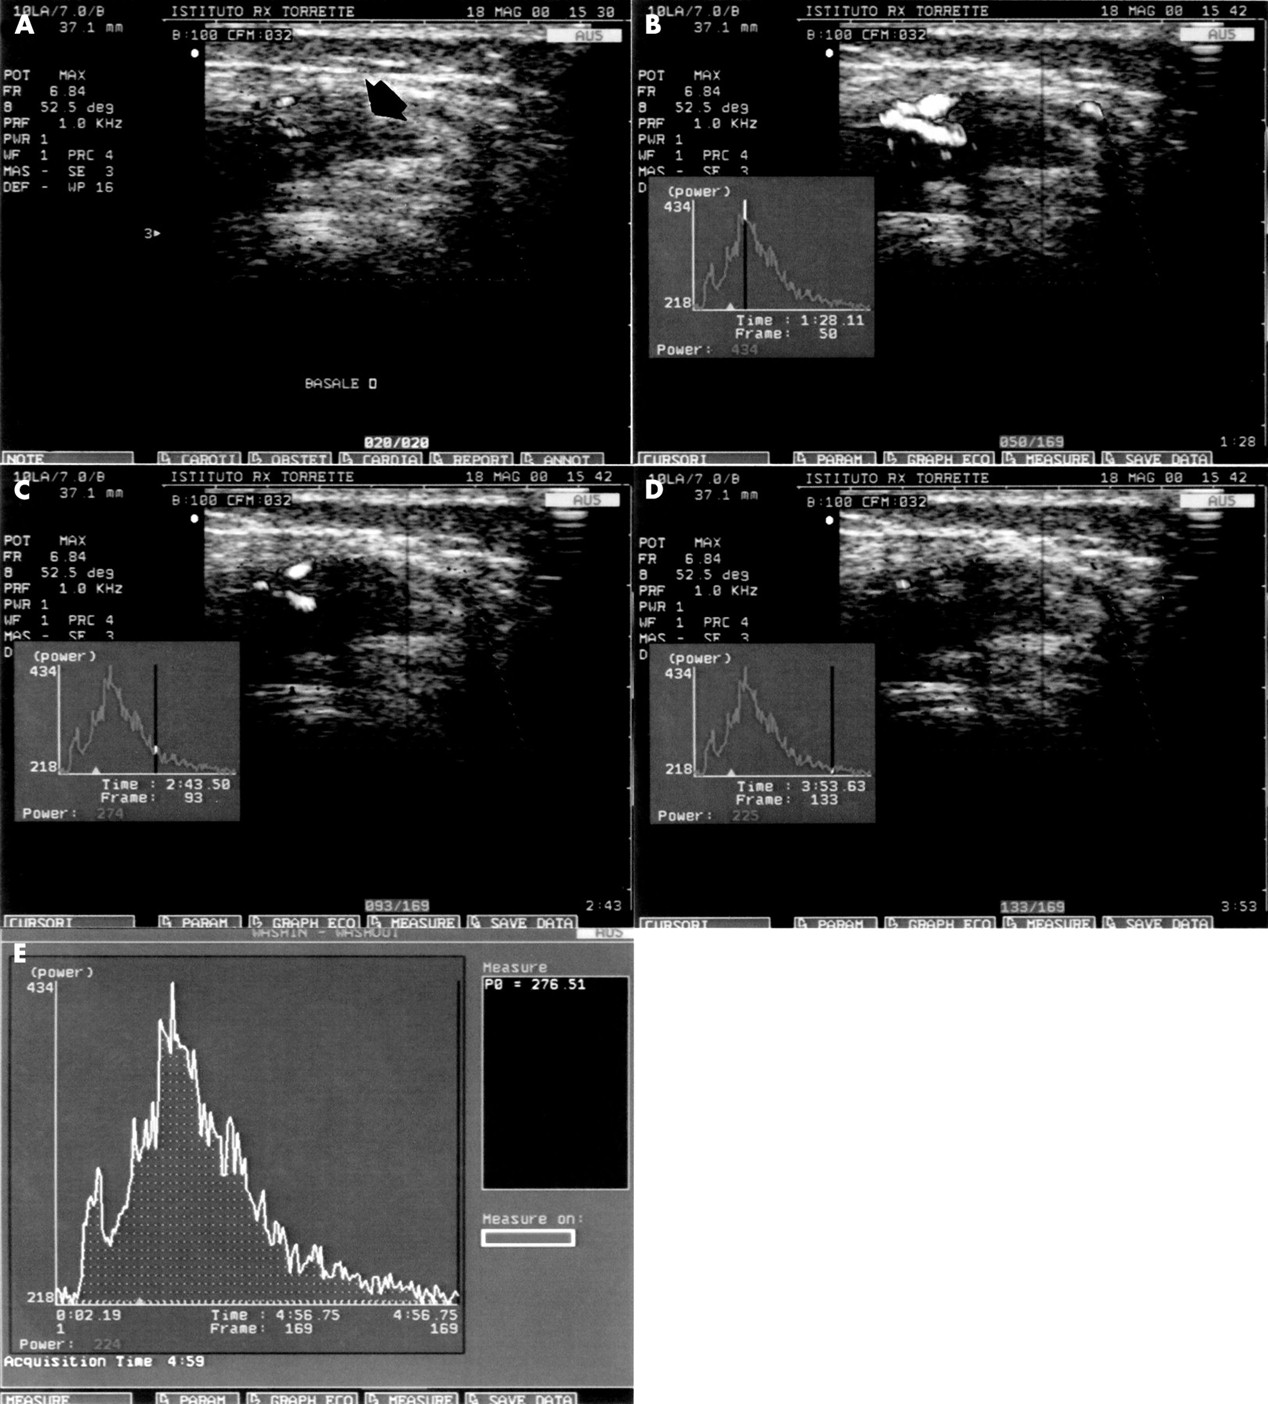
We examined 42 knee joints in the patients with RA. The time required for examination of each RA knee which had a modified index of synovitis activity13 was less than five minutes. Fifteen knees (36%) had active disease, 14 (33%) had moderately active disease, and 13 (31%) had inactive disease. Synovial pannus was detected in 13/15 (87%) of the knees with active synovitis, in 13/14 (93%) with moderately active synovitis, and in 11/13 (85%) with inactive synovitis. The enhancement curves and calculation of the mean values (SD) of the area underlying the curves gave values of 216.2 (33.4) in patients with active synovitis, 186.8 (25.8) in patients with moderately active synovitis, and 169.6 (20.6) in those with inactive synovitis. Figure 1 shows the variations of the signal intensity over time after intravenous (IV) administration of Levovist (B, C, D) and the corresponding bidimensional PDS image, before (A) and after (B, C, D) the contrast agent, as well as the enhancement curve with calculation of the underlying area in each type of knee synovitis. A comparison of the mean values of the areas under the curves showed a significant difference between the patients with active and those with inactive synovitis (area: 216.2 (33.4) v 169.6 (20.6); p<0.01). The mean value of the area under the curves of the entire group after IV administration of Levovist was weakly correlated with the number of swollen joints (p=0.038), but it showed a stronger correlation with the composite indexes of disease activity, such as the DAS (p=0.006) (fig 2) and the CASI (p=0.01) (fig 3). There was no correlation between the area under the curves and the age of the patients, disease duration or other laboratory (ESR, total SF leucocyte count) and clinical measures ( HAQ, general health, VAS-pain, RAI).

Active synovitis. The figure shows the contrast enhancement curve after the IV administration of Levovist (B, C, D) and the corresponding bidimensional PDS image of the synovial pannus detected in the suprapatellar transverse scan, with the knee joint in moderate flexion (30°) (arrow), before (A) and after (B, C, D) the contrast agent, as well as the area under the time-intensity curve (E).

Correlation between the area under the time-intensity curve and the disease activity score (DAS) (Spearman's rank correlation test).

Correlation between the area under the time-intensity curve and the chronic arthritis systemic index (CASI) (Spearman's rank correlation test).
DISCUSSION
Rheumatoid arthritis is a chronic systemic disease characterised by an inflammatory erosive synovitis. Early changes in the synovium are represented by neovascularisation, inflammatory cell infiltration, and associated synovial hyperplasia, which produce a pannus of inflammatory vascular tissue.25 This “tumour-like” pannus destroys adjacent structures, including the bone, cartilage, tendons, ligaments, and capsule.
The assessment of perfusion of synovial pannus may prove to be an important objective in evaluating synovitis activity.7,8 Differentiation between inactive pannus and persistent inflammation in the rheumatoid joint is one of the most important problems for the clinician to solve, because it may have a great impact on the new therapeutic advances for RA. Radiographic evaluation is routinely used to assess the severity and progression of RA, and to establish the effects of treatment.26,27 However, radiographic changes mostly represent late and indirect signs of synovial disease. Moreover, there is some evidence that disease that appears to be inactive clinically may progress radiologically, leading to the conclusion that remission must be confirmed by the absence of radiological progression.28–30 Recently, MRI has been proposed as a potentially valuable tool for evaluating bone and soft tissue changes in patients with RA.4,31 Use of a paramagnetic contrast agent such as gadolinium diethylenetriamine pentaacetic acid (Gd-DTPA) has improved the diagnostic capabilities of MRI by allowing direct visualisation of the inflamed synovium in patients with arthritis.4,31,32 US imaging offers a simple, non-invasive, reproducible, non-radiating, and inexpensive method for examining joints in patients with rheumatic diseases. It has been used to evaluate bone, cartilage, effusion, and pannus of the joint, but it does not provide direct information about disease activity.5,6 With modern high quality sonographic equipment, colour/PDS can be used to determine the volume of blood flowing even in small blood vessels. PDS is a technique that encodes the power in the Doppler signal in colour, rather than the mean Doppler frequency shift as in conventional colour Doppler methods.33 The increased sensitivity and better vascular detailing of PDS have been used to detect fractional vascular volume and characteristics in vessels that are poorly imaged with conventional colour Doppler.33 PDS reflects the movement of blood cells within a vessel; however, it does not always indicate increased vascularity of the synovium, which is still a problem in interpreting PDS images. PDS findings are influenced by many factors such as the examiner, machine, and the acoustic conditions used in image processing. PDS should be used to assist the clinician in determining whether the region of interest shows increased blood flow compared with other tissue.34,35 This information can be important in distinguishing between inflammatory and non-inflammatory pannus and in the assessment of therapeutic response to the treatment of synovitis of the knee joint.8 The use of ultrasound contrast agent and the development of specific ultrasound sequences may increase the strength of signals from deep and small vessels and may have a great impact on patient management.36 The microbubbles of Levovist, composed of galactose/palmitic acid added to the sugar particles, with a diameter of 2–8 μm, have been shown to enhance Doppler signals in veins and arteries.11 The diameter of the microbubbles allows flow in capillaries, thus enhancing the signal in tissue and improving the PDS signal in small vessels and inflamed synovium.11 The transit of microbubbles across an organ or tissue can be used to estimate haemodynamic alterations. The area under the curve gives information about the amount of contrast agent traversing the region of interest, although the effects of attenuation mean that only relative measurements are reliable.
In this study we used PDS and ultrasound contrast agent to evaluate the degree of vascularisation of the synovial membrane of the knee joints of patients with RA and to correlate the area under the time-intensity curves obtained after administration of Levovist with the clinical findings and laboratory measures of disease activity. The results show that the area under the curves correlated with the degree of knee inflammation, and was significantly higher in patients with clinically active synovitis than in those with inactive synovitis. In addition, the mean value of the area under the curves correlated weakly with the number of swollen joints (p=0.038), whereas it showed a stronger correlation with the composite indexes of disease activity, such as DAS (p=0.006) and CASI (p=0.01). No other correlations were found between the demographic or clinical data and the mean values of the area under the curves. Our results are in accordance with those of other studies, which also found no correlation between a single clinical parameter and similar determinations of synovial area and volume by US and MRI.3,4,31,37
The usefulness of PDS in assessing the degree of vascularity of the synovial membrane has been recently reported by Walther et al.35 These authors evaluated 23 patients, 10 with RA and 13 with osteoarthritis who were undergoing arthroplasty of the knee joints and found a significant correlation between the results of PDS and the degree of vascularity of the synovial tissue, as demonstrated by haematoxylin and eosin stain and immunohistochemistry. However, Walther et al did not use an echo contrast agent35 as we did, and the power Doppler signal of the synovial membrane, as well as the degree of vascularity, was classified semiquantitatively on a scale of 1–4. Giovagnorio et al compared PDS with laboratory indices of disease activity in 22 patients with knee arthritis (RA, seronegative spondyloarthritis, seronegative polyarthritis, osteoarthritis).38 The PDS results were expressed as the presence (visible colour spots, either sparse or coalescing to form a sort of “synovial blush”) or absence (no definite colour spots inside the synovium) of hypervascularity. Various grades of synovial hyperaemia were found in 12/22 cases, prevalent in patients with seronegative polyarthritis (100% of cases) and seronegative spondyloarthritis (66% of cases). Patients with synovial hypervascularity were younger than those without it and had statistically higher values of the ESR, as well as lower haemoglobin and serum iron levels.38 Schmidt et al examined 20 patients before total prosthetic knee joint replacement by colour Doppler sonography and PDS and found that both techniques were equivalent in detecting small intra-articular vessels and better than conventional grey scale US in characterising the nature of intra-articular echogenic structures.7 Recently, Magarelli et al examined 40 patients with synovitis due to different rheumatic diseases using conventional US and PDS techniques before and after IV injection of Levovist11; 14 patients then underwent MRI with and without Gd-DTPA. PDS with contrast medium was significantly more valuable than the same technique without Levovist in evaluation of the vascular spots in the joints and soft tissue examined. However, there was no statistically significant difference between PDS and MRI after contrast medium because both techniques were concordant in all cases.
In conclusion, these data indicate that PDS may be a valuable tool in distinguishing between inflammatory and non-inflammatory pannus of knee joints in patients with RA. The development and introduction of microbubbles ultrasound contrast and new ultrasound images appears to be a very promising technique in evaluating and measuring the degree of knee joint inflammation in RA. The time-intensity curves may have a clinical potential for both diagnostic and therapeutic purposes. Investigations into the quantification of synovial tissue vascularisation of the knee joint after local intra-articular treatments are continuing.