Article Text

Abstract
Objective Identify serum biomarkers modulated by golimumab treatment and associated with clinical response in patients with ankylosing spondylitis (AS).
Methods Sera were collected at weeks 0, 4 and 14 from 100 patients with active AS in the GO–RAISE study. Patients were randomly assigned subcutaneous injections of placebo, golimumab 50 mg, or golimumab 100 mg every 4 weeks. Samples were tested for select inflammatory, bone and cartilage markers, and protein profiling was also performed.
Results Golimumab treatment resulted in significant decreases in several serum proteins at weeks 4 and 14 compared with placebo. Patients who achieved clinical response at week 14, as assessed by a ≥20% improvement in the Assessment in SpondyloArthitis international Society response criteria (ASAS 20), demonstrated a distinct biomarker profile with lower levels of acute phase reactants and inflammatory biomarkers compared with patients who did not. Notably, combinations of two or three biomarkers assessed at baseline were predictive of various clinical outcomes (ASAS 20, Bath ankylosing spondylitis disease activity index 50 or Bath ankylosing spondylitis functional index) using a logistic regression analysis, and the overall predictive values for these combined biomarkers were greater than observed for C-reactive protein (CRP) alone.
Conclusion Golimumab modulated acute phase reactants and inflammatory markers in patients with active AS. Specific combinations of biomarkers at baseline demonstrated a stronger prediction for clinical efficacy than CRP alone. These data provide insights into the mechanism of golimumab on inflammatory processes driving AS pathology, and may have utility in managing the treatment of patients with AS.
This paper is freely available online under the BMJ Journals unlocked scheme, see http://ard.bmj.com/info/unlocked.dtl
Statistics from Altmetric.com
While the pathogenesis of ankylosing spondylitis (AS) remains unknown, patients with AS have been shown to have markers indicative of increased numbers of T cells and macrophage activation. In addition, the expression of a variety of proinflammatory cytokines, as well as markers of bone metabolism, are increased in the sacroiliac joints and entheses of patients with AS. Elevated serum levels of inflammatory markers (including tumour necrosis factor (TNF)α, interleukin (IL-) 6,1 vascular endothelial growth factor (VEGF),2 Intercellular adhesion molecule-1 (ICAM-1))3 and markers of bone metabolism (bone alkaline phosphatase (BAP) and osteocalcin) have previously been shown to be associated with active AS.4
Elevated TNFα levels in the serum have been shown to correlate with elevated IL-6 and C-reactive protein (CRP) levels in patients with AS.1 In addition, serum matrix metalloproteinase -3 (MMP-3) levels have been shown to correlate with disease activity as assessed by the Bath ankylosing spondylitis disease activity index (BASDAI) score5 and to be an independent predictor of structural damage6 in patients with AS. Patients with spondyloarthropathies also have elevated levels of ICAM-1, which has been shown to correlate with IL-6 and CRP levels.3 IL-6 has been shown to be elevated in the serum of AS patients and to decrease following treatment with infliximab.7 Furthermore, a recent study has shown that the combination of CRP and serum amyloid A were weakly predictive of clinical response to anti-TNFα therapy, and changes in these markers over 3 months significantly correlated with changes in disease activity as assessed by the BASDAI score.8 Elevated serum levels of VEGF were found to correlate significantly with measures of disease activity such as BASDAI score and CRP in patients with AS.2 TNFα inhibition has been shown to reduce levels of VEGF in patients with AS,7 and changes in VEGF levels have also been shown to correlate with changes in CRP, erythrocyte sedimentation rate, and BASDAI score in AS patients receiving anti-TNFα therapy.9
AS is characterised by joint inflammation, destruction and repair. Assessment of markers associated with bone turnover in AS has contributed to elucidating key pathways linked to the disease. During destruction of joint tissues, the cross-links pyridinoline and deoxypyridinoline that bridge between adjacent molecules of types I, II and III collagen in bone, synovium and cartilage are released into the circulation as small peptides.10 In addition, the rate of type I collagen synthesis in bone can be evaluated by measuring serum levels of N-terminal propeptide of type 1 collagen (P1NP).10 In addition, levels of the bone formation markers BAP and osteocalcin have been shown to increase within 4 weeks in patients with AS who received anti-TNFα therapy, and these changes correlated with increases in the bone mineral density of the spine and hip.11 Increases in BAP levels have also been demonstrated at 36 and 52 weeks following anti-TNFα therapy.9
In the current study, we evaluated approximately 100 different serum proteins using multiplex and singleplex assay platforms (ELISA and Luminex) to identify markers modulated by treatment with golimumab (a human monoclonal antibody to TNFα) in patients with active AS. Comparisons of baseline markers, as well as the change from baseline to week 4, were evaluated against several clinical response measures (Assessment in Spondyloarthitis International Society response criteria (ASAS), BASDAI and the Bath ankylosing spondylitis functional index (BASFI)). As these analyses yielded multiple markers at baseline that were strongly associated with these clinical response measures, some additional comparisons to evaluate the potential to predict clinical response in patients treated with golimumab were conducted using just the baseline biomarkers.
Methods
Details of the GO–RAISE study have been published previously.12 Briefly, patients with AS for 3 months or more, a BASDAI score of 4 or greater, a spinal pain assessment score of 4 or greater, and an inadequate response to current or previous non-steroidal anti-inflammatory drugs or disease-modifying antirheumatic drugs were eligible for the study. Approximately 20% of patients across all treatment groups were receiving methotrexate at baseline.
Patients were randomly assigned in a 1:1.8:1.8 ratio to receive subcutaneous injections of placebo (n=78), golimumab 50 mg (n=138) or golimumab 100 mg (n=140) every 4 weeks. At week 16, patients who had less than a 20% improvement from baseline in both total back pain and morning stiffness entered an early escape arm in which patients in the placebo group received golimumab 50 mg and patients in the golimumab 50-mg group had their dose increased to 100 mg. Patients who were originally assigned to the golimumab 100-mg group were not eligible for early escape.
In the GO–RAISE biomarker substudy, the following clinical endpoints were compared against biomarker data. Clinical response was defined as at least a 20% improvement in the (ASAS 20),13 and physical function was evaluated using the BASFI.14 Also, disease activity was evaluated using the BASDAI score,15 with patients achieving a 50% or greater improvement in the BASDAI score defined as BASDAI 50 responders.
Samples were collected for this prospectively planned study at 15 biomarker substudy sites (US and non-US). Serum samples were evaluated for the first 100 patients enrolled in the substudy who had samples collected at weeks 0, 4 and 14. Samples were tested for selected markers using Luminex and ELISA platforms by Quintiles Laboratories (Marietta, Georgia, USA) and Pacific Biometrics (Seattle, Washington, USA). The individual markers selected for these analyses included BAP, COL 2–3/4C long neoepitope, deoxypyridinoline, hyaluronic acid, IL-6, IL-8, ICAM-1, MMP-3, P1NP, osteocalcin, pyridinoline, TNFα and VEGF. The serum samples were also analysed by Rules Based Medicine (Austin, Texas, USA) using the HumanMAP version 1.6 protein profiling analysis.16 The HumanMAP profiling analysis comprised 88 analytes, along with an additional four analytes included as part of the analytical panel (IL-17, IL-18, IL-23 and glutathione-S-transferase). Several of the selected markers listed above (ie, IL-6, IL-8, ICAM-1, MMP-3, TNFα and VEGF) were analysed as individual markers as well as being included in the protein profiling analysis. In an independent study conducted by the sponsor, clinical samples were analysed repeatedly using the HumanMAP profile and were found to have acceptable reproducibility.
Only markers for which at least 20% of all samples were above the lower limit of quantification were included in these reported results. Biomarker data were log2-transformed, and changes from baseline were evaluated using one-sample t tests. OR and corresponding p values were generated to assess the association between biomarker levels (baseline and change from baseline to week 4) and clinical response. In addition, logistic regression modelling was employed to determine the ability of various biomarkers at baseline to predict clinical response at week 14. Prediction models were developed using logistic regression that included no adjustment for age, sex or concomitant medications at baseline. Model accuracy (sensitivity, specificity, negative predictive value (NPV), positive predictive value (PPV)) was estimated using cross-validation. To account for multiple statistical testing, a false discovery rate (FDR) analysis was performed. The FDR analysis was used to define a p value threshold at which the FDR would be approximately 5–10%, and accounted for the fact that the biomarkers were not independent factors, but also had marker-to-marker interactions.
Results
Of the 92 biomarkers that were evaluated in protein profiling, 63 (68%) met the prespecified criteria for inclusion in the data analysis (ie, at least 20% of all samples were above the lower limit of quantification for that analyte). As discussed in further detail below, significant relationships between biomarker levels and clinical response were observed in the following general biomarker categories: acute phase reactants (α-1 antitrypsin, CRP, haptoglobin, serum amyloid P, von Willebrand factor); bone metabolism factors (P1NP, osteocalcin, deoxypyridinoline); coagulation factors (plasminogen activator inhibitor 1); haematological factors (complement 3, ferritin); inflammatory markers (chemokine (C-C motif) ligand 5 (RANTES) (CCL5), epithelial-derived neutrophil-activating protein 78 (ENA-78), IL-6, ICAM-1, macrophage inflammatory protein 1β, MMP-3, tissue inhibitor of metalloproteinases 1 (TIMP-1), TNF receptor II, VEGF); metabolic factors (apolipoprotein C3, leptin); and other markers (insulin, sex hormone-binding globulin, thyroxine-binding globulin). A comparison of the baseline characteristics for patients in the biomarker substudy indicated that the treatment groups were generally well balanced with the exception of mean serum CRP level-, which was numerically, but not statistically (data not shown), lower in the placebo group (1.2 µg/ml) compared with the golimumab 50-mg (1.9 µg/ml) and 100-mg (1.8 µg/ml) groups of the substudy. In addition, the baseline characteristics of the biomarker substudy patients (n=100) were generally consistent with those of the overall GO–RAISE study population (n=356), although there was a higher proportion of Caucasians in the substudy than in the overall population (table 1).
Baseline characteristics of the overall study population and the biomarker substudy population
Changes from baseline in biomarker levels
As an initial evaluation, post-treatment changes in biomarkers were compared between the placebo and golimumab treatment groups. Significantly greater changes from baseline to week 4 in the mean levels of 16 markers were observed in the golimumab groups compared with the placebo group. Log2-transformed values for these markers at baseline and week 4 are shown in figure 1A. Markers with significant changes included acute phase reactants (CRP, haptoglobin, serum amyloid P), complement-related markers (complement 3), haematological factors (ferritin), inflammatory markers (CCL5, ENA-78, ICAM-1, macrophage inflammatory protein 1β, MMP-3, TIMP-1, TNF receptor II), metabolic markers (plasminogen activator inhibitor-1), and other markers (thyroxine-binding globulin, sex hormone-binding globulin, VEGF); see supplementary figure 1, available online only).

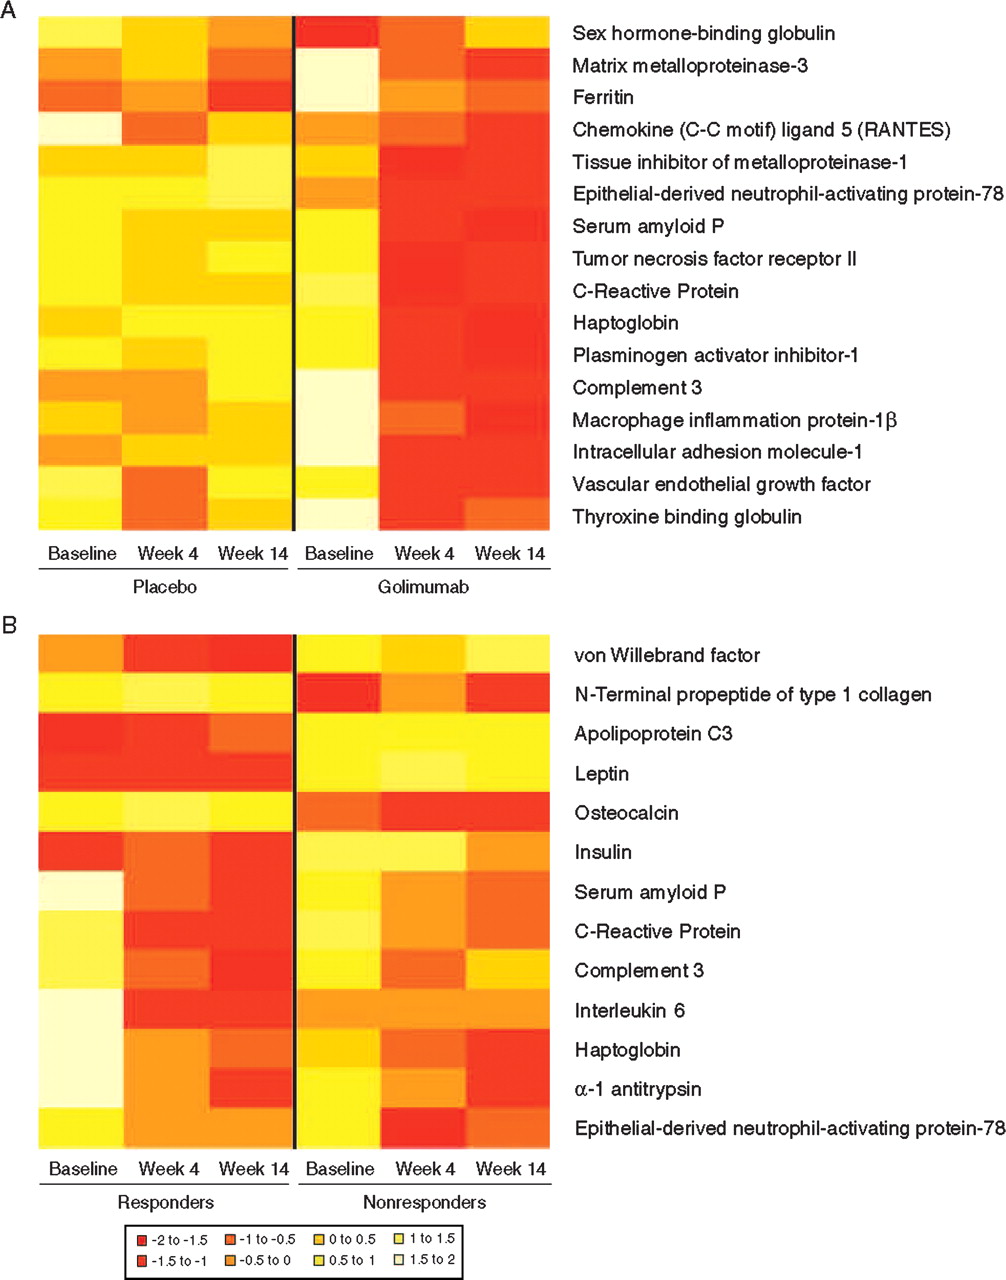
Heatmaps representing biomarker levels at baseline, week 4 or week 14 in the placebo and golimumab groups (A) and for Assessment in Spondyloarthitis International Society response criteria (ASAS 20) responders and non-responders (B). Data were log2-transformed and then scaled to a mean of 0. Negative values (red) are thus below the mean and positive values (white) are above the mean (see figure key).
Differences in biomarker levels between ASAS 20 responders and non-responders
Distinct biomarker profiles were observed for golimumab-treated patients who achieved an ASAS 20 response at week 14 versus those who did not (figure 1B). ASAS 20 responders had lower baseline levels of insulin, von Willebrand factor and the metabolic factors apolipoprotein C3 and leptin than did ASAS 20 non-responders. ASAS 20 responders also had lower levels of these biomarkers at weeks 4 or 14, as well as lower levels of complement 3, the acute phase reactants CRP and serum amyloid P and the inflammatory marker IL-6 compared with ASAS 20 non-responders. In contrast, ASAS 20 responders had elevated levels of the acute phase reactant haptoglobin and the inflammatory marker ENA-78 compared with ASAS 20 non-responders at weeks 4 and 14. Finally, at baseline, week 4 and week 14, ASAS 20 responders had significantly lower levels of the bone metabolism factors P1NP and osteocalcin compared with ASAS 20 non-responders.
Associations between biomarker levels and clinical endpoints in golimumab-treated patients
Associations between baseline serum biomarker levels and the achievement of clinical response were assessed via robust logistic regression analyses. The resulting OR, shown in table 2 for the association between baseline biomarker levels and the achievement of ASAS 20 (yes/no) at week 14 as well as the degree of change in BASDAI or BASFI score from baseline to week 14, indicate significant relationships between baseline biomarkers and measures of clinical improvement. Many of these markers are associated with all three measures of clinical improvement.
OR from robust logistic regression analysis testing the association between biomarker levels (baseline and changes from baseline to week 4) and clinical endpoints (ASAS 20 response at week 14, changes from baseline to week 14 in BASFI score and changes from baseline to week 14 in BASDAI score)
Baseline levels of insulin, the metabolic factors apolipoprotein C3 and leptin, the acute phase reactant haptoglobin, the inflammatory marker IL-6 and the bone metabolism factors osteocalcin, P1NP and deoxypyridinoline were associated with ASAS 20 response at week 14. These same markers, with the exception of IL-6 and the addition of ENA-78, were also associated with the change in BASFI score from baseline to week 14. Baseline levels of the bone metabolism factor deoxypyridinoline were associated with ASAS 20 response at week 14 and the change in BASDAI score from baseline to week 14. Baseline levels of ENA-78, P1NP, osteocalcin and IL-6 were also associated with changes from baseline to week 14 in the BASDAI score (table 2).
Changes from baseline to week 4 in levels of complement 3, the acute phase reactants α-1 antitrypsin, CRP and haptoglobin and the inflammatory marker IL-6 were associated with the achievement of ASAS 20 response at week 14 and also with changes from baseline to week 14 in both BASDAI and BASFI scores (table 2). In addition, changes from baseline to week 4 in thyroxine-binding globulin and serum amyloid P levels were associated with changes from baseline to week 14 in both BASFI and BASDAI scores.
Utility of CRP versus biomarker combinations at baseline to predict clinical improvement at week 14
Using a logistic regression analysis, the best combinations of markers (baseline levels) that were associated with the achievement of ASAS 20 and BASDAI 50 responses at week 14 and a 2 unit or greater improvement from baseline to week 14 in the BASFI score were determined (table 3). Results of similar comparisons employing the change from baseline to week 4 in biomarker levels yielded weaker prediction power (data not shown) than findings based on baseline biomarker data.
Logistic regression model comparing the ability of baseline CRP and baseline biomarker levels for the prediction of clinical improvement at week 14
Baseline levels of P1NP (OR 7.24, p=0.001) and insulin (OR 0.61, p=0.007) were the strongest predictors of ASAS 20 response at week 14, with an NPV of 77% and a PPV of 85%. In comparison, the NPV and PPV of a model using CRP as the sole predictor of ASAS 20 response (OR 1.36, p=0.070) were 56% and 78%, respectively.
The strongest predictors of BASDAI 50 response at week 14 were baseline levels of leptin (OR 0.50, p=0.0004), immunoglobulin M (OR 3.46, p=0.006) and VEGF (OR 2.20, p=0.026). The NPV and PPV of this model were 90% and 65%, respectively, compared with 45% and 66%, respectively, for the model utilising CRP alone (OR 1.08, p=0.609).
Baseline levels of TIMP-1 (OR 28.50, p=0.002) and P1NP (OR 4.10, p=0.007) were the strongest predictors of an improvement in the BASFI score of 2 or greater from baseline to week 14. The NPV and PPV of this model were 85% and 61%, respectively, compared with 54% and 73%, respectively, for the CRP-only model. Of the three efficacy comparisons, BASFI was the only endpoint that had a significant predictive relationship with CRP at baseline (OR 1.47, p=0.017), although this result was less significant than either TIMP-1 or P1NP at baseline.
These analyses indicated that panels of two or three biomarkers were more strongly predictive of the various clinical endpoints in AS than CRP alone. In addition, CRP was not identified as a contributor in the panel of biomarkers identified as predictive of clinical response for any of the endpoints evaluated. The only marker included in the predictive models that was associated with multiple clinical response measures was P1NP.
Discussion
In this biomarker substudy of the GO–RAISE trial, we evaluated 92 serum proteins and have shown that golimumab treatment was effective in modulating certain acute phase reactants (CRP, α-1 antitrypsin, haptoglobin and von Willebrand factor), inflammatory markers (IL-6, CCL5, MMP-3, TNF receptor II, macrophage inflammatory protein 1β, TIMP-1, ICAM-1 and VEGF), and other selected proteins in patients with active AS. In addition, patients who achieved clinical response displayed a distinct serum protein signature compared with non-responders, thus implicating these inflammatory markers in AS pathology. Strong associations were shown between the levels of specific markers (at baseline and also changes from baseline to week 4) and several measures of clinical improvement (ASAS 20, BASDAI and BASFI) at week 14 of golimumab treatment.
Significant OR associations were observed between baseline biomarker levels and the achievement of clinical improvement in several clinical measures at week 14. Strong associations between apolipoprotein C3, deoxypyridinoline, ENA-78, haptoglobin, insulin, IL-6, leptin, P1NP and osteocalcin at baseline and the achievement of at least two of the three clinical parameters (ASAS 20 response, change in BASFI or change in BASDAI) were observed at week 14. Associations between haptoglobin and clinical parameters were observed for both baseline levels (for ASAS 20 and change in BASFI at week 14) and the change in levels from baseline to week 4 (ASAS 20 and changes in BASFI and BASDAI at week 14). While the role of haptoglobin in AS and other inflammatory disorders is not well characterised, haptoglobin was determined in a preliminary study to be overexpressed by more than threefold in patients with AS (n=32) when compared with 32 healthy control subjects.17 Of note, lower baseline levels of leptin, apolipoprotein C3 and insulin were associated with the ASAS 20 response and improvement in BASFI at week 14 in golimumab-treated patients. Other studies have shown inconsistent results regarding associations between serum leptin levels and disease activity in patients with AS.18 19 Although the role of this protein is commonly associated with appetite regulation, serum leptin levels have been shown to correlate with serum IL-6 and CRP levels, suggesting a possible role for leptin in the inflammatory pathogenesis of AS.19 20 In contrast, a recent publication21 reported comparable leptin levels across patients with AS and age- and weight-matched control subjects, with no significant changes in leptin concentrations following anti-TNF treatment.
We observed that higher osteocalcin and P1NP levels at baseline were associated with ASAS 20 response and improvements in BASFI and BASDAI among golimumab-treated patients. Similarly, increased osteocalcin levels and a reduction in the bone resorptive potential of osteoclast precursors has been shown in a small cohort of AS patients (n=10) treated with another TNFα inhibitor.22 Furthermore, it has also been shown that AS patients receiving anti-TNF treatment have increased osteocalcin levels associated with increases in the bone mineral density of the spine and hip.11 P1NP is a more sensitive marker of bone formation and is the propeptide of type 1 collagen. While levels of this marker have not previously been shown in association with clinical improvements in AS, P1NP has been observed to be independently related to osteocalcin levels, which in turn was independently related to the bone mineral density of the lumbar spine and hip in 128 patients with AS.23
We also explored whether individual markers or a combination of markers would significantly predict clinical response to golimumab treatment in these patients with AS. The combination of baseline levels of P1NP and insulin in our model was superior to CRP alone in predicting the ASAS 20 response at week 14 of golimumab treatment. Similarly, the combination of baseline levels of leptin, immunoglobulin M and VEGF was more predictive of BASDAI 50 response at week 14 than CRP, and the combination of TIMP-1 and P1NP was more predictive of a 2 unit or greater change in the BASFI score at week 14. Across these three clinical measures, P1NP and insulin provided the strongest predictive power, with 77% NPV and 85% PPV for ASAS 20 response at week 14. This predictive power is substantially stronger than the results observed for CRP alone (NPV of 56% and PPV of 78%). Although numerous markers were consistently associated with multiple clinical measures, P1NP was the only marker to be identified in predictive models for multiple clinical endpoints (ASAS 20 response and change in BASFI at week 14); however, insulin and leptin were also identified in the logistic regression analysis as significantly associated with ASAS 20 response and change in the BASFI score at week 14. It is not surprising that there is limited overlap in the markers identified in the predictive models due to the differences inherent in the clinical efficacy endpoints assessed in the study. For example, the BASDAI assesses patient-reported outcome and BASFI assesses physical function on a continuous scale, whereas the ASAS 20 response is a measure of AS including patient-reported outcome measures and physical function in a responder index.
Although several of the markers identified in this biomarker substudy are well known in inflammatory diseases and bone remodelling (IL-6, osteocalcin and P1NP), less is known about the pathophysiological role of markers such as leptin and insulin in AS. A number of small studies have indicated comparable insulin levels and insulin sensitivity or resistance indices between patients with AS and matched healthy controls.24,–,27 However, results from another study have indicated beneficial effects of anti-TNF therapy on insulin resistance and insulin sensitivity measures among patients with rheumatoid arthritis or AS and in those patients with the highest tertile of insulin resistance scores.28 The role of insulin in AS and the association with these clinical measures will require additional investigation.
This substudy had several limitations. First, the overall GO–RAISE study was primarily designed to evaluate the effect of golimumab on the signs and symptoms of AS, and the substudy was not powered for a definitive assessment of the associations between biomarker levels and clinical improvement. The reported efficacy measures were chosen to reflect primary or major secondary endpoints in this study, thus comparisons of ASAS 20 with ASAS 40 or other variations of BASDAI or BASFI endpoints were not conducted. In addition, the earliest data collection time point in the study was at week 4, and this time point was evaluated to ascertain if there were early biomarker changes that could reflect later clinical results. Therefore, the effect of biomarker modulation earlier than 4 weeks is unknown, and early changes in biomarkers may reflect their responses to or role as an acute phase reactant. Finally, if it had been collected, RNA profiling from peripheral blood mononuclear cells would have enabled the evaluation of a large number of genes and the inclusion of other key molecules involved in the TNFα inflammatory pathway.29 30
Clinical response to golimumab in patients with AS involves the modulation of several biomarkers, including those involved in the acute and inflammatory phase of disease as well as in the downstream aspects relating to bone and cartilage metabolism and destruction. The results of this substudy showed strong associations between serum biomarkers at baseline and an improvement in several clinical response measures following golimumab treatment. The combination of baseline P1NP and insulin levels was the strongest predictor of an ASAS 20 response at week 14 (77% NPV and 85% PPV); however, with 65% specificity and 90% sensitivity, further studies will be needed to address their potential predictive utility in this clinical setting. While the authors agree that there is merit to an independent confirmation of study findings, the data collected from this study provide a valuable foundation for subsequent biomarker comparisons in this patient population. Insights from this study have suggested new combinations of soluble biomarkers that may play a role in the chronic inflammation of AS.
Acknowledgments
The authors thank the patients, investigators and study personnel who made the GO–RAISE study possible. The authors also thank Mary Whitman, PhD, and Kirsten Schuck of Janssen Biotech, Inc., a wholly owned subsidiary of Johnson & Johnson and Scott Newcomer of Cephalon, Inc, formerly of Janssen Biotech, Inc., who helped prepare the manuscript but did not fulfil the criteria for authorship. The authors also thank Hongtao Fan for his statistical support.
References
Supplementary materials
Web Only Data
Files in this Data Supplement:
Footnotes
↵* Currently of Hoffman-La Roche
-
Funding This study was funded by Centocor Research and Development, Inc. and Schering-Plough Research Institute, Inc. A division of Johnson & Johnson Pharmaceutical Research & Development, LLC.
-
Competing interests JB has received consultancy fees, speaking fees and/or honoraria (less than US$10 000 each) from Centocor, Schering-Plough, Wyeth, Amgen, Abbott, Bristol-Myers Squibb, UCB, Roche, Chugai, Pfizer and MSD. DvdH has received consulting fees and/or research grants from Abbott, Amgen, AstraZeneca, BMS, Centocor, Chugai, Eli-Lilly, GSK, Merck, Novartis, Osuka, Pfizer, Roche, Sanofi-Aventis, Schering-Plough, UCB and Wyeth. AD has received payments for educational lectures, teleconferences and serving on advisory boards for Centocor, a company that may have a commercial interest in the results of this research. This potential conflict of interest has been reviewed and managed by OHSU. ME has nothing to declare. RDI has served as a consultant to Merck, Schering-Plough, Abbott, Sanofi-Aventis, Amgen-Wyeth and Pfizer. MM, BH, SV and CW were all employees of Johnson & Johnson at the time of the study and own Johnson & Johnson stock and/or stock options.
-
Patient consent Obtained.
-
Ethics approval The protocol was reviewed and approved by the institutional review board or independent ethics committee at each site.
-
Provenance and peer review Not commissioned; externally peer reviewed.