Article Text

Abstract
Objectives To determine whether MRI and conventional (clinical and laboratory) measures of inflammation can predict 3-year radiographic changes measured by the van der Heijde Sharp score in patients with early rheumatoid arthritis (RA).
Methods 55 patients with RA with disease duration <1 year participated in this 3-year follow-up study. Patients were evaluated at baseline, 3, 6, 12 and 36 months by swollen and tender joint count, disease activity score based on 28-joint count, erythrocyte sedimentation rate (ESR), C reactive protein, MRI measures of synovitis, bone marrow oedema and tenosynovitis of the dominant wrist, as well as conventional x-rays of the hands and wrists.
Results All measures of inflammation decreased during the follow-up period. ESR, MRI synovitis and MRI bone marrow oedema were independent predictors of 3-year radiographic progression adjusted for age, sex and anti-citrullinated protein antibodies. The 1-year cumulative measures of MRI synovitis and bone marrow oedema provided an improved explanation of variation (adjusted R2) in radiographic change compared with the baseline MRI values (adjusted R2=0.32 and 0.20 vs 0.11 and 0.04, respectively).
Conclusions Both baseline and 1-year cumulative measures of MRI synovitis and bone marrow oedema independently predicted 3-year radiographic progression. These results confirm that MRI synovitis and MRI bone marrow oedema precede radiographic progression in patients with early RA.
Statistics from Altmetric.com
Introduction
Rheumatoid arthritis (RA) is characterised by chronic joint inflammation that often leads to bone destruction. Inflammation in RA causes increased osteoclast-mediated bone turnover leading to erosions and bone loss.1 2 Early intervention with disease-modifying antirheumatic drugs (DMARDs) is considered standard care for patients with RA in order to prevent joint damage and improve patient outcome. However, RA is a heterogeneous and fluctuating disease with bone involvement in two out of three patients.3 Prognostic markers identifying patients with RA at risk of poor disease outcome are therefore needed to individualise treatment strategies at an early stage.
Several prognostic markers of radiographic progression in RA have already been identified. Inflammatory load measured by erythrocyte sedimentation rate (ESR) and C reactive protein (CRP) are examples of such predictors.4 5 However, structural progression occurs even when these measures are normal,6 which suggests that additional and more sensitive predictive tools are needed.
MRI has proved to be a sensitive tool for assessing synovitis as well as bone marrow oedema (osteitis) in early RA.7 In two large studies, MRI bone marrow oedema has been shown to be an independent predictor of radiographic damage.8 9 Furthermore, MRI synovitis has been shown to be associated with subsequent radiographic damage.10 11
In this study we examined whether baseline and 1-year cumulative presence of inflammation in early RA measured by MRI synovitis, MRI bone marrow oedema and MRI tenosynovitis and, in addition, by conventional clinical and laboratory disease activity measures were associated with 3-year radiographic changes measured by the van der Heijde Sharp score (vdHSS). In addition, we determined which of these measures of inflammation could independently predict subsequent radiographic joint damage.
Methods
Patients
An inception cohort of consecutively included patients with early RA has been studied at Diakonhjemmet Hospital. The study design and the baseline and 1-year follow-up data have been reported in detail previously.8 In short, the patients had disease duration of <1 year and fulfilled the American College of Rheumatology classification criteria for RA.12 Study examinations were scheduled at baseline, 3, 6, 12 and 36 months and included clinical assessment with 28-swollen joint count and 28-tender joint count, patient-reported health status by questionnaires, laboratory analyses and imaging procedures (MRI and conventional x-rays). The disease activity score (DAS28) was computed based on the 28-joint counts and ESR.13 Median (IQR) age was 56 (45–64) years, disease duration 92 (69–135) days and 78% were female. The patients received treatment according to clinical practice. The percentages of patients receiving conventional DMARDs at baseline, 12 and 36 months were 81%, 93% and 85%, respectively (methotrexate monotherapy 58%, 65% and 55%, sulfasalazine monotherapy 11%, 11% and 9%, hydroxychloroquine monotherapy 7%, 7% and 7%, and DMARD combination therapy 4%, 7% and 7%). Antitumour necrosis factor α treatment was used by one patient at baseline and 12-month follow-up and by one patient at 36-month follow-up.
Fifty-five of the 84 included patients at baseline completed the 3-year follow-up. Of the 29 persons lost to follow-up, 3 died, 1 developed cancer, 1 did not have RA, 2 moved out of the area and 22 did not want to participate further in the research project. The regional ethics committee approved the study and all enrolled patients gave written informed consent.
Laboratory analyses
ESR was consecutively measured by an in-house Westergren method with a range of 0–140 mm/1st h. Anti-citrullinated protein antibodies (anti-CCP) were analysed by a second-generation ELISA (INOVA Diagnostics, San Diego, California, USA) with a range of 1–251 U/ml and a positive cut-off value of 25 U/ml. IgM rheumatoid factor was measured by an in-house ELISA (Jackson ImmunoResearch, West Grove, Philadelphia, USA) with a range of 2–300 U/ml and a positive cut-off value of 25 U/ml. CRP was measured by high sensitivity CRP nephelometry (Dade Behring, Deerfield, Illinois, USA) with lowest detectable limit 0.15 mg/l.
MRI assessments
MRI of the dominant wrist was obtained at all examinations by a 1.5 T MRI scanner (General Electrics Signa, Milwaukee, Wisconsin, USA) using a dedicated wrist coil. The details of the MRI acquisition and assessments have been described in detail elsewhere.7 Briefly, T1-weighted axial and coronal images before and after contrast injection with Magnevist (Bayer Schering Pharma AG, Berlin, Germany) as well as coronal STIR images were performed at all examinations.
The MR images were read on radiological workstation monitors using a standard picture archiving and communication system (SECTRA IDS5; Linköping, Sweden), in chronological order by a trained reader (EAH) who was blinded to patient information. Assessments were performed by the rheumatoid arthritis magnetic resonance imaging score (RAMRIS), providing a semi-quantitative assessment of synovitis, bone marrow oedema and erosions.14 15 Synovitis was scored from 0 to 3 in the radioulnar, radiocarpal and intercarpal joints with a maximum total score of 9. Bone marrow oedema was assessed at 15 sites (carpal bones, metacarpal bases, distal radius and ulna), each score ranging from 0 to 3 with a maximum total score of 45. Bone erosions were scored at the same 15 sites as bone marrow oedema, ranging from 0 to 10 with a maximum total score of 150. In addition to the RAMRIS scoring, the flexor and extensor tendons were scored for tenosynovitis according to the system proposed by Haavardsholm et al.16 Flexor tendons were assessed at four sites and extensor tendons at six sites, with a score ranging from 0 to 3 and a maximum total tenosynovitis score of 30. The intrareader single measure intraclass correlations for the MRI reader were assessed in another study and were 0.88 for synovitis, 0.96 for MRI erosion, 0.93 for MRI bone marrow oedema and 0.94 for MRI tenosynovitis at baseline.7
Radiographic assessments
Digital conventional x-rays of the hands and wrists in the postero-anterior view were performed at each visit. The digital x-rays were also read on radiological workstation monitors in chronological order and blinded for patient information according to the vdHSS by a trained reader (PB) with an intraobserver single measure intraclass correlation for baseline total vdHSS score of 0.83.17 18 In each hand, 16 joint areas were scored for erosions (score range for each area 0–5) and 15 areas were scored for joint space narrowing (score range 0–4 for each joint area), giving a possible maximum score of 280 units.
Statistical analyses
All statistical analyses were performed using SPSS 14 statistics package (SPSS, Chicago, Illinois, USA). Baseline characteristics were described as median (IQR) values for continuous variables and percentage (number) for counts. Group comparisons were performed by the Mann–Whitney U test and χ2 tests and within-patient changes by the Wilcoxon signed rank test.
RAMRIS synovitis, RAMRIS bone marrow oedema, MRI teno-synovitis as well as joint counts, DAS28, ESR and CRP were independent variables for all regression analyses in this study. These measures of inflammation were further time-integrated by calculating the area under the curve (AUC) of the baseline, 3-, 6- and 12-month measurements. The AUC was estimated based on the trapezoidal rule for each time interval using the following formula:

where t = time, mi = measure of inflammation. One-year time-integrated inflammation measures were further used as independent variables.
The 3-year change in vdHSS showed a parabolic distribution and was normalised with the square root of the 3-year change. This normalised 3-year change in vdHSS was used as the dependent variable in all linear regression models.
Possible associations between the measures of inflammation and radiographic change were explored by linear regression analyses. Independent variables with univariate associations with a p value ≤0.20 were included in multivariate analyses in addition to baseline anti-CCP status (positive vs negative), age and sex. The final multivariate model with independent predictors of 3-year change in vdHSS was obtained by stepwise exclusion of the least significant variable until only significant variables were left. Separate multivariate models were calculated with baseline or time-integrated measures of inflammation as independent variables. In addition, models investigating the independent contributions of RAMRIS synovitis and bone marrow oedema on bone damage were performed.
The robustness of the obtained multivariate models was tested on the total cohort population (n=84). The 3-year change in vdHSS in the 28 patients lost to follow-up (excluding the patient with no RA) was computed by carrying the last observation forward and by linear estimation of change based on the 1-year change in vdHSS.
All tests were two-sided and p values ≤0.05 were considered statistically significant. Standard diagnostic tests of model assumptions and residuals were routinely performed.
Results
Baseline characteristics and measures of inflammation
The baseline characteristics are shown in table S1 in the online supplement. The characteristics of the 55 patients who completed the 3-year follow-up and those who did not complete the 3-year follow-up were similar except for younger age (56 years vs 64 years), shorter disease duration (92 days vs 161 days) and lower ESR levels (12 mm/h vs 22 mm/h) in the patients with 3-year follow-up data. MRI scores of synovitis, tenosynovitis and bone marrow oedema were similar between the completers and non-completers.
Baseline and follow-up measures of inflammation are summarised in table 1. During follow-up the changes in measures of inflammation were small overall but showed a trend towards a decline over time (table 1). The MRI tenosynovitis score was significantly decreased at all time points (p≤0.05). Swollen and tender joint counts, DAS28 and RAMRIS synovitis were significantly lower at 6 and 12 months compared with baseline values (p≤0.05). Significant declines in CRP and RAMRIS bone marrow oedema were seen after 3 and 12 months, respectively.
Measures of inflammation (independent variables) and damage (dependent variables) at baseline, 3-, 6- and 12-month follow-up
Associations between inflammation and 3-year radiographic progression: univariate linear regression analyses
The 3-year mean (SD) and median (IQR) change in joint damage measured by total vdHSS were 3.6 (4.5) and 2 (1–6), respectively; 44 (80%), 31 (56%) and 23 patients (42%) had progression in radiographic joint damage exceeding 0, 1 and 2 vdHSS units, respectively. Possible associations between baseline measures of inflammation and joint damage were investigated by univariate linear regression analyses. As shown in table 2, baseline ESR, RAMRIS synovitis and RAMRIS bone marrow oedema were significantly associated with 3-year change in vdHSS (p<0.05).
Associations between baseline and 1-year time-integrated measures of inflammation and 3-year change in radiographic damage (univariate linear regression analyses)
Univariate associations between the 12-month time-integrated measures of inflammation (AUC) and 3-year radiographic progression are also shown in table 2. The 12-month AUC of ESR, CRP, RAMRIS synovitis and RAMRIS bone marrow oedema were significantly associated with 3-year radiographic progression. Univariate linear regression analyses with baseline and 12-month time-integrated RAMRIS erosion scores as independent variables and 3-year change in vdHSS as the dependent variable had R2 of 0.05 (p=0.10) and 0.08 (p=0.04), respectively.
Measures of inflammation as independent predictors of 3-year radiographic progression: multivariate linear regression analyses
Possible independent predictors of 3-year change in vdHSS were explored in multivariate linear regression models. Baseline RAMRIS synovitis and anti-CCP positivity were independent predictors of 3-year radiographic change (table 3), whereas baseline RAMRIS bone marrow oedema was of borderline significance (table 3). The multivariate models with time-integrated measures of inflammation predicted the 3-year change in vdHSS better than the models with baseline measures (table 3). Increased time-integrated presence of MRI synovitis was found to predict the change in vdHSS to a similar extent to the cumulative presence of MRI bone marrow oedema in multivariate analyses (table 3). Baseline and time-integrated RAMRIS erosion scores were not statistically significant when introduced into the multivariate linear regression models and were not independent predictors of the 3-year change in vdHSS. The results from the multivariate linear regression models are shown as cumulative probability plots in figure 1A–D and images from one patient are shown as an example in figure 2.

Cumulative probability plots showing 3-year radiographic progression of individual patients stratified for high versus low MRI inflammation levels: (A) baseline MRI synovitis levels > median (open circles) and ≤ median (filled circles); (B) baseline MRI bone marrow oedema levels > median (open circles) and ≤ median (filled circles); (C) 1-year time-integrated MRI synovitis > median (open circles) and ≤ median (filled circles); (D) 1-year time-integrated MRI bone marrow oedema > median (open circles) and ≤ median (filled circles). AUC, area under the curve; vdHSS, van der Heijde Sharp score.
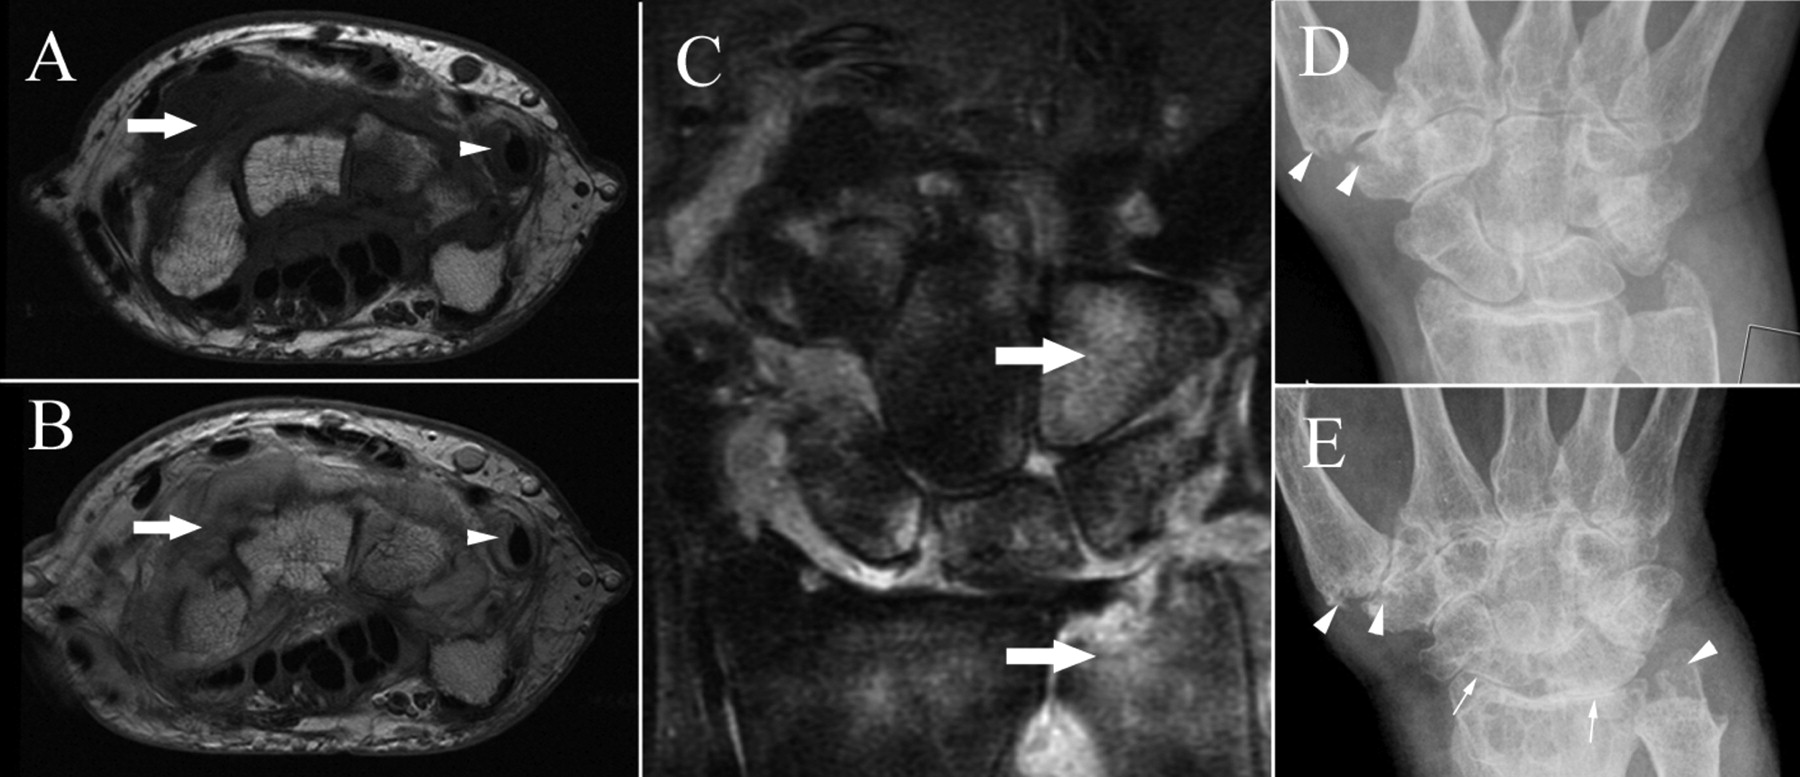
Magnetic resonance images of baseline synovitis and bone marrow oedema in a patient with subsequent erosive progression. MRI and conventional radiographs of the wrist at baseline (A–D) and 3-year follow-up (E). (A) Baseline T1-weighted image before gadolinium administration of the intercarpal space showing synovial hypertrophy (arrow) and thickened sheath of the extensor carpi ulnaris tendon (arrowhead). (B) Baseline T1-weighted image after gadolinium administration showing contrast enhancement of the synovia (arrow) and the sheath of the extensor carpi ulnaris tendon (arrowhead). (C) Baseline coronal STIR image showing bone marrow oedema in the hamate bone and ulnar head (arrows). (D) Baseline conventional radiograph of the wrist showing erosions in the first metacarpal bone and the trapezium (arrowheads). (E) Conventional radiograph of the wrist at 3-year follow-up showing erosions in the first metacarpal bone, the trapezium and the styloid process of the ulna (arrowheads). In addition, the image shows joint space narrowing in the radiocarpal joint (thin arrows).
Final multivariate linear regression models exploring the predictive values of baseline measures of inflammation as independent variables and 1-year time-integrated measures as independent variables
Discussion
In this 3-year follow-up study of patients with early RA we explored the predictive value of baseline and time-integrated clinical, laboratory and MRI measures of inflammation as potential predictors of 3-year radiographic progression. The cumulative presence of MRI synovitis and bone marrow oedema provided a better explanation of the variation in radiological change than the baseline MRI synovitis or bone marrow oedema values, but the baseline synovitis score was also a significant independent predictor. Our findings support the understanding that the cumulative presence of joint inflammation drives bone destruction.10 11 In addition, we show for the first time that the cumulative presence of bone marrow oedema contributes independently to radiographic progression.
A few other studies have compared the predictive value of MRI with other known predictors of radiographic progression, such as anti-CCP and ESR. Haavardsholm et al showed previously in the same cohort that baseline MRI bone marrow oedema independently predicted 1-year change in MRI erosions and radiographic findings whereas anti-CCP and ESR did not.8 Hetland et al also showed in a randomised controlled trial that MRI bone marrow oedema was the only independent predictor of radiographic change in patients with early RA.9 ESR and anti-CCP are other known predictors of radiographic damage in RA.4 5 In this 3-year follow-up study we found that ESR and anti-CCP independently predicted 3-year radiographic change. However, MRI synovitis and bone marrow oedema explained more of the variability in the 3-year change in radiographic damage than ESR and anti-CCP (table 3), which supports the view that MRI synovitis and bone marrow oedema are stronger predictors of radiographic progression than anti-CCP and ESR.
The cumulative impact of MRI-measured inflammation on subsequent joint damage has been examined in a few studies. In a randomised controlled trial of patients with early RA, Conaghan et al found that the cumulative presence of synovitis was significantly correlated with MRI erosive change (correlation coefficient 0.42),10 whereas Ostergaard et al showed that both baseline and 1-year time-integrated MRI synovial membrane measurements were significantly correlated with radiographic progression in patients with established RA.11 These studies support our findings that MRI synovitis predicts subsequent radiographic progression. In addition, we also found that the cumulative presence of MRI bone marrow oedema was an independent predictor of radiographic progression.
Our findings in this study are of relevance for the understanding of the driving pathology of erosive development—synovitis or bone marrow oedema In a histological study of bone from patients with RA, Jimenez-Boj et al showed that inflammatory synovial tissue can disrupt the cortical bone barrier, directly exposing the bone marrow to inflammatory infiltrates. They found that the subchondral bone was lined with osteoclasts as opposed to the endosteum which is lined with osteoblasts. These findings support the notion that erosions start from the outside by synovial inflammation.19 Jimenez-Boj et al also found in a later study that MRI bone marrow oedema corresponded to localised bone marrow inflammatory infiltrates, suggesting that the bone marrow plays an active role in the inflammatory process of RA.20 McQueen et al found that MRI bone marrow oedema was associated with inflammatory cellular infiltrate involving the subchondral bone and proposed that MRI bone marrow oedema is a pre-erosive lesion.21 These studies underline the view that bone marrow oedema can occur separately but often in conjunction with synovitis, and add to the understanding of how both MRI synovitis and bone marrow oedema can be independent predictors of radiographic progression. In this study MRI synovitis was a stronger predictor of bone damage than MRI bone marrow oedema, suggesting that cross-sectional and cumulative presence of synovitis may be a stronger contributor to erosive damage than MRI bone marrow oedema.
In this cohort MRI bone marrow oedema has previously been found to be an independent predictor of 1-year radiographic progression.8 In the present 3-year follow-up study we found that MRI synovitis was a stronger predictor of 3-year radiographic progression than MRI bone marrow oedema, which may be explained by selection bias caused by the 28 patients lost to follow-up. As shown in table 1, the patients who participated in the 3-year follow-up were younger and had lower disease activity than the patients lost to follow-up. In addition, the patients who did not complete the study displayed a trend towards a higher presence of MRI erosions at baseline than those who completed the 3-year follow-up (data not shown). This might lead to decreased external validity, with results only applying to patients with early RA who are younger and with less severe disease. To ensure the validity of the results presented in this paper, we estimated the 3-year radiographic change for the patients lost to follow-up. The prediction models were tested on the whole population and similar results were obtained as in the main analyses shown in table 3 (data not shown). CR and MR images were read chronologically in order to improve statistical power in this limited study population by higher signal-to-noise ratio.18 Chronological image reading may have estimated higher progression rates.
In this longitudinal observational study of early RA we found that MRI synovitis and bone marrow oedema independently predicted bone involvement in early RA, supporting the view that they both contribute to bone damage. We also found that cumulative high measures of inflammation accounted for more subsequent radiographic damage than baseline measures alone. These findings imply that, not only do both MRI synovitis and MRI bone marrow oedema play an independent role in the development of joint damage in patients with early RA but, in addition, there is a dose–response relationship. This finding accentuates the importance of early aggressive treatment of MRI-detected inflammation, with the target of reducing the total load of MRI inflammation over time in order to reduce bone destruction and improve patient outcome.
Acknowledgments
The authors thank research nurse Margareth Sveinsson for collecting clinical data, research coordinator Tone Omreng for organising the data collection and Dr Inge Olsen for statistical advice.
References
Supplementary materials
Web Only Data ard.2009.123950
Files in this Data Supplement:
Footnotes
-
Funding This study was funded by the Eastern Norway Regional Health Authority, the Research Council of Norway, the Norwegian Rheumatism Association, the Norwegian Women Public Health Association, Grethe Harbitz Legacy and Marie and Else Mustad's Legacy.
-
Competing interests None.
-
Ethics approval This study was conducted with the approval of the regional ethic committee, region south-east, Box 1130, Blindern, N-0318 Oslo.
-
Provenance and peer review Not commissioned; externally peer reviewed.