Article Text

Abstract
Objectives To evaluate synovial tissue and serum biomarkers of disease activity, therapeutic response and radiographic progression during biological therapy for rheumatoid arthritis (RA).
Methods Patients with active RA entered a randomised study of anakinra 100 mg/day, administered as monotherapy or in combination with pegsunercept 800 μg/kg twice a week. Arthroscopic synovial tissue biopsies were obtained at baseline and two further time points. Following immunohistochemical staining, selected mediators of RA pathophysiology were quantified using digital image analysis. Selected mediators were also measured in the serum.
Results Twenty-two patients were randomly assigned: 11 received monotherapy and 11 combination therapy. American College of Rheumatology 20, 50 and 70 response rates were 64%, 64% and 46% with combination therapy and 36%, 9% and 0% with monotherapy, respectively. In synovial tissue, T-cell infiltration, vascularity and transforming growth factor beta (TGFβ) expression demonstrated significant utility as biomarkers of disease activity and therapeutic response. In serum, interleukin 6 (IL-6), matrix metalloproteinase (MMP) 1, MMP-3 and tissue inhibitor of metalloproteinase 1 (TIMP-1) were most useful in this regard. An early decrease in serum levels of TIMP-1 was predictive of the later therapeutic outcome. Pretreatment tissue levels of T-cell infiltration and the growth factors vascular endothelial growth factor/TGFβ, and serum levels of IL-6, IL-8, MMP-1, TIMP-1, soluble tumour necrosis factor receptor types I and II and IL-18 correlated with radiographic progression.
Conclusions Synovial tissue analysis identified biomarkers of disease activity, therapeutic response and radiographic progression. Biomarker expression in tissue was independent of the levels measured in the serum.
Statistics from Altmetric.com
Rheumatoid arthritis (RA) is a highly disabling inflammatory arthropathy.1 The advent of targeted therapies offers successful disease control to patients failing conventional disease-modifying antirheumatic drugs (DMARD).2,–,7 The need for disease-centred biomarkers of disease activity, therapeutic response and progressive structural damage has been highlighted.8 9
The quantification of mediators of RA pathophysiology in synovial tissue has been developed through cooperative international collaboration over the past decade.10,–,28 Relationships between tissue signals and disease activity, the effects of therapy and the links between synovial measures and radiographic progression have been evaluated.18 22 28,–,53 Serum levels of several mediators have also correlated with disease activity and radiographic progression.34 53,–,68
The aim of the present study was to evaluate the utility of a panel of 22 selected mediators of RA pathophysiology as synovial tissue and serum biomarkers of disease activity, therapeutic response and structural outcome in RA during a single centre, open-label phase II proof-of-concept study (Synovial Pannus Evaluation and Cytokine-targeted Therapy in Rheumatoid Arthritis; SPECTRA) involving therapy with anakinra either alone or in combination with PEGylated soluble tumour necrosis factor receptor I (sTNF-RI; pegsunercept), for a planned duration of 52 weeks. A secondary aim was to compare tissue expression of selected biomarkers with the levels measured in the serum.
Patients and methods
Patients
Eligible patients had RA for 10 years or less, diagnosed according to the 1987 American College of Rheumatology (ACR) criteria, had nine or more tender joints (of 68), six or more swollen joints (of 66), a clinically inflamed knee and at least two of morning stiffness lasting 45 minutes or longer, C-reactive protein (CRP) level of 1.5 mg/dl or greater and erythrocyte sedimentation rate (ESR) of 28 mm/h or greater.69
Exclusion criteria included previous use of biological therapy, other major chronic inflammatory disease, malignancy or demyelinating disorder, positive tuberculin test, history of tuberculosis infection, or radiograph suggestive of previous tuberculosis, recent infection requiring antibiotics, any uncontrolled medical condition, pregnancy or breast feeding and ACR functional class IV disease.70 Doses of concomitant RA therapies such as non-steroidal anti-inflammatory drugs (NSAID) and oral corticosteroids (≤10 mg/day of prednisolone or equivalent) were stabilised for 4 weeks before screening.
Protocol
Patients were recruited at St Vincent's University Hospital, Dublin. Thirty patients were to be recruited. The protocol received ethics committee approval, and patients gave written informed consent. Patients were randomly assigned to receive self-administered subcutaneous injections of anakinra 100 mg/day, or anakinra 100 mg/day plus pegsunercept 800 μg/kg twice a week. DMARD were discontinued 6 weeks or longer before screening. During the study, NSAID were kept constant, oral corticosteroid therapy could be increased for 2 weeks or less up to twice and up to two intra-articular corticosteroid injections were also permitted.
Clinical and radiographic assessment
ACR responses were assessed at week 4, and the final time point.71 Disease activity scores (DAS28) were also calculated.72 Patients withdrawing from the study were classified as non-responders. Radiographs of hands and feet were obtained at baseline, and at weeks 24 and 52. Damage was quantified by two blinded observers (TR, BB) using van der Heijde-modified Sharp scores.73 Scores were calculated as the means obtained by the two observers. The minimum clinically important change (MCID) over time was calculated as the smallest detectable difference for these observers.74
Synovial tissue acquisition and preparation
Patients underwent arthroscopy of a clinically inflamed knee at baseline. Arthroscopy of the same knee was repeated following 4 and 52 weeks of therapy, or at withdrawal. Details of tissue acquisition, including staining for CD3, CD4, CD8, CD68, factor VIII, vascular endothelial growth factor (VEGF), IL-1α, IL-1β, tumour necrosis factor alpha (TNFα), transforming growth factor beta (TGFβ), matrix metalloproteinase (MMP) 1, MMP-3, tissue inhibitor of metalloproteinase 1 (TIMP-1) and E-selectin, are included in supplementary text file 1 (available online only).
Synovial tissue analysis
For each stained, coded tissue section, a single digital image was acquired as previously described.26 Image processing and analysis were performed using AnalySIS software (Soft Imaging Systems, USA). For each antibody, separate threshold red, green, blue values were specified for total tissue and positive stain. These remained constant throughout the analysis of sections stained for a given marker. For cellular and vascular markers, the percentage of tissue occupied by positive stain was quantified. For CD68 staining, the sublining layer was analysed separately. For markers in which the intensity as well as the quantity of positive stain was of interest, the mean optical density was calculated for the positively stained areas of each image and expressed as a percentage of the maximum possible density. The integrated optical density was calculated as the product of the percentage of tissue occupied by positive stain and the percentage of mean optical density.
Serum biomarkers
Serum IL-1β, soluble IL-1 receptor II, IL-6, soluble IL-6 receptor, IL-8, IL-18, TNFα, sTNF RI, soluble tumour necrosis factor receptor II (sTNF RII), MMP-1, MMP-3, TIMP-1, cartilage oligomeric matrix protein (COMP) and apolipoprotein A1 were measured at baseline, week 4 and at the final time point. Details are provided in supplementary text file 1 (available online only).
Study closure
While recruitment was ongoing, signals from two larger phase III clinical trials evaluating therapy with anakinra plus either etanercept or pegsunercept in RA indicated an increased incidence of serious infection.75 All studies of combination anakinra plus anti-TNFα therapy were therefore suspended. Patients involved in the present study were informed. Final assessments (including biopsy) were obtained, and patients receiving combination therapy were offered targeted monotherapy. Weeks 26 and 52 radiographs were obtained, when possible, from all remaining patients.
Statistical analysis
Cross-sectional differences were evaluated using Mann–Whitney U tests. Proportional differences were evaluated using Fisher's exact tests. The Wilcoxon signed ranks test was employed to examine longitudinal change. Correlations were evaluated using Spearman's rho. For efficacy measures, intent-to-treat analysis was employed. The performance of individual variables as biomarkers of outcome was evaluated using receiver operating characteristic (ROC) curves. Area under the ROC curve (AUROC) values near 1 or 0 indicate good test utility. Using SPSS software (version 11.0), two-tailed significance testing was employed and significance was set as p<0.05.
Results
Patient characteristics
Twenty-two patients were randomly assigned. Baseline characteristics did not differ significantly between the two treatment groups. The median age was 52 years and 18 patients (82%) were women. The median disease duration was 23 months, and 10 patients (46%) had symptoms for less than 1 year. Sixteen patients (73%) were rheumatoid factor positive. Eleven (50%) were DMARD naive, and the median number of previous DMARD:s was one. Patients had moderate to severe RA, and the tender joint counts and swollen joint counts were 20 and 16, respectively. The median patients' and physicians' visual analogue scale scores were 72 and 69, respectively. The median pain visual analogue scale score was 70 and the median health assessment questionnaire score was 1.75. Median ESR and CRP were 50 mm/h and 58 mg/l, respectively. No baseline measures differed significantly between the treatment groups (supplementary table available online only).
Disposition and adverse events
Premature discontinuation was required in four patients (36%) from the monotherapy group and three (27%) from the combination group. All withdrawals were due to active RA, except one, in a patient receiving combination therapy who developed neurological vasculitis during a severe flare of joint disease. No deaths occurred during the study or follow-up. Both therapies were well tolerated overall. Infections (none serious) occurred in 45% and 36% of patients receiving monotherapy and combination therapy, respectively. The corresponding incidences of injection site reaction were 64% and 45%.
At the time of study closure, three patients (one monotherapy, two combination) had completed 52 weeks of treatment, while 12 (six in each treatment group) were receiving active treatment. These were withdrawn at a median of 31 weeks (range 12–47). The median duration of treatment was 30 weeks (range 8–52) in the monotherapy arm and 32 weeks (range 12–52) in the combination arm.
Signs and symptoms
ACR20, ACR50 and ACR70 response rates and ACR core set components are outlined in the supplementary table (available online only). At least an ACR20 final response was achieved by 36% and 64% in the monotherapy and combination groups, respectively. Significantly higher final ACR50 (64% vs 9%, p=0.013) and ACR70 (45% vs 0%, p=0.035) response rates were achieved by patients receiving combination therapy compared with monotherapy. Significant and comparable improvements in individual ACR components were seen with both treatment regimens.
Radiographic progression
Fifty-two week radiographs of the hands and feet were obtained from 15 patients. Sharp score data are presented in the supplementary table (available online only). The MCID for progression in total, erosion and narrowing scores were 4.0, 3.0 and 5.0, respectively. In the total group, a median increase in total Sharp score of 2.0 (interquartile range 0.5–8.0) units (p=0.002) was observed at 12 months. At the 6 and 12-month time points, 33% and 40% of patients, respectively, demonstrated progression exceeding the MCID.
Biomarker levels and the therapeutic response
Table 1 outlines tissue biomarker levels in the total group and according to ACR response. CD3 T-cell infiltration decreased significantly following clinical improvement, discriminating responders (≥ACR20) from non-responders. Neither total tissue nor sublining layer CD68 cell infiltration reflected the therapeutic response at either time point. Tissue TGFβ levels demonstrated high responsiveness to therapy, while IL-1α discriminated ACR20 responders from non-responders at the final time point only.
Changes following therapy in synovial tissue biomarkers according to clinical response and treatment group
Table 2 presents serum biomarker levels during the study. As expected, serum levels of several biomarkers, most notably IL-6, MMP-1, MMP-3 and TIMP-1, correlated with acute phase measures and disease activity scores (supplementary table available online only). Serum levels of the same four biomarkers changed significantly after treatment in responders. Unexpectedly, serum TNFα increased following therapy in proportion to the clinical response. Although this effect was most pronounced in patients receiving pegsunercept, it was also observed in anakinra-treated subjects. COMP levels did not change at 4 weeks, but interestingly, at the final time point, remained unchanged in the ACR20 and ACR50 response groups, fell in ACR70 responders (median change −37.0%, p<0.05) and increased in non-responders (median change +28.9%, p<0.05).
Changes in serum biomarkers according to clinical response and treatment group
Predictors of clinical outcome
Of the panel of 17 tissue biomarkers at baseline, only MMP-3 demonstrated significant predictive value for ACR20, ACR50 and ACR70 responses (AUROC 0.78, 0.89, 0.90, respectively, p<0.05 for all). No other tissue measures demonstrated prognostic utility in this respect (data not shown).
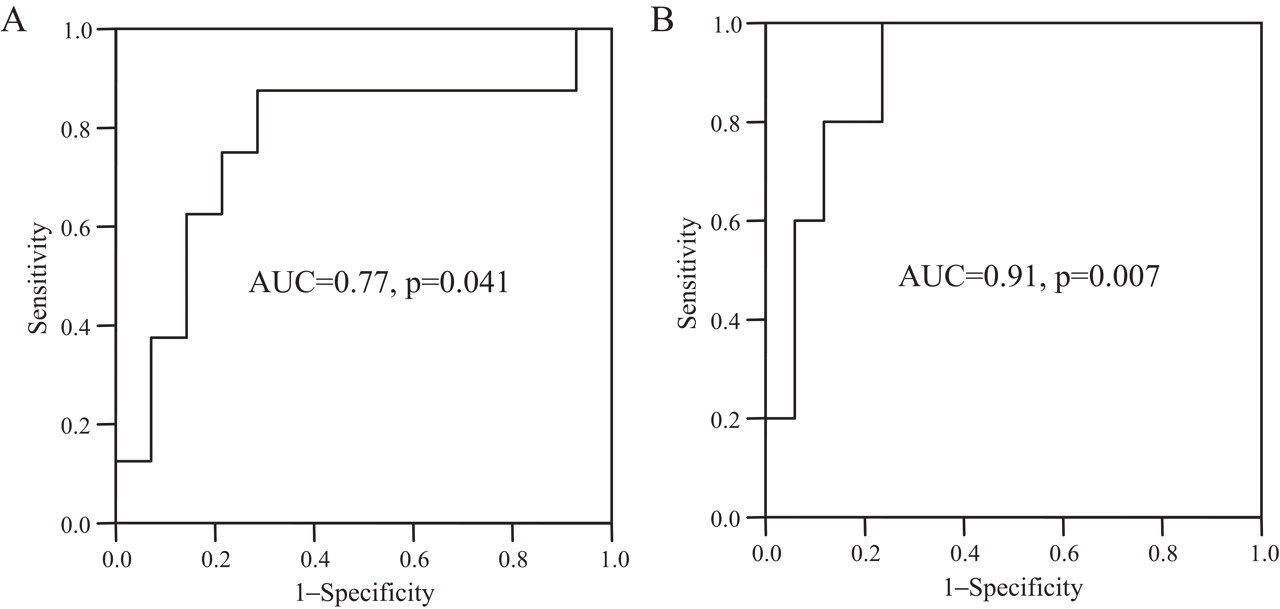
ROC curves were also constructed using 4-week percentage changes in serum biomarkers and ACR core set components as test variables for the final ACR response. The percentage decrease in TIMP-1 at 4 weeks predicted the final ACR20 (AUROC 0.72, p<0.05), as well as for ACR50 and ACR70 responses (figure 1). When a comparison with ACR components was made, only changes in the tender and swollen joint counts and health assessment questionnaire scores were of prognostic value, and none demonstrated the consistent predictive value for all levels of ACR response exhibited by TIMP-1 (data not shown). Early changes in ESR or CRP were not useful predictors of response.
Receiver operating characteristic (ROC) curves for percentage change in serum tissue inhibitor of metalloproteinase 1 levels after 4 weeks of therapy as a predictor of final (A) American College of Rheumatology (ACR) 50 and (B) ACR70 therapeutic response. AUC, area under the ROC curve.
Biomarker levels and structural damage
Baseline variables correlating with radiographic progression are presented in table 3. Variables demonstrating utility as tests for significant progressive damage using ROC curve analysis are highlighted. Predictably, high extrapolated annual progression before the study was associated with adverse radiographic outcomes. Baseline Sharp scores, however, did not predict radiographic progression at 1 year. Also as expected, highly elevated baseline ESR and CRP were associated with aggressive damage progression. Baseline CRP demonstrated the strongest relationship of any biomarker with erosive progression at 12 months, with strong linear correlation (r=0.78, p=0.001) and an AUROC of 0.89 (p=0.026).
Baseline predictors of progressive structural damage
Numerous of the panel of pathophysiological biomarkers demonstrated utility as baseline predictors of structural outcome. In tissue, the expression of CD3 and CD8 T cells and the growth factors VEGF and TGFβ all correlated significantly with progression at 6 and 12 months. VEGF also demonstrated predictive utility in ROC curve analysis. Only VEGF correlated with progressive joint space narrowing, whereas T-cell infiltration and TGFβ represented significant predictors of erosive change.
In serum, baseline levels of the proinflammatory cytokines IL-6 and IL-8 correlated with progression scores. Surprisingly, a consistent and significant inverse relationship was observed between baseline IL-18 and worsening damage. Baseline serum levels of two elements of the metalloproteinase network, MMP-1 and TIMP-1, reflected subsequent joint destruction. MMP-1 exhibited the strongest correlation of any biomarker with change in total Sharp score at 1 year (r=0.67, p=0.006) and correlated with 12-month erosive progression with a strength similar to CRP (r=0.78, p=0.001). Baseline TIMP-1 also correlated with progressive total Sharp score and erosive damage.
The limited sample size precluded the use of regression analysis to explore these univariate signals further. Importantly, neither absolute nor relative changes in any of the panel of biomarkers correlated significantly with longitudinal changes in modified Sharp scores at any combination of time points (data not shown).
Overall biomarker performance characteristics
The performances of the mediators evaluated in the present study as biomarkers of disease activity, the response to targeted therapy and radiographic progression are summarised in table 4.
Summarised biomarker performance characteristics
Discussion
This study evaluated the utility of 22 pathophysiological mediators of RA, as synovial tissue and serum biomarkers of disease activity during cytokine blockade. In tissue, T-cell infiltration, vascularity and TGFβ expression demonstrated significant utility as biomarkers of disease activity and the therapeutic response. In serum, IL-6, MMP-1, MMP-3 and TIMP-1 were most useful in this regard. An early decrease in serum levels of TIMP-1 was predictive of the later therapeutic outcome. Pretreatment tissue levels of T-cell infiltration and the growth factors VEGF/TGFβ and serum levels of IL-6, IL-8, MMP-1, TIMP-1, sTNF RI, sTNF RII and IL-18 correlated with subsequent radiographic progression.
Synovial tissue measures have been evaluated as biomarkers of therapeutic response in previous studies, employing varying designs.10 18 22 23 25 28 32 41 44 45 Sublining CD68 cell infiltration has recently been proposed as a suitable candidate.25 28 30 33 40 44 Including the present study, however, two centres have now failed to identify significant change in sublining CD68 signals following clinically efficacious therapy.32 In those studies, T-cell infiltration demonstrated superior utility. These centres quantify CD68 macrophage infiltration as a percentage of total (or sublining) tissue. Conversely, others quantify individual cells stained positively per tissue area.18 Multicentre studies are under way aimed at clarifying these issues.
In line with the findings of the present study, serum IL-6, MMP-1, MMP-3 and TIMP-1 levels have reflected disease activity in a number of previous studies.34 55,–,65 Interestingly, in the present study, clinically effective therapy was associated with marked increases from baseline in serum TNFα levels. This effect was most pronounced in patients receiving combination therapy. It is likely that this observation reflects a specific effect of pegsunercept, which binds circulating TNFα.76 77
A further novel feature of the present study was the observation that early decreases in serum TIMP-1 predicted later therapeutic responses. Early post-treatment changes in conventional acute phase markers were not useful in this regard. Early TIMP-1 suppression was superior in consistency to any other single measure, including the components of the ACR core set, as a predictor of sustained clinical efficacy. Few studies have examined the use of serum biomarkers to predict clinical response to therapy; to date, only modest predictive signals have been observed for IL-6 and MMP-3.56 61
Baseline T-cell infiltration was predictive of subsequent erosive progression during the present and earlier studies.46 50 As in the present study, intense early sublining CD68 infiltration was also associated with adverse subsequent structural outcomes in one of these.46 This reflects the biology of T cells and macrophages in rheumatoid synovium, as both promote osteoclastogenesis.78 79 Synovial vascularity and the growth factors VEGF/TGFβ also predicted radiographic progression. The importance of these aspects of synovial tissue pathophysiology has been highlighted in previous studies.80,–,82 It is interesting that while TGFβ was related to erosive change, VEGF was associated with progressive joint space narrowing. This may reflect differing mechanisms underlying cartilage loss and bone erosion in RA.78
A number of baseline serum measures predicted radiographic progression. As expected, these included ESR and CRP.83 This is the first study to demonstrate significant correlations between serum IL-6, TIMP-1 and joint damage.60 IL-6 and TIMP-1 levels correlated with ESR, CRP and with one another during the present study (data not shown) and in previous studies of RA.53 55 60 61 64 84 85 It is therefore perhaps unsurprising that their baseline levels correlated with erosive progression. Alternatively, IL-6 is osteoclastogenic in vitro, while the metalloproteinase network plays a pivotal role in joint destruction in RA.78 86 Baseline IL-8 levels also correlated with progression. Again, no previous study has described this signal, although IL-8 has paralleled radiographic progression in longitudinal analysis previously.87 IL-8 is a chemokine, predominantly produced by activated macrophages in RA, which may also promote osteoclastogenesis by a variety of pathways.78 Baseline sTNF RI and sTNF RII levels also correlated with erosive progression. The utility of these receptors as serum biomarkers of radiographic outcome has never been described. It is possible that high levels of these circulating receptors may reflect high systemic TNFα expression and hence joint erosion in RA.
One biomarker, IL-18, was associated with progressive joint space narrowing during the study. Surprisingly, high baseline IL-18 levels were associated with low levels of progression. The actions of this complex cytokine are generally considered proinflammatory and therapies neutralising its activity produce joint protection in animal models.36 However, numerous studies have highlighted its pleiotropic nature. The significance of this apparently counterintuitive finding therefore remains unclear.88,–,90
This study contains several important limitations, principally small size and early termination. As a result of the early closure, few patients completed 52 weeks of therapy and final assessments were performed at different time points. Given the small sample size and large number of statistical tests, a number of the findings may be false positive. Regression analysis could not be employed to determine whether univariate relationships between biomarkers and outcome were independent. In addition, the study did not include an anti-TNF monotherapy arm, and neither study drug is now used commonly in clinical practice.
These observations are intended as hypothesis generating, and clearly would require validation in larger cohorts. Nonetheless, they illustrate the potential utility of disease-centred biomarkers in RA. The study also highlights differences in biomarker utility that are dependent on the site of biomarker expression. The identification of reliable biomarkers of disease activity, therapeutic response and radiographic progression represents a highly attractive clinical goal.91 Following sufficient validation, biomarkers might provide early signals predicting important patient-centred outcomes. Such biomarkers could eventually be considered surrogate endpoints, facilitating therapeutic decision-making and efficient screening of novel therapies.
Acknowledgments
The authors would like to thank Laura Greenan, Martina Gogarty, Evelyn Murphy and Ann Madigan for laboratory advice and assistance and for data collection.
References
Supplementary materials
Web Only Data ard.2009.108324
Files in this Data Supplement:
Footnotes
-
Funding This study was supported by research grants from Amgen, Inc.
-
Competing interests None.
-
Patient consent Obtained.
-
Ethics approval This study was conducted with the approval of the St Vincent's University Hospital Ethics Committee.
-
Provenance and peer review Not commissioned; externally peer reviewed.