Article Text

Abstract
OBJECTIVE To test the hypothesis that ankylosing spondylitis (AS) is a T helper cell type 2 polarised disease by quantifying the T cell cytokines interferon γ (IFNγ), interleukin 4 (IL4), tumour necrosis factor α (TNFα), and IL10 at the single cell level in patients with AS in comparison with healthy HLA-B27 negative and HLA-B27 positive controls.
METHODS Peripheral blood mononuclear cells from 65 subjects (25 HLA-B27 positive patients with active AS, 18 healthy HLA-B27 positive controls, and 22 healthy HLA-B27 negative controls) were stimulated with phorbol myristate acetate/ionomycin for six hours, surface stained for CD3 and CD8, intracellularly stained for the cytokines IFNγ, TNFα, IL4, and IL10, and analysed by flow cytometry. TNFα production was related to the genotype of the TNFα promoter at the -308 and -238 polymorphisms.
RESULTS In peripheral blood the percentage of TNFα+ T cells was significantly lower in HLA-B27 positive patients with AS (median 5.1% for CD4+ T cells) than in healthy HLA-B27 negative controls (median 9.5%; p=0.008). Surprisingly, the percentage of TNFα+ T cells was also significantly lower in healthy HLA-B27 positive controls (median 7.48%) than in healthy HLA-B27 negative controls (p=0.034). Furthermore, the percentage of IFNγ+ T cells was lower in patients with AS and in healthy HLA-B27 positive controls than in healthy HLA-B27 negative controls (p=0.005 and p=0.003, respectively). The percentage of IL10+/CD8+ T cells was higher in patients with AS than in both control groups. In HLA-B27 positive subjects, TNF1/2 heterozygosity at -308 (n=6) was associated with a higher percentage of TNFα+ T cells than TNF1/1 homozygosity (n=25; median 9.97%v 5.11% for CD4+ T cells; p=0.017). In contrast, in HLA-B27 negative controls (n=18) there was no such genotype/phenotype correlation (median 9.4%v 10.6%).
CONCLUSIONS The lower T cell production of TNFα and IFNγ shown at the single cell level in HLA-B27 positive patients with AS and healthy HLA-B27 positive controls may contribute to the increased susceptibility of HLA-B27 positive subjects to develop AS. Preliminary genotype-phenotype correlations suggest that in HLA-B27 positive subjects TNF2 at -308 or a linked gene results in higher TNFα production and, therefore, might be a marker for a protective haplotype.
- ankylosing spondylitis
- cytokines
- tumour necrosis factor
- polymorphism
Statistics from Altmetric.com
Ankylosing spondylitis (AS) and reactive arthritis (ReA) belong to the group of spondyloarthropathies which comprise a spectrum of diseases characterised by shared clinical features and a variably strong association with HLA-B27.1 In time, 20–40% of HLA-B27 positive patients with ReA develop the full picture of AS.
ReA is induced by several intracellular bacteria and remnants of bacteria or even live bacteria can be found in the joint, suggesting incomplete killing of bacteria.1-3 In previous studies on patients with ReA we described a T helper (Th) 2 biased cytokine pattern with the presence of interleukin (IL) 4 and IL10 and relatively little tumour necrosis factor α (TNFα) and interferon γ (IFNγ).4 ,5 Another study also suggested a Th2 polarised cytokine pattern in spondyloarthropathies.6 Moreover, a prospective study on ReA showed that patients with lower TNFα levels at disease onset were more likely to run a chronic course than patients with ReA who had higher TNFα levels at onset, an effect that was independent of HLA-B27.7 TNFα and IFNγ are important cytokines in defence of a range of infections, with IFNγ mainly produced by T cells and TNFα by macrophages but also by T lymphocytes.8 ,9
In contrast with ReA, a pathogenic role of bacteria in AS is less clear and little is known about cytokines in AS.3 ,6 Because ReA and AS are related clinical conditions we sought to assess whether the T cell cytokine pattern in AS might also be polarised towards a Th2-like pattern. Moreover, we tried to relate TNFα production to genetic polymorphisms within the TNFα promoter region as there is a clear genetic component in the secretion of cytokines in that 60% of the variation of TNFα production is genetically determined.10 AS itself is characterised by a strong genetic predisposition, with HLA-B27 contributing only 16–50% to the overall genetic component.11 Because of the strong association of AS with HLA-B27 both healthy HLA-B27 positive and healthy HLA-B27 negative subjects were included as controls in this study.
Patients and methods
Table 1 shows the characteristics of the 25 patients with AS (all HLA-B27 positive), 18 HLA-B27 positive and 22 HLA-B27 negative healthy controls. AS was diagnosed according to the 1984 modified New York criteria.12 All patients had clinically active disease and at least slightly raised C reactive protein levels (>60 mg/l). Patients were treated with non-steroidal anti-inflammatory drugs only. The healthy controls were blood donors whose health status had been assessed in a recent study.13
Clinical characteristics of patients with ankylosing spondylitis and controls
HLA TYPING
HLA typing was done by conventional lymphocytotoxicity assays.
INTRACELLULAR CYTOKINE STAINING OF PERIPHERAL BLOOD T CELLS AND ANALYSIS BY FLOW CYTOMETRY
Peripheral blood mononuclear cells (PBMC) were separated by Ficoll-Paque (Pharmacia, Uppsala, Sweden) and frozen in liquid nitrogen until used. Intracellular cytokines were stained, and cytokine positive T cells were quantified by flow cytometry (Becton Dickinson, CA) as described previously.14 Briefly, PBMC were thawed and 1 × 10⁶ cells were cultured for six hours in the presence of 5 ng/ml phorbol 12-myristate 13-acetate (PMA); (Sigma, St Louis, MO) and 1 ng/ml ionomycin (Sigma, St Louis, MO), with 2.5 μM monensin (Sigma, St Louis, MO) added during the last two hours. The cells were then fixed, stained with antibodies directed against cytokines and against the T cell surface markers CD3 and CD8, and subsequently analysed by flow cytometry.
Because stimulation with PMA/ionomycin reduces CD4 expression on the cell surface CD4+ T cells were identified indirectly by gating on CD3+ but CD8− lymphocytes. For quadruple staining, cells were incubated with PerCP labelled anti-CD3 (Becton Dickinson, San Diego, CA), cy5 labelled anti-CD8 (Amersham, Braunschweig, Germany), PE labelled antihuman IL4 monoclonal antibodies (mAb), and FITC labelled antihuman IFNγ mAb or PE labelled antihuman IL10 mAb and FITC labelled antihuman TNFα mAb (Pharmingen, San Diego, CA). After gating either on CD3+/CD8+ or CD3+/CD8− (CD4) lymphocytes, data were analysed with CELLQuest software and displayed as dot plots of FITC (x axis) and PE (y axis) fluorescence (four decade log scales). Quadrant markers were positioned to include >99% of control immunoglobulin staining cells in the lower left quadrant.
VARIATION OF RESULTS DUE TO LABORATORY HANDLING
To assess the variation of results (that is, percentage of cytokine positive T cells) due to both laboratory handling of the sample and variation of FACS measurement (intra-assay variation), a single blood sample from three subjects was processed and analysed for TNFα positive T cells on three different days. The laboratory handling includes the procedure of thawing cells, stimulation with PMA/ionomycin, staining with monoclonal antibodies against cell surface markers and against intracellularly localised cytokines, and the subsequent FACS analysis.
The analysis of variance of the nine measurements gave a standard deviation for TNFα of 0.55 and the estimated coefficient of variation was 8.3%. Of note, no interchanging of ranks was seen between the low, intermediate, and high producers. This estimated coefficient of variation of 8.3% compares well with that reported for TNFα (7.5%) and IL10 (12.3%) using an enzyme linked immunosorbent assay (ELISA) of whole blood stimulation.15
GENOTYPING
Genotyping was done as described before16 using an amplification refractory mutation system polymerase chain reaction (PCR) design with slight modifications of the primer sequences. The primers used were for TNF-308 5′-GCCCCTCCCAGTTCTAGTTCTATC-3′, 5′-AAGCGGTAGTGGGCCCTGCACCT T-3′, 5′-GGCAATAGGTTTTGAGGGGCTT G-3′, 5′ACCCTGGAGGCTGAACCCCGAC CC-3′ and for TNF-238 5′-GCCCCTCCC AGTTCTAGTTCTATC-3′, 5′-CCGGATCA TGCTTTCAGTGC-3′, 5′-AGACCCCCCT CGGATTCG-3′, 5′-CACACTCCCCATCCT CCCTGGTCT-3′. In contrast with our previous protocol16 the PCR products obtained using the modified primers now assign the larger fragment to the rare TNF2 allele and the smaller fragment to the TNF1 allele.
STATISTICS
To compare groups we chose a non-parametric test (Mann-Whitney U test) as the size of the groups studied did not allow the assumption of a normal distribution. The median of percentage of cytokine positive cells rather than the mean is given to compensate for the more extreme values. The non-parametric statistics were calculated using the SPSS version 8.0 computer program. To assess variation due to laboratory handling, which includes the intra-assay variation, analysis of variance with repeated measurements was performed. The coefficient of variation was estimated from the standard deviation and the mean.
Results
CYTOKINES IN AS, IN HLA-B27 POSITIVE CONTROLS, AND IN HLA-B27 NEGATIVE CONTROLS
Preliminary experiments without stimulation with PMA/ionomycin did not show significant percentages of cytokine positive T cells (<0.1% compared with isotype control; data not shown). Thus T cells were stimulated with PMA/ionomycin in all experiments. The CD4/CD8 T cell ratio was similar in all groups (data not shown).
The percentage of TNFα positive T cells from patients with AS but also from healthy HLA-B27 positive controls was substantially lower compared with healthy HLA-B27 negative controls. The median of TNFα positive CD4+ cells was 5.11% among patients with AS compared with the median of 9.5% among healthy B27 negative controls (p=0.008). The median among healthy B27 positive controls (7.48%) was also significantly decreased compared with HLA-B27 negative controls (p=0.034) and was non-significantly increased compared with HLA-B27 positive patients with AS (fig 1A). Similarly, there were significantly fewer TNFα positive CD8+ T cells in patients with AS (median 2.65%) and HLA-B27 positive controls (median 4.08%) compared with healthy B27 negatives (7.32%; p=0.0003 and p=0.012) (fig 1B).

Percentage of tumour necrosis factor α (TNFα) positive CD4+ (A) and CD8+ (B) T cells among patients with AS (all HLA-B27 positive), healthy HLA-B27 positive controls, and healthy HLA-B27 negative controls. The horizontal bars indicate the medians.
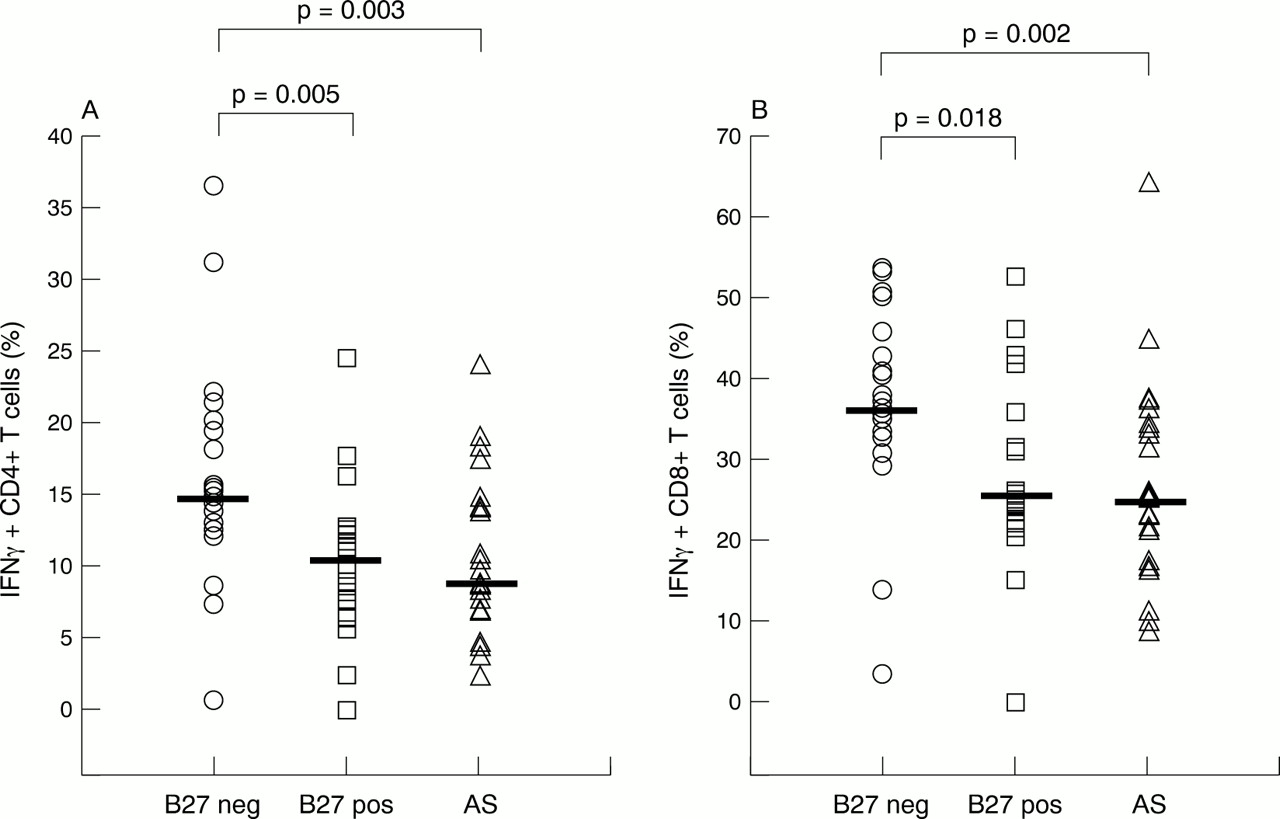
Another major finding was a decreased percentage of IFNγ positive CD4+ and CD8+ T cells in patients with AS and healthy HLA-B27 positive controls compared with HLA-B27 negative controls. For the CD4 subset the median was 8.73% in patients with AS, 10.57% in healthy B27 positive controls v a median of 14.76% in B27 negative controls (p=0.003 and p=0.005, respectively) (fig 2A). For the CD8 subsets the median was 24.87% in patients with AS, and 25.55% in healthy B27 positive controls v median 36.44% in B27 negative controls (p=0.002 and p=0.018, respectively; fig 2B).

Percentage of interferon γ (IFNγ) positive CD4+ (A) and CD8+ (B) T cells among patients with AS (all HLA-B27 positive), healthy HLA-B27 positive controls, and healthy HLA-B27 negative controls. The horizontal bars indicate the medians.
The medians (%) of IL4 positive cells and IL10 positive cells were similar for all groups (data not shown) with the exception of IL10 production of CD8+ T cells which was significantly higher in patients with AS (median 0.81%) than in both healthy HLA-B27 positive controls (median 0.29%; p<0.001) and healthy HLA-B27 negative controls (median 0.39%; p=0.012; fig3).

Percentage of interleukin 10 (IL10) positive CD8+ T cells among patients with AS (all HLA-B27 positive), healthy HLA-B27 positive controls, and healthy HLA-B27 negative controls. The horizontal bars indicate the medians.
To quantify further the level of cytokine secretion per cell, the mean fluorescence intensity (MFI) of cytokine positive cells was compared in patients with AS and controls. The MFI of cytokine positive cells (for example, anti-TNFα positive cells) was divided by the MFI of cytokine negative cells (for example, anti-TNFα negative cells clustered in the lower left of the dot blot) in order to normalise the level of MFI for cytokine secretion. This normalisation process enables comparison of individual experiments. No clear difference in the intensity of fluorescence staining was found between the groups (data not shown). Thus the percentage of cytokine positive cells correlates with the overall cytokine production.
TNFα PRODUCTION IN RELATION TO TNF-308 PROMOTER GENE POLYMORPHISM
DNA for genotyping was available from 49 subjects whose PBMC were intracellularly stained for TNFα previously. The rare TNF2 allele bearing an A at -308 was detected in 2/16 patients with AS, 4/15 healthy B27 positive controls, and 3/18 healthy B27 negative controls. One person (B27 negative) was TNF2 homozygous.
Among HLA-B27 negative controls no difference in the percentage of TNFα positive T cells between TNF1/1 homozygotes and TNF1/2 heteroyzgotes could be detected (median 9.44%v median 10.57% for the CD4+ subset; median 7.32% v median 7.46% for the CD8+ subset; fig 4). In contrast, among HLA-B27 positive controls the production of TNFα was high in the two patients with AS and in the four healthy HLA-B27 positive controls who were TNF1/2 heterozygous compared with TNF1/1 homozygotes. As the number of TNF1/2 heterozygotes was small in each group the difference between TNF1/2 heterozygotes and TNF1/1 homozygotes became significant only if healthy HLA-B27 positive controls and patients with AS were analysed together as shown in fig 4(TNF1/1 homozygotes (n=25) compared with TNF1/2 heterozygotes (n=6): median 5.11% v median 9.97% for CD4+, p=0.016; median 2.60% v median 5.86% for CD8+, p=0.014). The combined analysis of healthy HLA-B27 positive controls and patients with AS seems to be justified as there was no substantial difference among TNF1/1 homozygotes (fig 5) and TNF1/2 heterozygotes beween the two groups.

Percentage of tumour necrosis factor α (TNFα) positive CD4+ (A) and CD8+ (B) T cells in relation to genotypes at TNF-308 (TNF1/1 and TNF1/2) among HLA-B27 positive subjects (patients with AS and healthy HLA-B27 positive controls combined) and healthy HLA-B27 negative controls. TNF genotypes were available for 49 subjects. The horizontal bars indicate the medians.

Percentage of tumour necrosis factor α (TNFα) positive CD4+ (A) and CD8+ (B) T cells among TNF1/1 homozygous patients with AS (n=14), healthy HLA-B27 positive controls (n=11), and healthy HLA-B27 negative controls (n=15). The horizontal bars indicate the medians.
When TNF1/1 homozygous subjects only were considered, the difference in TNFα positive T cells between patients with AS and healthy HLA-B27 negative controls was similar to that without stratification on TNF-308 genotypes (p=0.006 for CD4+; p=0.0001 for CD8+). The difference between healthy HLA-B27 positive controls and negative controls was slightly larger for the CD4+ (p=0.014) than for the CD8+ subset (p=0.037; fig 5).
When only TNF1/2 heterozygous subjects were compared no significant difference in the percentage of TNF positive lymphocytes between B27 positive (n=6) and B27 negative controls (n=4) was seen (fig 4).
TNF-238 POLYMORPHISM
Only 1/16 patients with AS, 1/15 healthy HLA-B27 positive controls, and 2/18 HLA-B27 negative controls were heterozygous (G/A) for the TNF-238 polymorphism (the rare allele bearing an A compared with a G in the common allele), none was homozygous for the rare allele. None of the four subjects heterozygous at -238 was also heterozygous at -308 (TNF1/2). Because of the small number of heterozygotes at -238 a conclusive analysis of TNFα production in relation to genotypes at -238 was not possible (data not shown).
Discussion
T cells exert many of their functions by secretion of cytokines. In this study we quantified the production of T cell cytokines at the single cell level in patients with AS and compared it with that of HLA-B27 positive and negative controls. To assess T cell cytokine production we chose flow cytometry of intracellularly stained cytokines. This method is highly sensitive and specific and allows determination of cytokine production at the single cell level.14 ,17 Furthermore, by using appropriate cell surface markers the cytokine producing cell type can be unequivocally determined. In patients with AS the T cell production of IFNγ and TNFα was on average significantly decreased, whereas the T cell production of the Th2 cytokine IL4 did not differ between patients with AS, HLA-B27 positive controls, and HLA-B27 negative controls. Thus AS can be regarded as a low TNFα/IFNγ disease rather than a typical Th2 -type disease characterised by the predominance of IL4 positive T cells.
A surprising result in our study was that healthy HLA-B27 positive controls also produced less IFNγ and TNFα than patients with AS. Therefore, it seems that HLA-B27 is associated with low IFNγ and TNFα production by T cells and, furthermore, that low TNFα and IFNγ production by T cells in AS may not be secondary to disease status but may have a primary role. We can confidently exclude any underlying inflammatory joint disease in the healthy B27 positive controls as their health status had been thoroughly assessed in a recent study.13 From these data the question arises whether low T cell production of IFNγ and TNFα is a further risk factor for HLA-B27 positive subjects for the development of AS.
The wide variation of IFNγ and TNFα producing T cells among all groups in our study confirms the finding of others.15 This variation has two important implications. Firstly, TNFα and IFNγ production is only moderately associated with the HLA-B27 status and must be determined by other factors as well. Secondly, the development of AS in HLA-B27 positive subjects cannot be explained merely by low TNFα and/or IFNγ production. Rather, a complex series of genetic and environmetal factors are likely to interact in the pathogenesis of AS.11 The fact that healthy HLA-B27 positive subjects who are low TNFα and IFNγ producers and patients with AS who are high TNFα and IFNγ producers were identified emphasises the contribution of other protective and susceptibility factors. None the less, low T cell production of TNFα and IFNγ may be an additional risk factor for AS.
Because TNFα production is under strong genetic control we next asked whether TNFα production correlates with TNFα promoter gene polymorphisms. The rare allele TNF2 at -308 has been associated with various diseases in which TNFα is known to be important, such as cerebral malaria or mucocutaneous leishmaniasis.18 ,19Studies using reporter gene constructs to demonstrate differential transcriptional activity of TNF1 and TNF2 have been inconclusive.20-23 Interestingly, our study shows that among patients with AS and healthy HLA-B27 positive controls the TNF1/1 genotype at -308 is associated with low TNFα production, whereas the presence of a single TNF2 allele (TNF1/2) results in higher TNFα production, reaching a level as high as that of HLA-B27 negative controls. No such genotype/phenotype correlation was seen among the HLA-B27 negative controls. The relatively small number of TNF1/2 heterozygotes, however, precludes definite conclusions.
There was some indication that the cytokine pattern was influenced by the disease status. Patients with AS always had the lowest percentages of TNFα and IFNγ positive T cells. In contrast, patients with AS had twice as many CD8+ T cells producing IL10 than both control groups. It should be emphasised that the significance of IL10 producing CD8+ T cells has not been established to date. Nevertheless, it can be speculated that such cells might exert an immunosuppressive effect. Although the percentages of IL10 positive T cells were small in all groups the higher production of IL10 by CD8+ T cells in patients with AS may be relevant and might have contributed to the slight differences in the production of IFNγ and also TNFα between patients with AS and healthy HLA-B27 positive controls.
Among TNF1/1 homozygous subjects (80.6% of HLA-B27 positive controls and 83.3% of HLA-B27 negative controls were homozygous for the TNF1 allele) the HLA-B27 positive controls produced about half as much TNFα as did the HLA-B27 negative controls. This implicates HLA-B27 itself or a linked gene, other than the -308 polymorphism, as being associated with the low TNFα state in HLA-B27 positive controls. The number of genetic polymorphisms around the TNFα gene locus is large24 and, in addition, there is a likelihood of linkage disequilibrium with HLA-DR. A study from Finland on TNF microsatellites in ReA showed that two alleles, TNFa6 and TNFc1, were increased in patients with ReA. Whereas the increase of TNFa6 was probably secondary to an association with HLA-B27, the increase of the TNFc1 allele seemed to be independent of HLA-B27.25 Of further interest, both the TNFa6 and the TNFc1 allele have been associated with low TNFα production in another study.26 None the less, the TNF-308 polymorphism, either by itself or as a genetic marker for another linked polymorphism, is likely to influence TNFα production among HLA-B27 positive subjects, with TNF1/1 resulting in low and TNF1/2 resulting in high TNFα production.
If a low T cell production of TNFα and IFNγ is causally involved in the pathogenesis of AS, HLA-B27 positive controls with high TNFα production might be partially protected from AS. If the effect were large one would expect the TNF2 allele, as a marker for high TNFα production, to be underrepresented in patients with AS. Indeed, in two fairly large studies from Germany and from Scotland the TNF2 gene frequency was significantly reduced in patients with AS compared with HLA-B27 positive and negative controls.27 ,28 In two smaller studies, however, the allele frequencies were not different.29 ,30
Previous studies related TNFα secretion to other gene products of the major histocompatibility complex (MHC). Generally, an association of HLA-DR3 with higher TNFα secretion, and HLA-DR2 with lower TNFα secretion, was found.26 ,31-33 In contrast, no clear associations of TNFα secretion with MHC class I alleles have been seen. Because the frequency of HLA-B27 is relatively low in the populations studied (between 5% and 9% in the US and Western Europe) it is perhaps not surprising that HLA-B27 did not appear as a low TNFα producing allele simply because of its low frequency. In contrast, our study design comparing primarily patients with AS, healthy HLA-B27 positive controls, and healthy HLA-B27 negative controls without stratification on HLA-DR or other MHC genes was more likely to detect HLA-B27 related effects.
Our study is in accordance with an earlier study which showed a lower production of IFNγ in patients with AS compared with healthy HLA-B27 negative controls.34 No difference in TNFα levels between HLA-B27 positive patients with ReA and healthy B27 negative controls was found in a Finnish study when lipopolysaccharide stimulated monocytes were used.35 In contrast, we analysed mononuclear cells in our earlier study on ReA7 and focused on T cells in this study. TNFα producing T cells have been recognised for some time, but their precise function is yet to be defined. Because of the pivotal role of T cells in orchestrating adaptive immune responses we speculate that TNFα producing T cells perform tasks other than just providing a source of TNFα. In addition to the known strong proinflammatory effects of TNFα, recent work also indicates that TNFα may exert immunosuppressive effects in both the effector phase and progression of autoimmune responses.36
Taken together, there is evidence for a decreased production of TNFα and IFNγ by T cells in HLA-B27 positive patients with AS and healthy HLA-B27 controls, the mechanism of which is unknown. The decreased ability of T cell cytokine production might contribute to the pathogenesis of AS. Whether TNF1/2 in HLA-B27 positive controls is associated with higher production of TNFα needs further studies.
Acknowledgments
We are grateful to M Brown and P Wordsworth, Oxford, UK, for providing DNA samples of sequenced TNF-308 and TNF-238 genotypes, and to A Mitchison, London, UK, and U Mansmann, Department of Statistics, Berlin, for helpful discussions.
References
Footnotes
The work of Drs Braun and Sieper was supported by grants from the Deutsche Forschungsgemeinschaft.