Article Text

Abstract
Background: Synovial inflammation (as defined by hypertrophy and effusion) is common in osteoarthritis (OA) and may be important in both pain and structural progression.
Objective: To determine if decision rules can be devised from clinical findings and ultrasonography (US) to allow recognition of synovial inflammation in patients with painful knee OA.
Methods: A EULAR-ESCISIT cross sectional, multicentre study enrolled subjects with painful OA knee who had clinical, radiographic, and US evaluations. A classification and regression tree (CART) analysis was performed to find combinations of predictor variables that would provide high sensitivity and specificity for clinically detecting synovitis and effusion in individual subjects. A range of definitions for the two key US variables, synovitis and effusion (using different combinations of synovial thickness, depth, and appearance), were also included in exploratory analyses.
Results: 600 patients with knee OA were included in the analysis. For both knee synovitis and joint effusion, the sensitivity and specificity were poor, yielding unsatisfactory likelihood ratios (75% sensitivity, 45% specificity, and positive LR of 1.36 for knee synovitis; 71.6% sensitivity, 43.2% specificity, and positive LR of 1.26 for joint effusion). The exploratory analyses did not improve the sensitivity and specificity (demonstrating positive LRs of between 1.26 and 1.57).
Conclusion: Although it is possible to determine clinical and radiological predictors of OA inflammation in populations, CART analysis could not be used to devise useful clinical decision rules for an individual subject. Thus sensitive imaging techniques such as US remain the most useful tool for demonstrating synovial inflammation of the knee at the individual level.
- CART, classification and regression tree
- K&L, Kellgren and Lawrence
- LR, likelihood ratio
- MRI, magnetic resonance imaging
- OA, osteoarthritis
- US, ultrasonography
- Osteoarthritis
- knees
- ultrasonography
- classification and regression trees
Statistics from Altmetric.com
- CART, classification and regression tree
- K&L, Kellgren and Lawrence
- LR, likelihood ratio
- MRI, magnetic resonance imaging
- OA, osteoarthritis
- US, ultrasonography
Osteoarthritis (OA) of the knee is an increasingly common problem placing huge burden on individual subjects and health services, with the size of the problem growing rapidly as the community grows older.1–,4 The OA process is known to involve the whole joint.3 Synovitis is present from the earliest stages of OA and has been reported to be progressively increased with increasing severity of chondropathy.5,6 Recently, synovitis detected by magnetic resonance imaging (MRI) has been associated with joint pain in OA.7 Arthroscopically detected synovitis has also been associated with progression of chondropathy.8,9 The ability to detect synovitis may therefore be clinically useful for a better understanding of pathogenesis and, possibly, for predicting treatment response. In addition, early detection of synovitis may allow specific targeting of treatments.
Although MRI may be the “gold standard” for determining the presence of synovial inflammation, it is still relatively expensive and optimal synovitis detection may require the use of intravenous contrast agents. Recently, increasing interest has been shown in ultrasonography (US)10,11 as it provides a reliable, non-invasive tool that can be used in a clinic setting for detecting both synovial hypertrophy and effusions in small and large joints.12,13 At the knee, US has been demonstrated to be more sensitive than clinical examination in detecting synovitis13,14 and compares well with MRI in the detection of effusion and Baker’s cyst.15
We conducted a large cross sectional study using US to determine the presence of synovial inflammation in painful knee OA.16 This project aimed at determining if clinical decision rules could be developed that would provide high levels of both sensitivity and specificity for detecting US synovial inflammation (synovial hypertrophy or effusion) for individual patients.
METHODS
This was a cross sectional, multicentre, prospective European study conducted under the umbrella of the European League Against Rheumatism (EULAR) Standing Committee for International Clinical Studies Including Therapeutics Trials (ESCISIT), enrolling subjects from seven European countries (Belgium, France, Germany, Italy, Spain, Switzerland, and the United Kingdom) who were recruited by 50 rheumatologists. Appropriate ethics committee permission was obtained in each country and written informed consent was obtained from every patient before study participation.
The main inclusion criteria were age ⩾18, primary knee OA according to the American College of Rheumatology definition,17 with radiographic Kellgren and Lawrence (K&L) grade 1–4,18,19 symptoms of at least 6 months’ duration, functional capacity 1–3 according to the Steinbrocker functional score,20 and pain intensity at study entry ⩾30 mm on a 100 mm visual analogue scale that asked about pain in the previous 48 hours related to physical activities. Exclusion criteria included any known cause for secondary OA, surgery on the study joint within the previous 12 months, intra-articular corticosteroid injection within the previous 4 weeks, or intra-articular radionuclide injection within the previous 3 months.
After informed consent was obtained, patients were examined by a rheumatologist (investigator 1, 50 investigators in total), who collected all clinical and examination findings. A radiologist or second rheumatologist experienced in musculoskeletal US (investigator 2; 29 investigators in total) then performed US of the study knee according to prespecified US parameters. Table 1⇓ summarises the clinical and US evaluations recorded and the US technique is described in detail in the first report from this study.16 The following US definitions were employed as the primary outcome:
Summary of clinical and ultrasound evaluations of the studied osteoarthritic knee
Synovitis—defined as hypoechoic synovium with thickness ⩾4 mm and diffuse or nodular appearance
Joint effusion—maximal depth of the suprapatella recesses measured on the median sagittal plane crossing the quadriceps tendon (in mm); this was transformed into a two point categorical scale where “absent” represented an effusion depth <4 mm and “present” represented an effusion depth ⩾4 mm.
The results of the clinical examination findings were not shared with the ultrasonographer, but the ultrasonographer was able to communicate in writing the results of the US examination to investigator 1 as the treating clinician. Data were recorded by the investigators on two separate case report forms, which were forwarded to a central data entry and quality control service.
Statistical analysis
The previous report on the US findings of the present cohort16 included a multivariate logistic regression model that demonstrated the variables associated with the highest probability of having US detected synovial inflammation, according to the primary outcome definitions. However, such probabilities are not generally useful for clinicians when faced with an individual patient. To determine a systematic way of predicting the presence or absence of US detected abnormalities in a given patient, a classification and regression tree (CART) analysis was performed, using CART software (Salford System, San Diego, CA). These decision tree models are technically known as binary recursive partitioning.21,22 A parent node is always split into two child nodes (binary), the process is repeated for each child node (recursive) and each split results in partitioning into mutually exclusive subsets. The models aim to recursively partition input variables in order to maximise the purity in a terminal node. The decision to make a partitioning split is done after searching each possible threshold for each variable included in order to find the split that leads to the greatest improvement in the purity score of the resultant node, and cut off points are sought for continuous variables (rather than deciding on an arbitrary dichotomous point). Each node is split on just one variable.
A 10-fold cross validation was used for estimating misclassification rates. The 10-fold cross validation split the total sample into 10 subsamples. Trees were then generated excluding the data from each subsample in turn. For each tree, each misclassification rate was estimated by applying the tree to the subsample excluded in generating the tree. The cross validated rate estimate for the overall tree was calculated as the average of the rates of the 10 trees. A positive likelihood ratio (LR+ = sensitivity/1−specificity) was calculated for each decision tree, with an LR+ ⩾3 considered desirable.
Because the definitions used for synovitis and effusions were necessarily conservative, a number of other definitions were explored to determine if useful clinical decision rules could be established. These other definitions allowed for combinations of variation in the size of what was considered “pathological” synovial hypertrophy or effusion depth and used various combinations of synovial appearance. A CART analysis was performed for the range of definitions, and when clinical parameters were selected, they were included in a subsequent logistic regression model. This model proceeded with stepwise selection until no variables met the criteria for entry (p<0.05) or removal (p>0.05) for the significance levels of the likelihood ratio test.
RESULTS
Of 643 subjects enrolled in the study, 16 subjects (2.5%) had only one case report form available from clinical or US evaluation, so that there were 627 potentially analysable subjects. Among these subjects, 27 (4.3%) had a major protocol deviation, leaving a final analysis population of 600 subjects. The demographics, clinical, and US evaluations have already been presented in detail.16 Briefly, the 600 included subjects had a mean (SD) age of 66.7 (9.8), 165 (27.5%) were male, and the mean (SD) body mass index was 29.9 (5.3). When primary outcome definitions were used 322 (53.7%) had no US evidence of inflammation, 16 (2.7%) had synovitis alone, 177 (29.5%) had effusion alone, and 85 (14.2%) had both synovitis and effusion.
CART analysis using primary outcome definitions
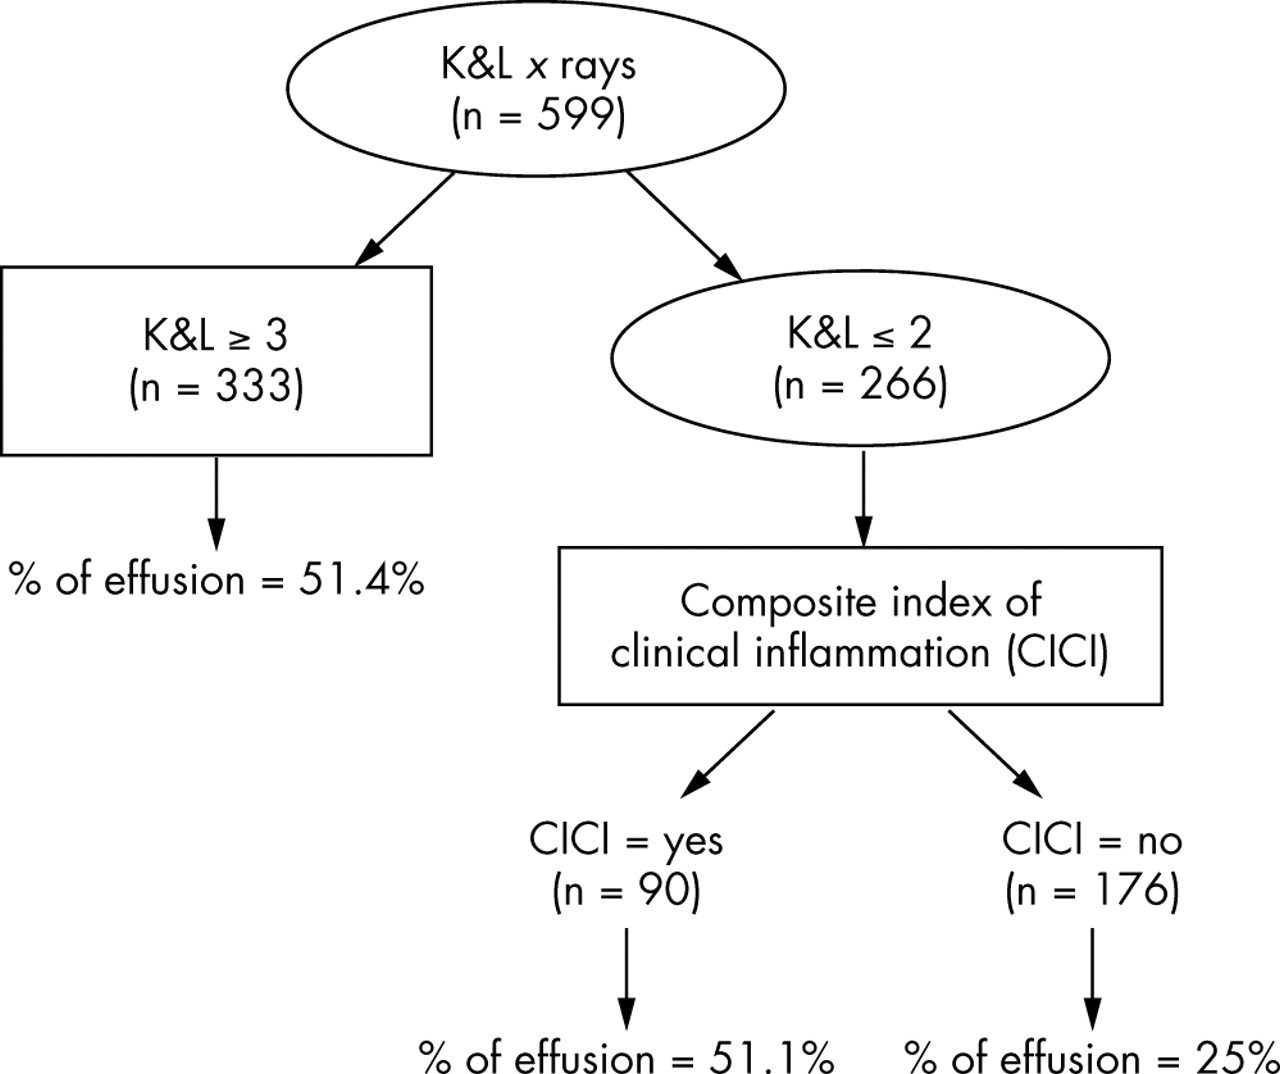
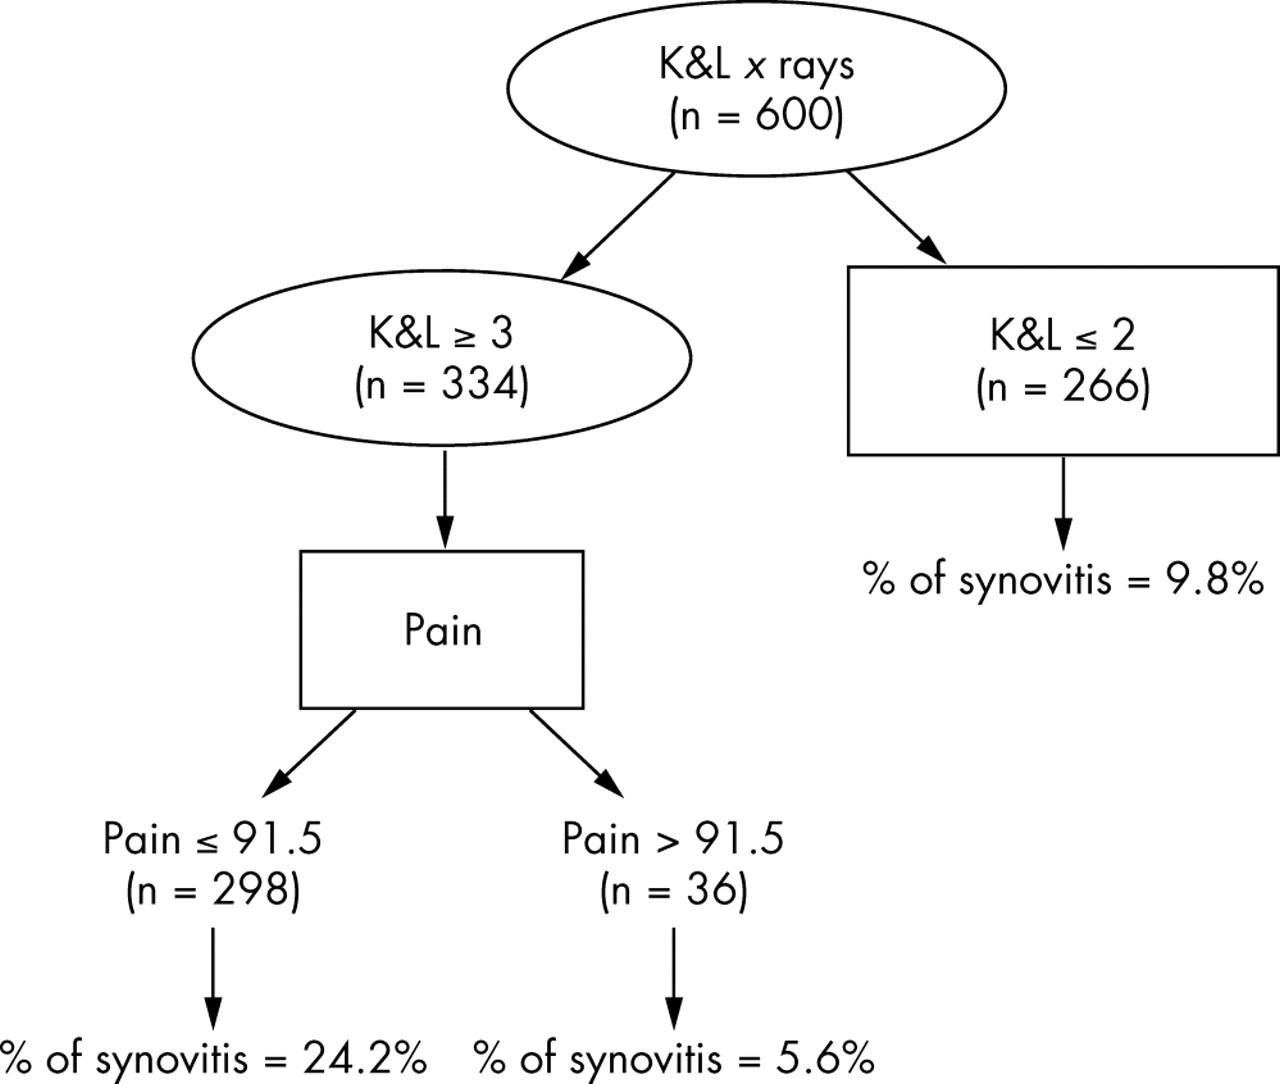
Figure 1⇓ presents the decision tree for knee synovitis. When this tree was used a sensitivity of 75% and a specificity of 45% were obtained (see table 2⇓), giving an LR+ of 1.36. Figure 2⇓ presents the decision tree for knee effusion. When this tree was used a sensitivity of 71.6% and a specificity of 43.2% were obtained (see table 3⇓), giving an LR+ of 1.26. Neither of these results was considered satisfactory for clinical use.
Classification table with sensitivity and specificity obtained by 10-fold cross validation, used to test the decision tree for knee synovitis shown in fig 1⇓
Classification table with sensitivity and specificity obtained by 10-fold cross validation, used to test the decision tree for joint effusion shown in fig 2⇓

Decision tree for knee synovitis. K&L, Kellgren and Lawrence.
Decision tree for joint effusion. Note that data were missing on one subject; hence 599 patients were included in this analysis. K&L, Kellgren and Lawrence.
CART analysis using exploratory definitions
Table 4⇓ presents the CART results for three of the exploratory definitions, together with the associated logistic regression analyses. It is noteworthy that whatever the definition used, subjects with knee OA with a more severe radiological grade (K&L scores ⩾3) and moderate or important knee joint effusion on clinical examination had an increased likelihood of synovitis or effusion being detected on US examination. Unfortunately the CART selected LRs were again disappointing.
Classification and regression tree and regression analyses for exploratory definitions of ultrasound detected inflammation
DISCUSSION
This study attempted to produce decision rules for the clinical detection of synovial inflammation in patients with OA using data derived from a large, multicentre European study of 600 knees. Unfortunately, at the individual subject level, the CART analysis (using both primary definitions and variations of these) did not produce an LR+ above 2. This means that the selected variables would not be helpful clinically for identifying synovial inflammation in a given patient. This was despite the fact that the first report from this study correlated clinical and ultrasonographic features at the group level16 and showed that inflammation observed at US correlated statistically with advanced radiographic disease (K&L grades 3–4) and, at an earlier stage (K&L grades 1–2) with clinical signs or symptoms suggestive of an inflammatory flare of the disease (for example, sudden increase in pain in the previous 2 weeks or clinical joint effusion).
The CART methodology employed here has been used previously to define useful clinical algorithms in other medical areas such as oncology23 and cardiology.24 In rheumatology, Wolfe et al have demonstrated that clinical features such as fatigue and sleep disturbance may be usefully included in clinical CART algorithms using traditional measures (pain and tender joint counts) for predicting change of treatment in the clinic.25 As they noted, there is often an incongruity between clinical trials and routine clinical practice in the feasibility of time consuming trial evaluations. Similarly, we aimed at producing a useful tool that did not require US for assessing people in the clinic, rather than trying to extrapolate from findings at the group level.
There are limitations to this study. Firstly, the imaging method employed for the detection of inflammation was US. Although gadolinium-enhanced MRI may (arguably) be more sensitive in detecting synovitis, it would not have been feasible to use it for such a large, multicentre cohort. The definitions used for US detected disease were also conservative and based on the limited available published reports; however, it is interesting that in the exploratory analyses, even more encompassing definitions of synovial disease (for example, synovial thickness ⩾2 mm) did not yield a better LR+ on CART analysis. The CART analysis itself has limitations, although these do not seem to be greater than other discrimination techniques used in clinical decision making.24 Caution should be used in assuming that the clinical features selected in the CART analyses are the most important, but in this case the features (for example, severe radiographic grade or very high levels of pain; figs 1⇑ and 2⇑) selected would support the face validity of these analyses.
In summary, it would be desirable clinically to determine accurate “subsets” of patients with OA in order to better understand disease pathogenesis and clarify therapeutic response; indeed our aim should be to tailor treatment to the individual patient. We sought to determine easily employed algorithms for detecting synovitis by the clinician. However, the results of this study suggest that the most sensitive and specific way of determining synovial hypertrophy and effusion is to use imaging, most feasibly US. Longitudinal evaluation of this EULAR cohort will provide information on the predictive validity of US detected synovial pathology for OA disease progression.
Acknowledgments
We gratefully acknowledge the contribution of all investigators.
France: Dr Yves Alibert, Dr Xavier Ayral, Dr Alain Beaulieu-Camus Dr Albert Benbassat, Dr Jean-Michel Benoit, Dr Pierre Borderie, Professor Pierre Bourgeois, Dr Jacques Busson, Dr Alain Cottin, Dr Catherine Cyteval, Dr Catherine Didry, Dr Jean Durckel, Dr Fabien Etchepare, Dr Véronique Ferrazzi, Dr Dominique Folinais, Dr Denis Fornecker, Dr Philippe Gibeault, Dr Eric Gibert, Dr Christophe Hudry, Dr Dominique Kieffer, Dr Marie-Christine Legouffe, Dr Emmanuel Maheu, Dr Philippe Mathieu, Dr Frédéric Maury, Dr Francis Meyer, Dr Gérard Mirisch, Dr Gérard Morvan, Dr Jean-François Moussali, Dr Minh Nguyen, Dr Gérard Panis, Dr Eric Pansard, Dr Stephan Pavy, Dr Sylvie Rozenberg, Dr Christine Saudeau, Dr Bruno Singer, Dr Marc Tardieu, Dr Philippe Tauveron, Dr Philippe Thelen, Dr Roland Vaisberg, Dr Marc Wybier.
Italy: Dr Patrizia Blasetti, Dr Rossella De Angelis, Dr Antonella Farina, Dr Emilio Filippucci, Dr Gianni Lamanna.
Spain: Dr Gema Bonilla, Dr Eugenio De Miguel.
Germany: Dr Eugen Feist, Dr Sonja Kary, Dr Uwe Lang, Dr Anett Reissauer, Dr Udo Schneider.
Switzerland: Professeur Jean-Charles Gerster, Dr Laurent Malterre, Dr Georges Rappoport, Dr Nicholas Theumann, Dr Daniel Van Linthoudt, Dr Maurice Waldburger, Dr Pascal Zufferey.
Belgium: Dr Béatrice Andre, Dr Marie-Joëlle Kaiser, Dr Olivier Kaye, Dr Stefaan Marcelis.
This study was supported in part by an unrestricted grant from Bristol Myers-Squibb.
REFERENCES
Footnotes
Published Online First 5 May 2005