Article Text

Abstract
The field of spondyloarthritis (SpA) has experienced major progress in the last decade, especially with regard to new treatments, earlier diagnosis, imaging technology and a better definition of outcome parameters for clinical trials. In the present work, the Assessment in SpondyloArthritis international Society (ASAS) provides a comprehensive handbook on the most relevant aspects for the assessments of spondyloarthritis, covering classification criteria, MRI and x rays for sacroiliac joints and the spine, a complete set of all measurements relevant for clinical trials and international recommendations for the management of SpA. The handbook focuses at this time on axial SpA, with ankylosing spondylitis (AS) being the prototype disease, for which recent progress has been faster than in peripheral SpA. The target audience includes rheumatologists, trial methodologists and any doctor and/or medical student interested in SpA. The focus of this handbook is on practicality, with many examples of MRI and x ray images, which will help to standardise not only patient care but also the design of clinical studies.
Statistics from Altmetric.com
The field of spondyloarthritis (SpA) has faced tremendous changes over the last decade. Undoubtedly, these changes were triggered by the development of several effective therapies for ankylosing spondylitis (AS). Drug development and registration nowadays requires appropriate classification criteria to sharply delineate the trial population of interest as well as a validated toolset for measuring outcome of clinical trials.
The Assessment of SpondyloArthritis international Society (ASAS) (formerly ASsessment in Ankylosing Spondylitis), was initiated in 1995 to bring evidence-based unity in the multitude of assessments in the field of AS, has broadened its scope to the entire spectrum of SpA later on, and has extended its work to measuring treatment response in clinical trials, the re-evaluation of existing classification criteria and the development of diagnostic criteria for SpA. This all to achieve the mission of ASAS, which is the support and promotion of translational and clinical research of spondyloarthritis. The ultimate goal is to improve the well-being and outcome of patients with spondyloarthritis. The means to achieve this goal include: (1) increasing awareness of spondyloarthritis, (2) facilitating early diagnosis, (3) developing and validating assessment tools and (4) evaluating treatment modalities. ASAS, which is a worldwide forum consisting of clinical rheumatologists, methodologists, workers in pharmaceutical industry and others, has always collaborated with organisations such as the Outcome Measures In Rheumatology Clinical Trials (OMERACT) group and the European League Against Rheumatism (EULAR).
One of the first ASAS efforts was the delineation of relevant domains of outcome in AS and the development of a core set of outcome measures to be used in clinical trials (for physiotherapy and disease-modifying antirheumatic drugs (DMARDs)) and in clinical practice (core set for clinical record keeping). Since then, the core set has been updated regularly and there has not been a single field in outcome assessment that ASAS has not addressed. Important achievements with relevant implications have been the development of response criteria for clinical trials (ASAS20, ASAS40, ASAS 5/6 and ASAS partial remission), the validation of measurement instruments for radiographic damage and progression and for magnetic resonance inflammation, and recently the development of a new index for measuring disease activity, the Ankylosing Spondylitis Disease Activity Score (ASDAS).
Since 1995, ASAS-endorsed assessments and response measures have been applied in several clinical trials in AS and SpA and have proven to be extremely valuable in the evaluation of pharmaceutical and non-pharmaceutical treatments and in drug registration.
The ASAS handbook in front of you reads like a compendium of ASAS history. It provides a complete picture of all measurements that have been investigated and developed during the last 13 years, including the ASAS core set. It provides insight in available and newly developed criteria for classifying SpA and it exemplifies response criteria as well as recent achievements in measuring disease activity. Moreover, there is extensive focus on abnormalities seen on imaging (mainly radiographs and MRI) in sacroiliac (SI) joints and spine; features characteristic for SpA, but also caveats that can easily be misinterpreted. New definitions on how to define a positive MRI are also provided.
The handbook focuses on axial SpA, since the development of outcome assessment started in AS, the prototype disease in the spectrum of SpA. Peripheral SpA is not ignored at all, but the picture for this disease is not yet complete and the handbook will be updated once new developments in this field have been substantiated.
The target audience for the ASAS handbook includes every rheumatologist who is interested in measuring and monitoring patients with SpA in clinical practice as well as clinical researchers in the field of SpA, since it gives detailed descriptions of how tests should be performed. Trial methodologists and other workers in the pharmaceutical industry assigned to the development and conduct of clinical trials will find which outcome measures to choose in trials, how to describe them in the protocol and how to practically teach and use them in the trial. Workers in the regulatory field may use the handbook as a guide to judge the trial performance and robustness. And medical students will find a quick overview of what is important in the field of outcomes in SpA.
Although the handbook aims to be comprehensive in terms of content, the focus is on practicality rather than on understanding background and performance. The reader of the handbook will, for example, find how to perform the modified Schober test or how to score radiographs according to the modified Stoke Ankylosing Spondylitis Spine Score (SASSS), but will not be informed about the relative performance of this test or method in comparison with others. More information on this can be found in the reference list.
The ASAS handbook is published by—and under the responsibility of—the ASAS executive committee, and will be regularly updated.
PART A: CLASSIFICATION CRITERIA
In this section all recent classification criteria for spondyloarthritis are listed, starting with the 1984 modified New York criteria for ankylosing spondylitis, followed by the 1990/1991 Amor criteria and the European Spondyloarthropathy Study Group (ESSG) criteria for spondyloarthritis, which cover the whole spectrum of SpA including axial and peripheral SpA and also the early phase of the disease without chronic x ray changes. The most recent ASAS classification criteria for axial spondyloarthritis were developed for early and established cases and include the MRI technique (active inflammation) as an important tool for early diagnosis. ASAS criteria for peripheral SpA are pending and are currently being developed. For diagnosis in daily clinical practice, a more flexible approach is often necessary than is offered by classification criteria that ask for a clear “yes” or “no” response. A diagnostic algorithm for axial SpA based on calculation of likelihood ratios for the clinical, laboratory and imaging parameters typical for SpA has been proposed recently,1 2 but was not discussed by ASAS and therefore not included in this handbook. The listed criteria for inflammatory back pain (IBP) have a similar performance and can all be used in daily clinical practice. For the development of the ASAS criteria for axial SpA the ASAS-expert IBP criteria were used.
Box 1 Modified New York criteria for ankylosing spondylitis (1984)3
Clinical criteria:
Low back pain and stiffness for more than 3 months that improves with exercise, but is not relieved by rest.
Limitation of motion of the lumbar spine in the sagittal and frontal planes.
Limitation of chest expansion relative to normal values correlated for age and sex.
Radiological criterion:
Sacroiliitis grade ⩾2 bilaterally or grade 3–4 unilaterally.
Definite AS if the radiological criterion is associated with at least one clinical criterion
Box 2 Amor criteria for spondyloarthritis4
A patient is considered to have spondyloarthritis if the sum of the point counts is 6 or more. A total point count of five or more classifies for probable spondyloarthritis.

Box 4 ASAS criteria for classification of axial spondyloarthritis (to be applied in patients with chronic back pain and age at onset of back pain <45 years)6

Box 5 IBP according to ASAS experts7 to be applied in patients with chronic back pain (>3 months)
Age at onset <40 years
Insidious onset
Improvement with exercise
No improvement with rest
Pain at night (with improvement upon getting up)
The criteria are fulfilled if at least four out of five parameters are present.
Box 6 Calin criteria for IBP8
Age at onset <40 years
Back pain >3 months
Insidious onset
Associated with morning stiffness
Improvement with exercise
The Calin criteria are fulfilled if at least four out of five parameters are present.
Box 7 Berlin criteria for IBP9 to be applied in patients with chronic back pain (>3 months)
Morning stiffness >30 min
Improvement with exercise but not with rest
Awakening at second half of the night because of back pain
Alternating buttock pain
The criteria are fulfilled if at least two out of four parameters are present.
PART B: MRI
MRI studies of the sacroiliac joints and the spine in patients with SpA have made a major contribution in the last decade to a better understanding of the course of the disease, to an early diagnosis and have been used as an objective outcome measure for clinical trials.
Active inflammatory changes are visualised best by fat-saturated T2-weighted turbo spin-echo sequence or a short tau inversion recovery (STIR) sequence with a high resolution (image matrix of 512 pixels, slice thickness of 3 mm or 4 mm), which can detect even minor fluid collections such as bone marrow oedema. Alternatively, administration of a paramagnetic contrast medium (gadolinium) detects increased perfusion (osteitis) in a T1-weighted sequence with fat saturation. These two sequences give largely overlapping information, although occasionally applying both methods can give additional value. Chronic changes such as fatty degeneration and erosions are best seen by using a T1-weighted turbo spin-echo sequence.
MRI of the axial skeleton is performed with whole-body scanners with a field strength of 1.0 or 1.5 Tesla, preferably using special spinal or body phased-array coils. The SI joints are imaged using a semicoronal section orientation along the long axis of the sacral bone. The protocol comprises a T1-weighted turbo spin-echo sequence, a T2-weighted gradient-echo sequence using the opposed-phase technique and a STIR sequence with slices of 4 mm thickness. The whole sacral bone should be covered from its anterior to its posterior border, which usually requires at least 10–12 slices. Administration of a paramagnetic contrast medium (gadolinium), usually followed by imaging with a fat-saturated T1-weighted turbo spin-echo sequence, might give additional information on active inflammation.
An efficient spinal imaging protocol comprises a sagittal T1-weighted turbo spin-echo sequence and a sagittal fat-saturated T2-weighted turbo spin-echo sequence, or STIR sequence with a high resolution. If a paramagnetic contrast medium is administered, a T1-weighted sequence with fat saturation should be used in a sagittal orientation. Transverse slices are useful for assessment of the posterior parts of the spine. However, for routine imaging of the spine transverse sequences are time consuming and therefore less feasible. Coronal slices of the entire spine may be used for better assessment of the costovertebral and costotransverse joints and of the facet joints.
In the following section, a detailed description of active inflammatory and chronic lesions of the sacroiliac joints and the spine typical for SpA is given, with many examples of images. Because active inflammation of the SI joints has become an important parameter for early diagnosis of axial SpA, special emphasis has been given to define a “positive lesion”. Furthermore, pitfalls in the diagnosis of SpA-specific MRI findings are discussed and shown.
Before assessing the active inflammatory or chronic lesions on MRI it is necessary to define the MRI sequence of the image in question. This can normally be done by looking at spinal fluid, intervertebral discs and subcutaneous fat tissue (see Box 8).
Several scoring methods for assessing inflammatory activity in the spine and sacroiliac joints have been used in the past and have also recently been compared with each other.10 11 However, none of them has been proven so far to be superior. Therefore, these scores have not been included in this handbook at this time point but may be added later on.
I. MRI OF THE SACROILIAC JOINTS IN PATIENTS WITH SPONDYLOARTHRITIS12
Box 9 Types of typical MRI lesions of the sacroiliac joint
Active inflammatory lesions (STIR/post-gadolinium T1):
bone marrow oedema (osteitis)
capsulitis
synovitis
enthesitis
Chronic inflammatory lesions (normally T1):
sclerosis
erosions
fat deposition
bony bridges/ankylosis
Box 10 Active inflammatory lesions: bone marrow oedema (osteitis)
Hyperintense signal on STIR images (bone marrow oedema) and/or on contrast-enhanced T1-weighted fat-saturated images (osteitis). The stronger the hyperintense signal the more likely it reflects active inflammation (intensity of the hyperintense signal is similar to that of blood vessels or spinal fluid).
Bone marrow oedema (BME) is an indicator of active sacroiliitis but may be found in other pathologies as well.
Affected bone marrow areas are located periarticularly.
BME may be associated with structural changes such as erosions.

Box 11 Active inflammatory lesions: synovitis
Synovitis is reflected by hyperintense signals on contrast-enhanced T1-weighted fat-saturated images in the synovial part of the SI joints (similar to blood vessels). STIR sequences do not differentiate between synovitis and joint fluid.
Synovitis on MRI as a single feature (without BME) is a rare finding and may not suffice for making an imaging diagnosis of sacroiliitis.

Box 12 Active inflammatory lesions: capsulitis
Capsulitis is comparable to synovitis in terms of signal characteristics but these changes involve the anterior and posterior capsule. Anteriorly, the joint capsule gradually continues into the periosteum of the iliac and sacral bones and thus corresponds to an enthesis. Capsulitis, therefore, may extend far medially and laterally into the periosteum. Capsulitis may be better detectable using contrast-enhanced T1-weighted fat-saturated images as compared to STIR.

Box 13 Active inflammatory lesions: enthesitis
Hyperintense signal on STIR images and/or on contrast-enhanced T1-weighted fat-saturated images at sites where ligaments and tendons attach to bone, including the retroarticular space (interosseous ligaments). The signal may extend to bone marrow and soft tissue. Enthesitis may be better detectable using contrast-enhanced T1-weighted fat-saturated images as compared to STIR.

Box 14 Active inflammatory lesions: differential diagnosis and pitfalls
Inflammation of SI joints in SpA is usually limited to the bone/SI joint and does not cross anatomical borders.
Other pathologies may result in reactive (secondary) lesions that appear as inflammation.
Ligaments surrounded by vessels may appear as actively inflamed.
Coil effect (artefact).

Box 15 How to define active inflammatory lesions (“positive MRI”) of the sacroiliac joint (sacroiliitis) associated with spondyloarthritis on MRI
The presence of definite subchondral bone marrow oedema/osteitis highly suggestive of sacroiliitis is mandatory.
The presence of synovitis, capsulitis, or enthesitis only without concomitant subchondral bone marrow oedema/osteitis is compatible with sacroliitis but not sufficient for making a diagnosis of active sacroliitis.
Technical aspects: STIR images are usually sufficient to detect active (acute) inflammatory lesions; exception: synovitis (not detectable with STIR only, T1 post-gadolinium is needed).
Amount of signal required: if there is one signal (lesion) only, this should be present on at least two slices. If there is more than one signal on a single slice, one slice may be enough.
A: sacroiliitis of the left SI joint (STIR). If there is more than one signal on a single slice, one slice may be enough.
B: sacroiliitis of the left SI joint (STIR). If there is only one signal as shown here (arrow), signals on additional slices would be necessary.
C1-C3: one lesion only present on a single slice (circle, only in C2) is not sufficient (STIR); indicating here a blood vessel (circle in C2).

Box 16 Chronic inflammatory lesions: technical aspects
T1 sequences are usually sufficient to detect structural lesions (sclerosis, fat deposition, ankylosis).
T1 fat-suppressed (T1 FS) or T2 gradient-echo sequences might be better to detect erosions.
Box 17 Chronic inflammatory lesions: subchondral sclerosis
Sclerotic areas are depicted as low-intensity or signal-free bands by all sequences (T1, STIR, T1 post-gadolinium) and show no signal enhancement after contrast medium administration. Sclerosis attributable to SpA should extend at least 5 mm from the SI joint space.

Box 18 Chronic inflammatory lesions: erosions
Erosions are of low signal intensity on T1-weighted images and high signal intensity on STIR images if active. T2 gradient-echo or T1 fat-saturated sequences maybe more useful in detecting erosions.
Erosions are bony defects at the joint margin. Erosions may occur throughout the cartilaginous compartment of the joint. Erosions initially appear as single lesions. Confluence of erosions may be seen as pseudodilation of the sacroiliac joints.
A3 and A4 have been reproduced from Song13 (online version).

Box 19 Chronic inflammatory lesions: periarticular fat depositions
Fat accumulation is characterised on MRI by an increased signal intensity on T1-weighted images.
Accumulation results from the esterification of fatty acids in inflammatory, often periarticular bone marrow areas.
In general, it is a non-specific finding. In SpA, it often indicates areas of previous inflammation.
A has been reproduced from Rudwaleit.12

Box 20 Chronic inflammatory lesions: ankylosis
Low signal intensity on all MRI sequences, sometimes surrounded by high intensity signal on T1 (fatty degeneration of bone marrow).
Bone buds directly facing each other have fused to form bone bridges across the joint.
When several adjoining bone bridges are present, the joint cavity becomes increasingly blurred.
B has been reproduced from Rudwaleit.12

A. Small ankylosis of left sacroiliac (SI) joint (circle) (T1-weighted sequence). B. Ankylosis of SI joints (arrows) (T1-weighted sequence)
II. MRI OF THE SPINE IN PATIENTS WITH SPONDYLOARTHRITIS

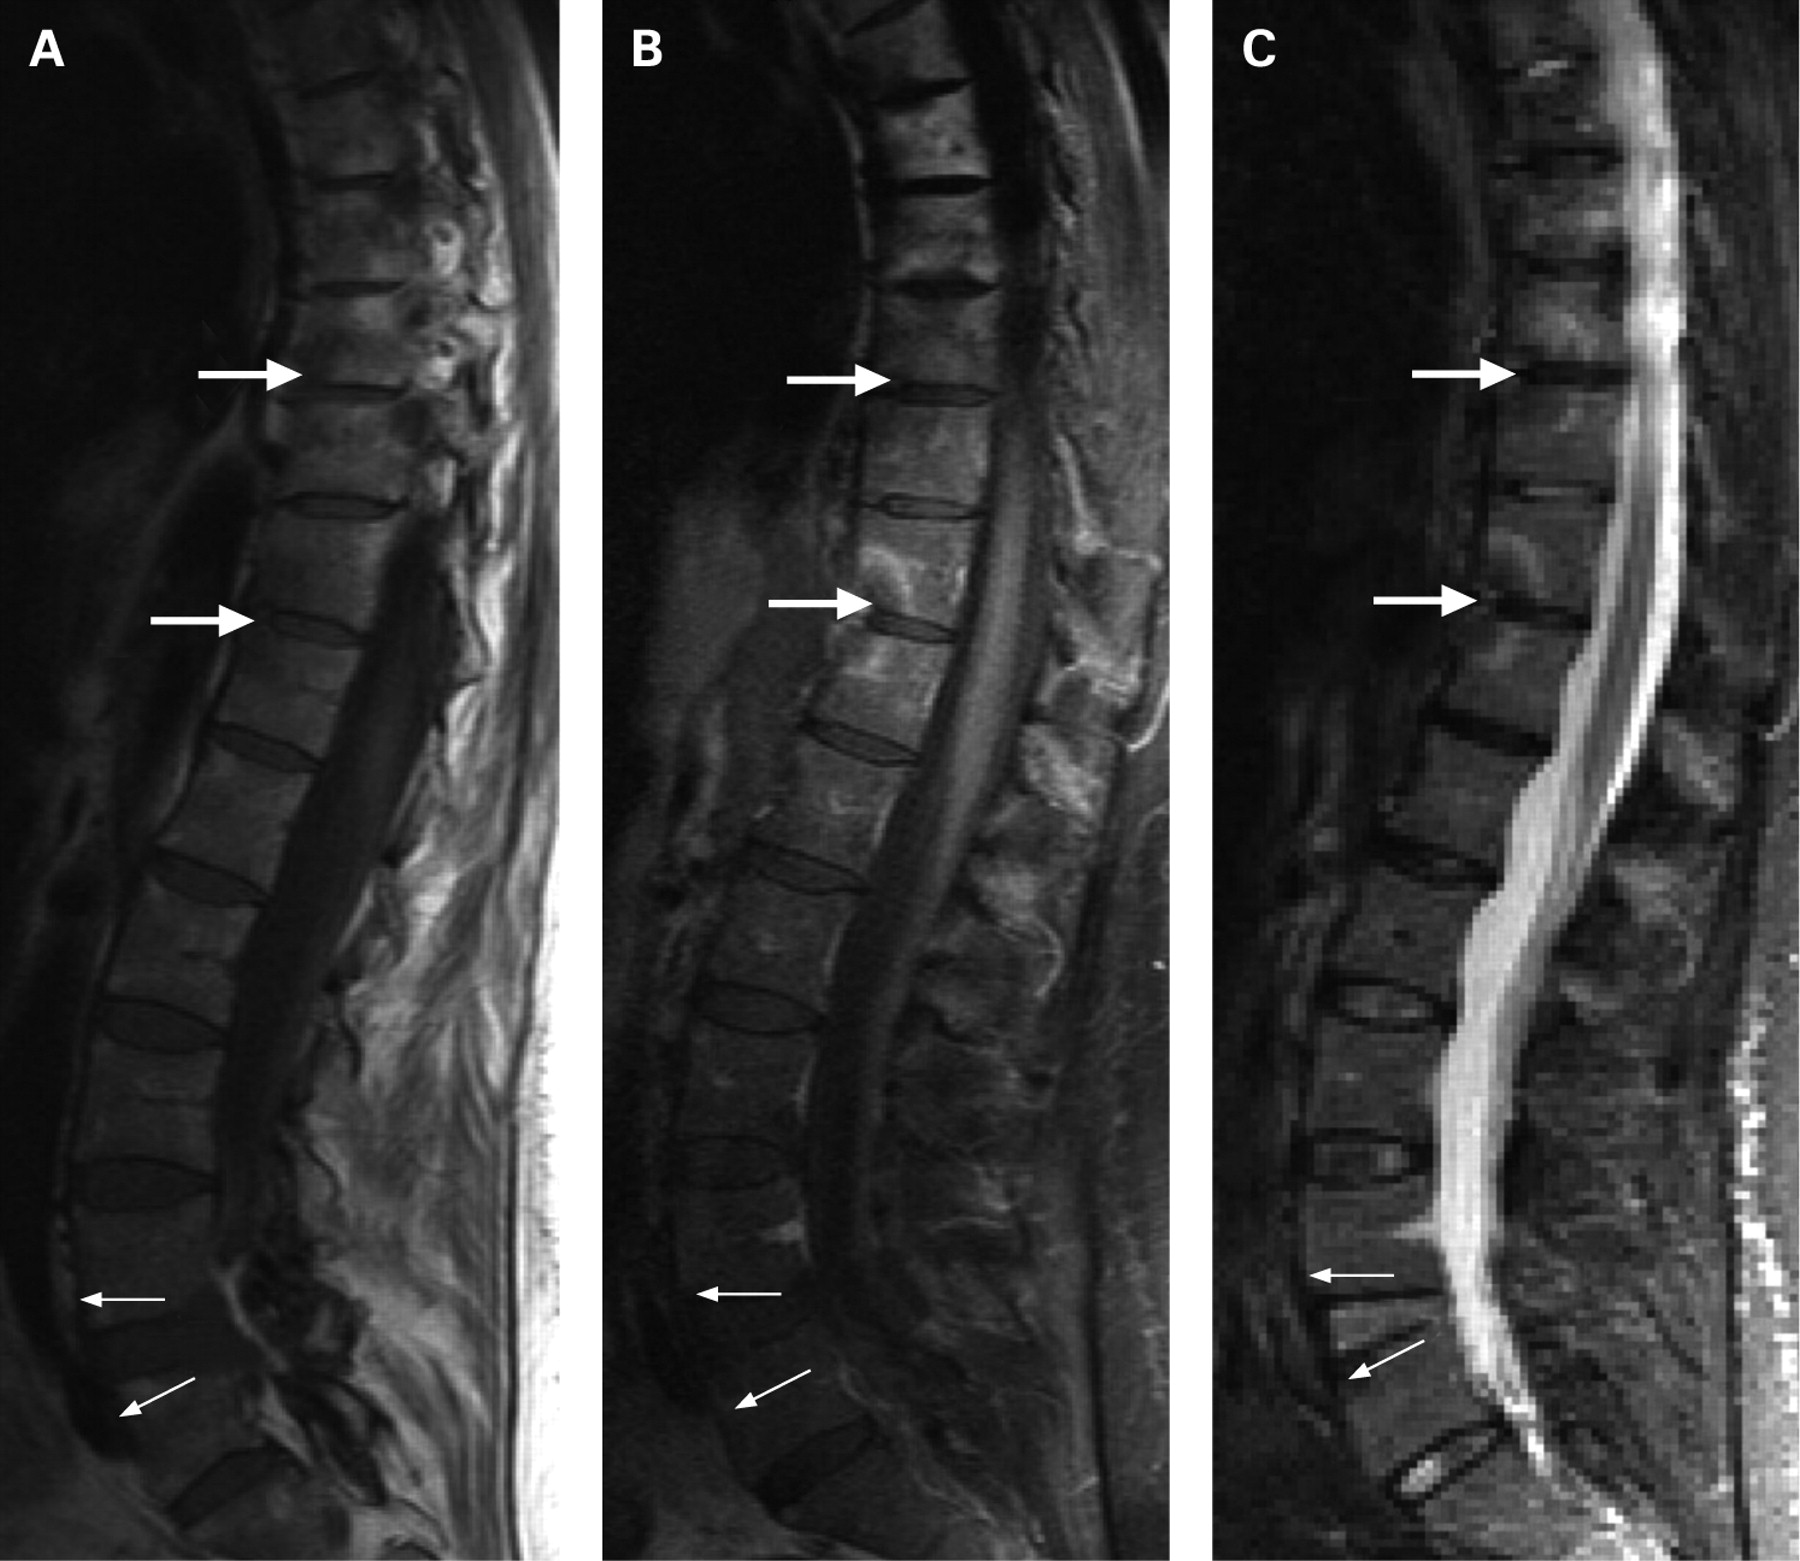
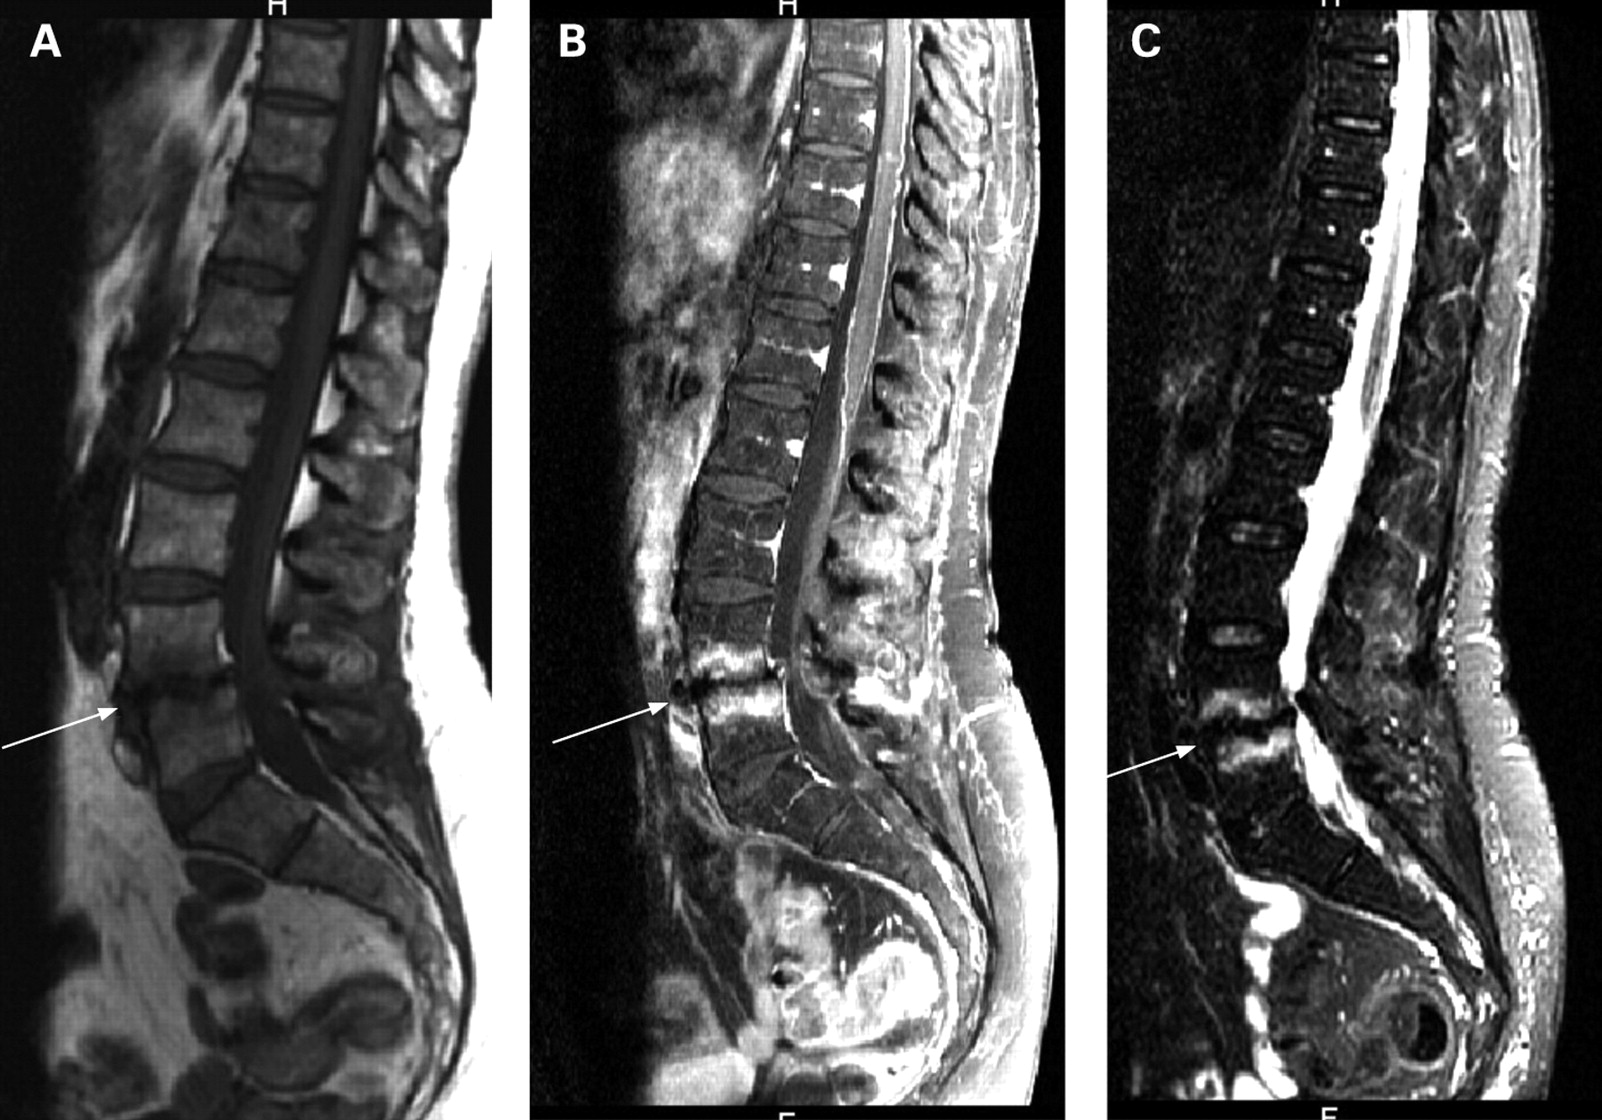
Spondylitis anterior and posterior (arrows) in three different MRI sequences: (A) T1 pre-gadolinium sequence, (B) T1 post-gadolinium sequence, (C) short tau inversion recovery (STIR) sequence. As a sign of inflammatory spinal lesion, the hypointense lesions in T1 are shown as hyperintense lesions after gadolinium enhancement and in the STIR sequence. By contrast, hypointensity in T1 pre-gadolinium (A) and post-gadolinium (B), or STIR (C), is considered a sign of erosion, as seen in the thoracic vertebrae of this patient with ankylosing spondylitis.

Comparison of the sensitivity of the two most frequently used MRI sequences to depict inflammatory and chronic spinal lesions in patients with ankylosing spondylitis: (A) T1 pre-gadolinium sequence, (B) T1 post-gadolinium sequence, (C) short tau inversion recovery (STIR) sequence. While spinal fusion (thin arrows, here in the dorsal part of the thoracic vertebrae) is depicted better in the T1 pre-gadolinium MRI sequence, spinal inflammation (bold arrows) are only depicted either after application of gadolinium (B) or in the STIR sequence (C).

Typical signs of inflammatory lesions in ankylosing spondylitis: (A) T1 pre-gadolinium sequence, (B) T1 post-gadolinium sequence. Thin arrows, spondylitis anterior (short arrows) and posterior (long arrows). Bold arrow, spondylitis anterior surrounding an erosion on the lower edge of the vertebral body. Circle, inflammation in the zygoapophyseal joint.
A. T1 pre-gadolinium sequence. B. T1 post-gadolinium sequence. C. Short tau inversion recovery (STIR) sequence. Bold arrows, inflammatory spinal lesions. Thin arrows, fatty degenerative lesions. Inflammatory spinal lesions (bold arrows) can be seen as hypointense lesions (here surrounding erosive changes) in T1 pre-gadolinium and as hyperintense lesions in T1 post-gadolinium and STIR sequences on MRI, disease specific degenerative changes, such as fatty degeneration (thin arrows) are showing hyperintensity in T1 pre-gadolinium and hypointensity in T1 post-gadolinium and in STIR sequences.

Active spondylodisciitis (bold arrow) and active spondylitis anterior (thin arrows) in the short tau inversion recovery (STIR)sequence (B) and fatty degeneration and syndesmophytes (arrow heads) in the T1 sequence (A).
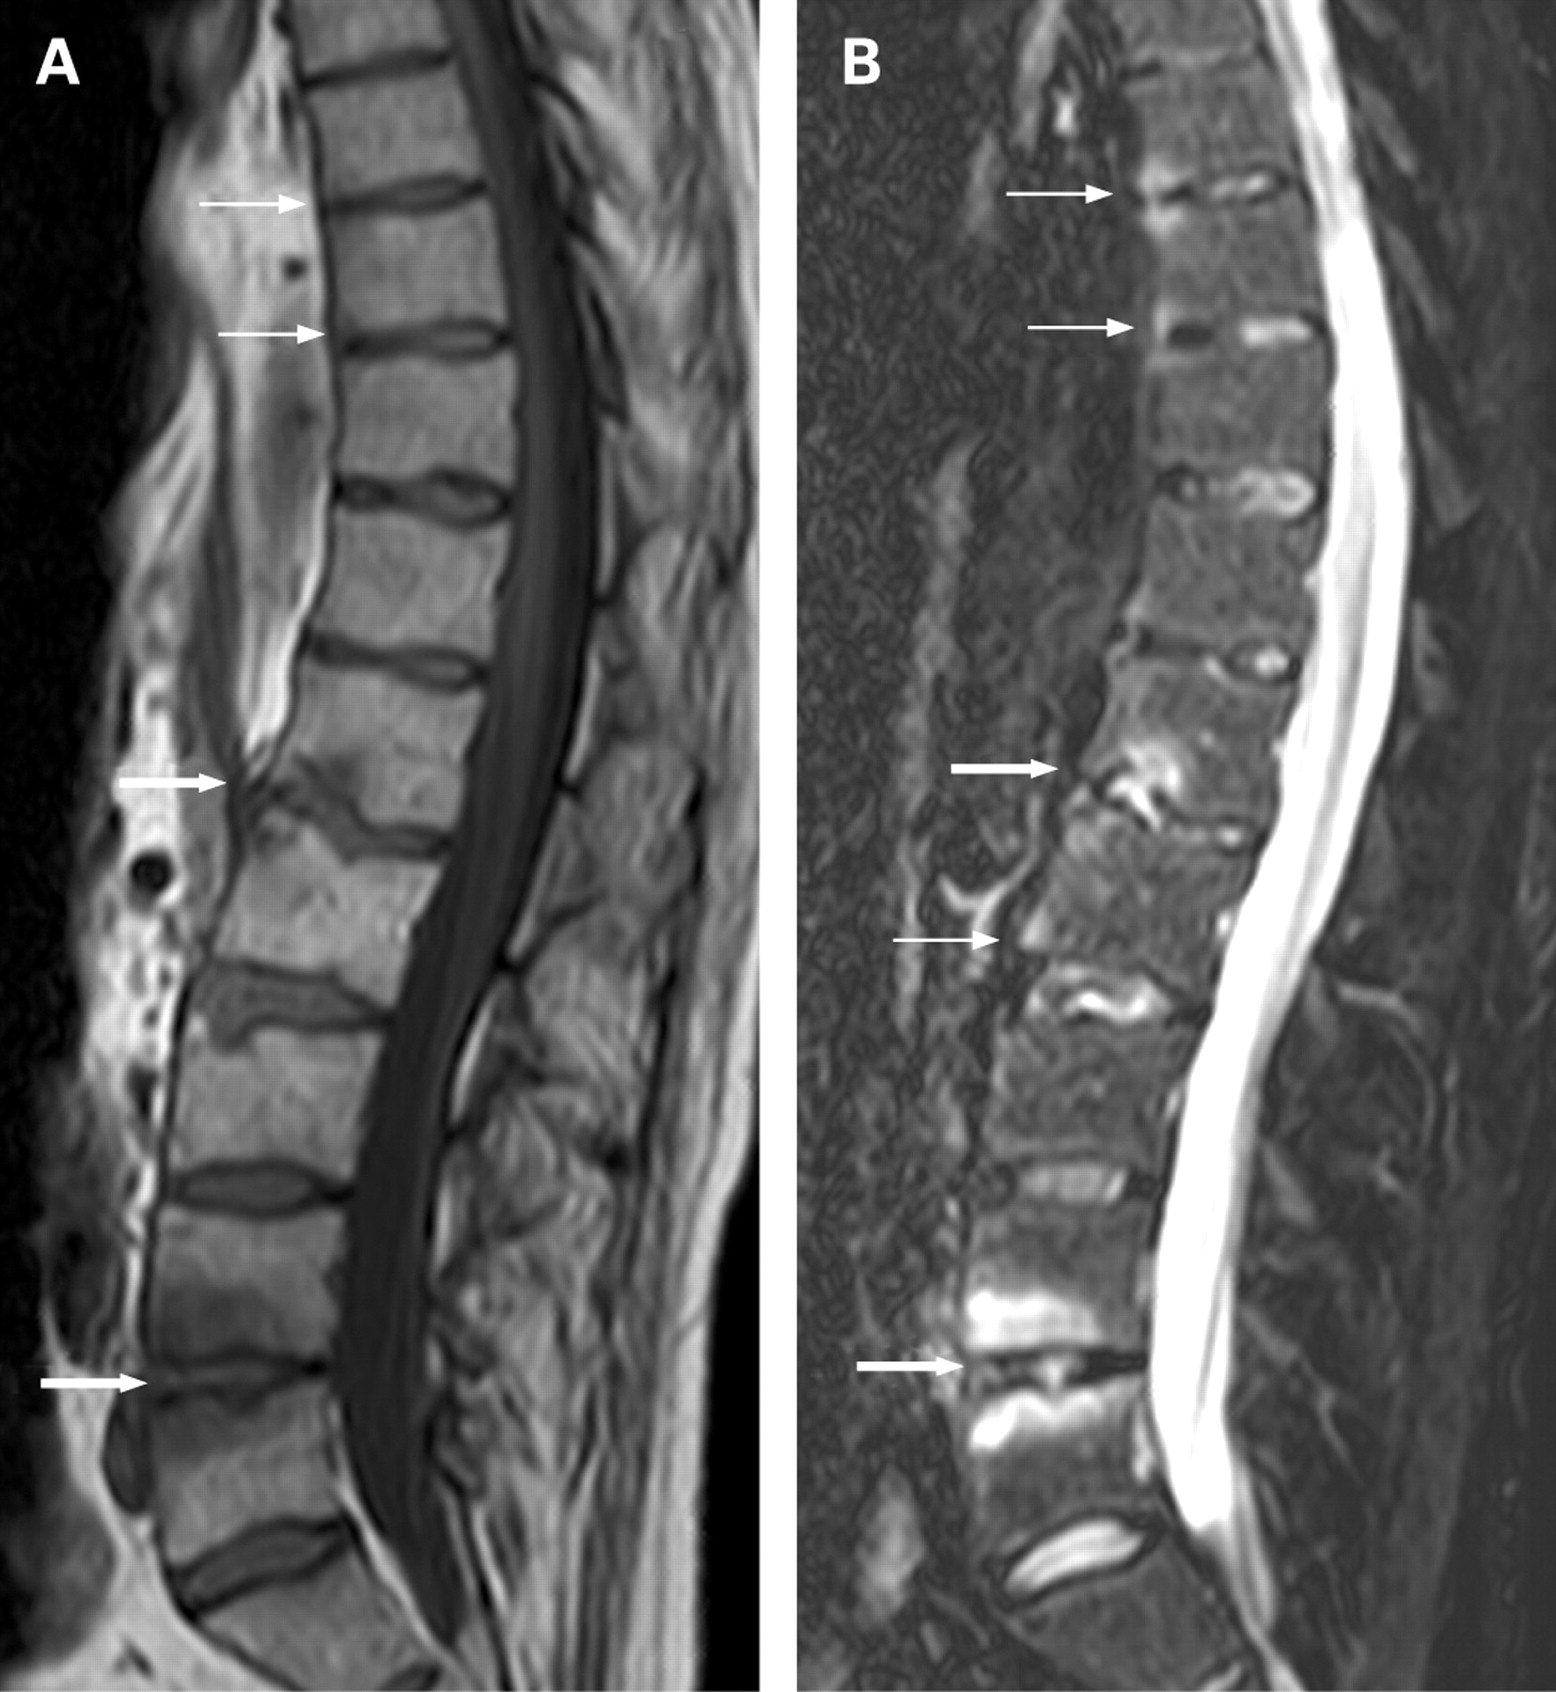
A. T1 sequence. B. Short tau inversion recovery (STIR) sequence. Thin arrows, spondylitis anterior; bold arrows, spondylodisciitis (Andersson lesion), erosions of vertebral body endplates surrounded by oedema. Bone marrow oedema is represented by hypointensive signal in the T1 sequence and hyperintensive in the STIR sequence.

A. T1 pre-gadolinium sequence. B. Short tau inversion recovery (STIR) sequence. Bold arrow, spondylitis posterior in the atlas of a patient with ankylosing spondylitis, shown as hypointensity in T1 pre-gadolinium and as hyperintensity in STIR MRI. Thin arrows, fatty degeneration shown as hyperintensity in the T1 pre-gadolinium and as hypointensity in the STIR sequence.

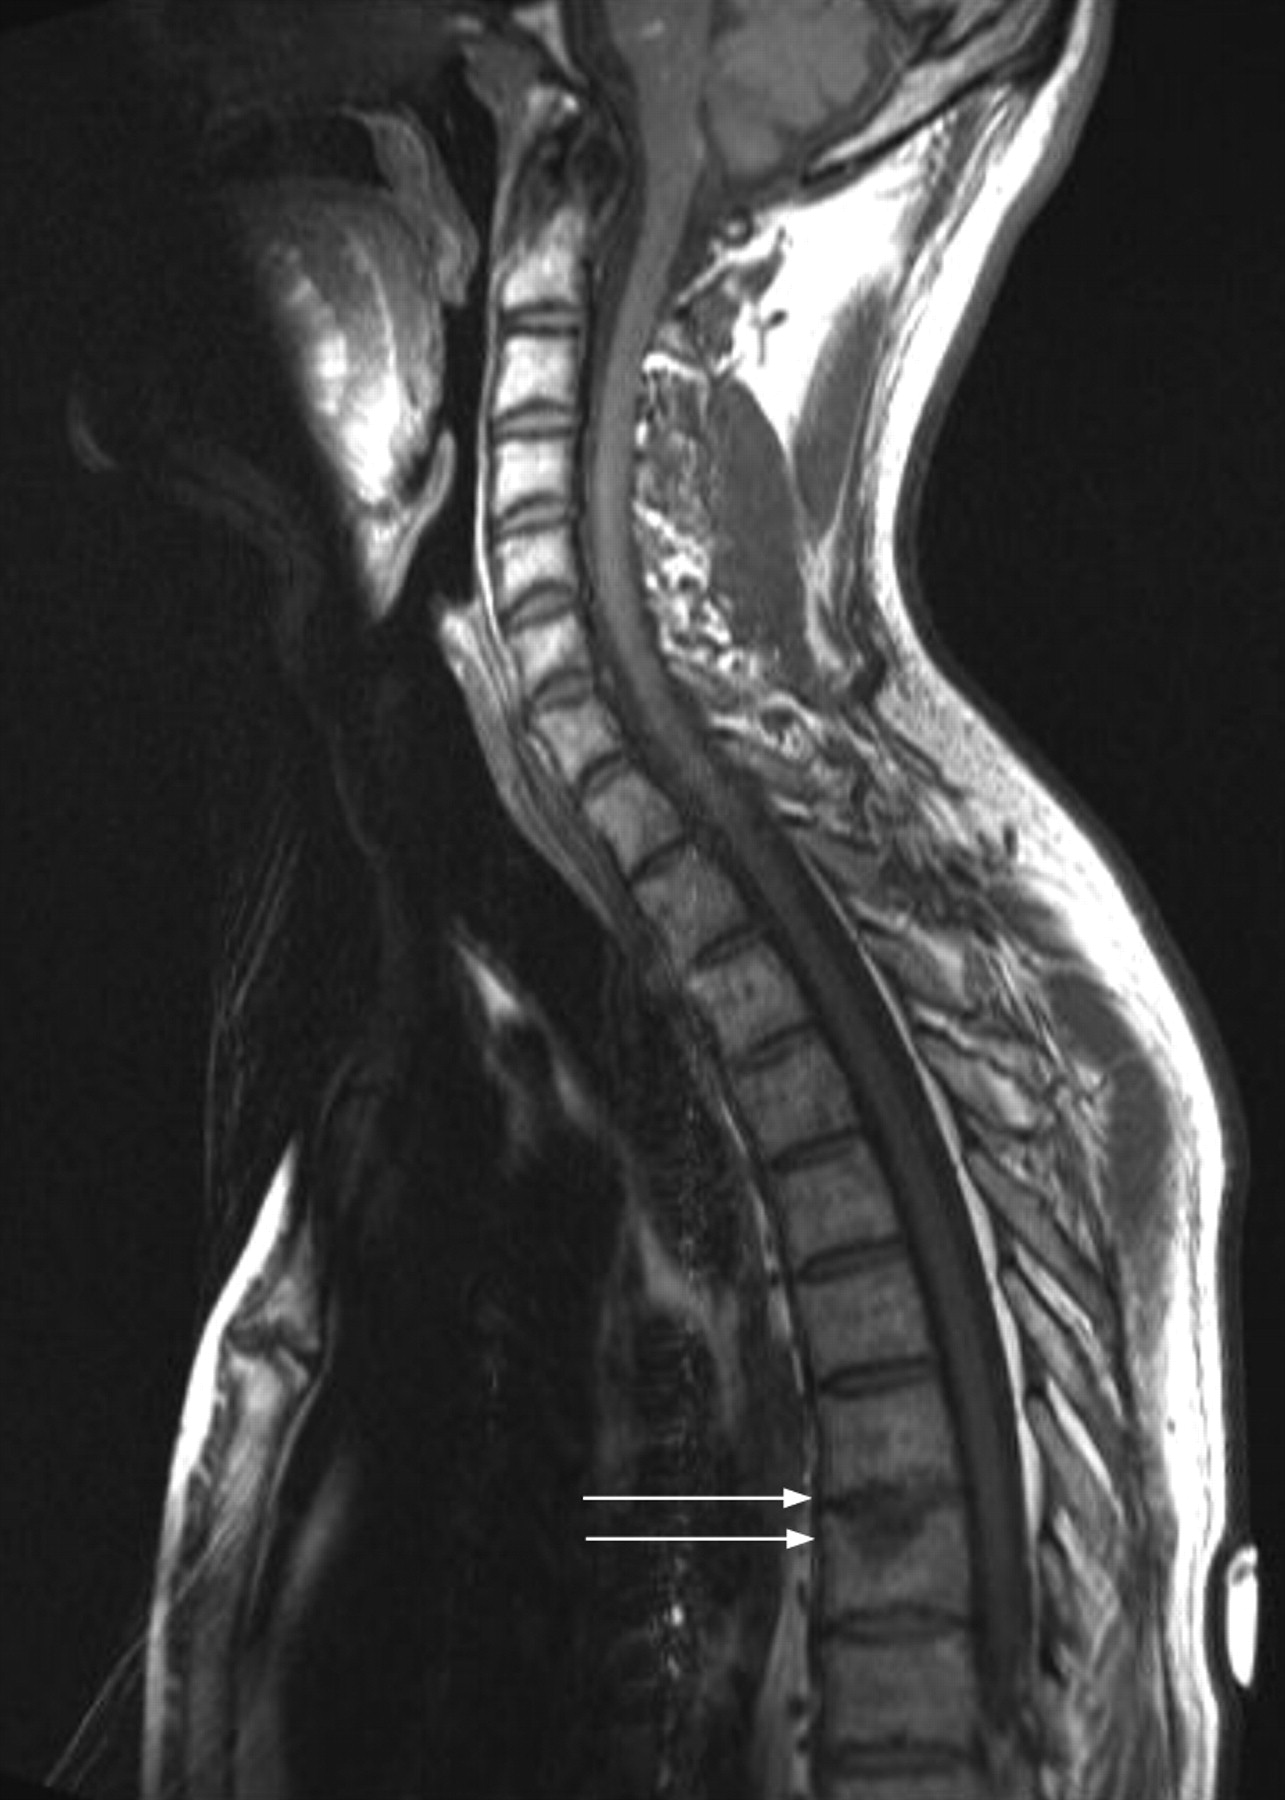
Ankylosis (arrows) in the cervical and the thoracic spine is better seen in the T1 sequence (A) than in the short tau inversion recovery (STIR) sequence (B).

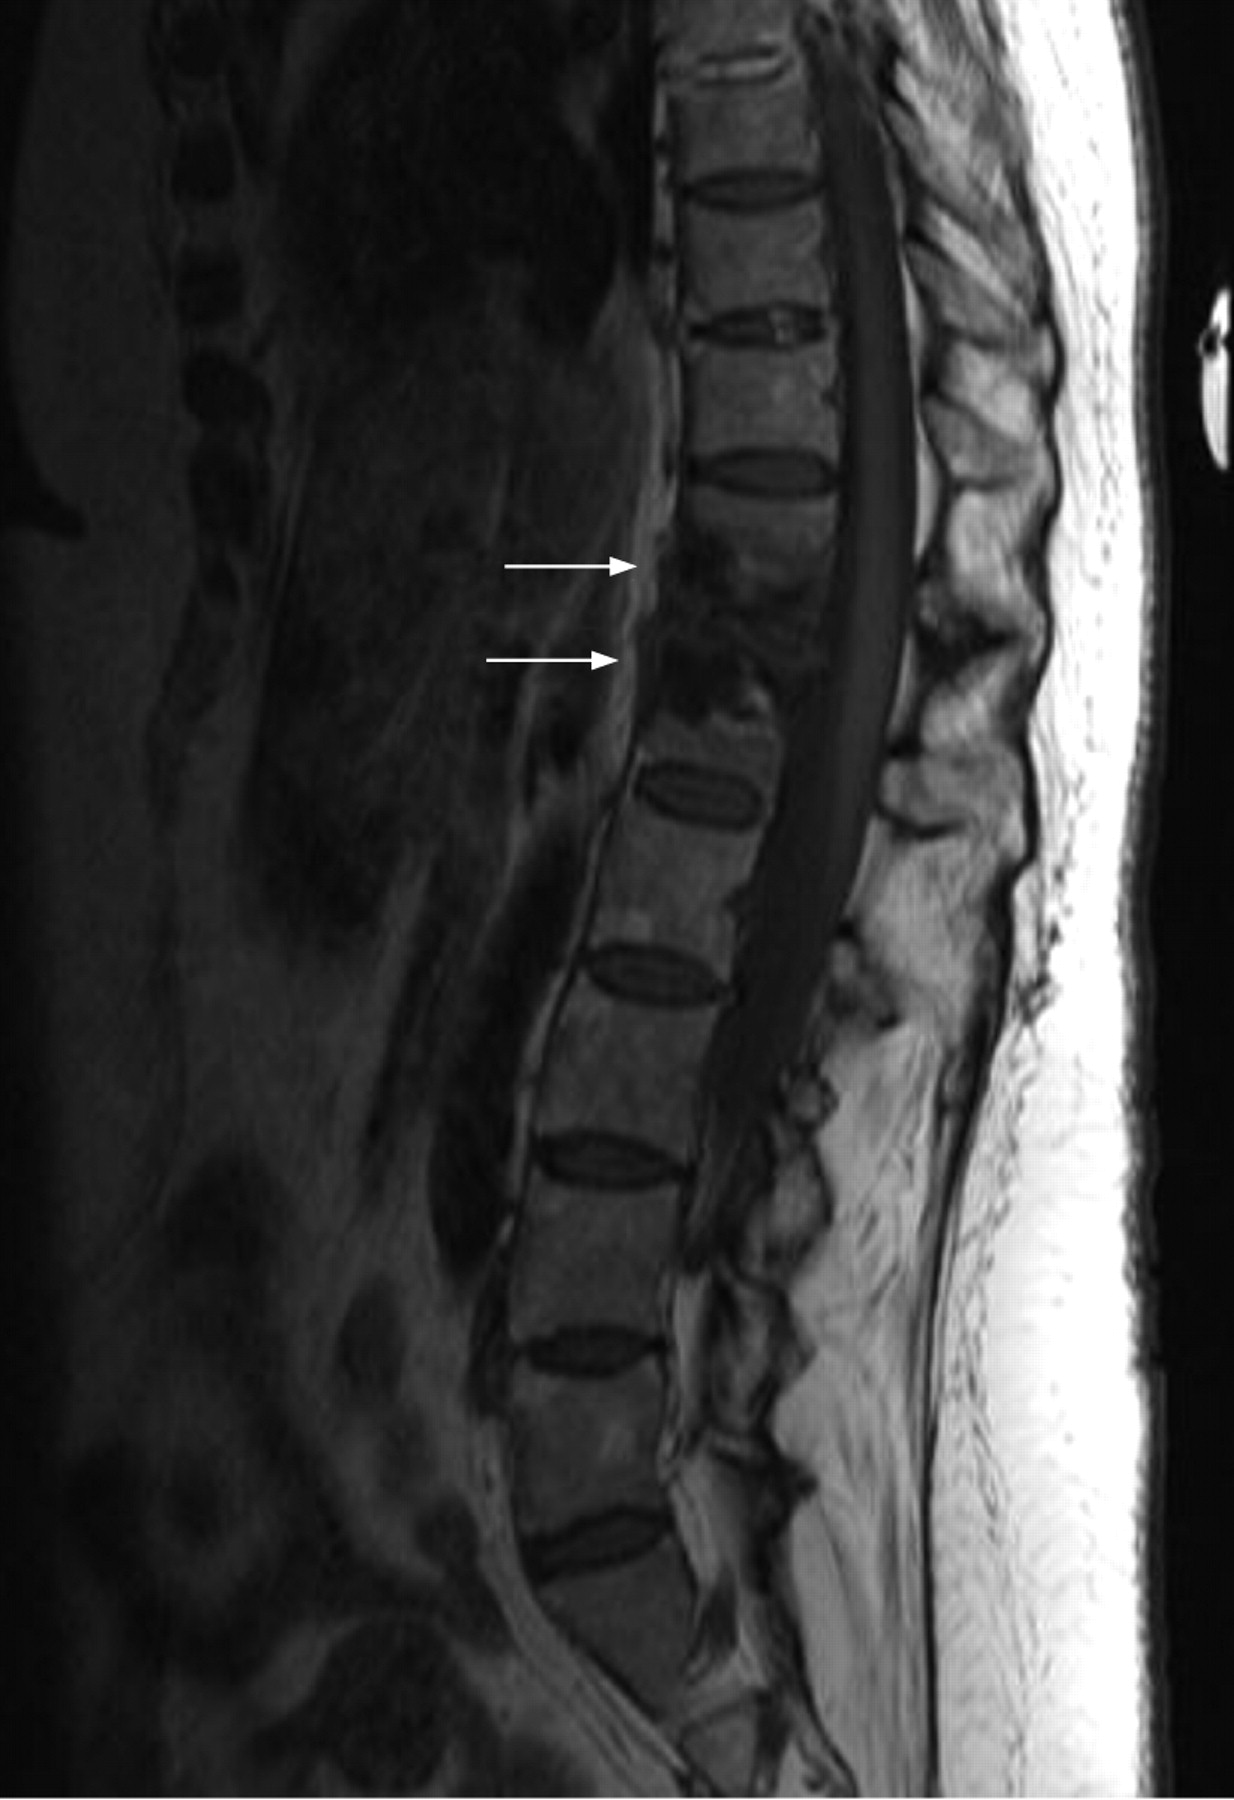
A. T1 sequence. B. Short tau inversion recovery (STIR) sequence. Bold arrow, fatty degeneration (suggested to be post-inflammatory) in the posterior edge of a vertebra shown as hyperintensity in the T1 sequence. Thin arrow, spondylitis anterior seen as hyperintensity in the STIR sequences.

Typical active Andersson lesion as a characteristic sign in a patient with ankylosing spondylitis: T1 post-gadolinium MRI sequence.

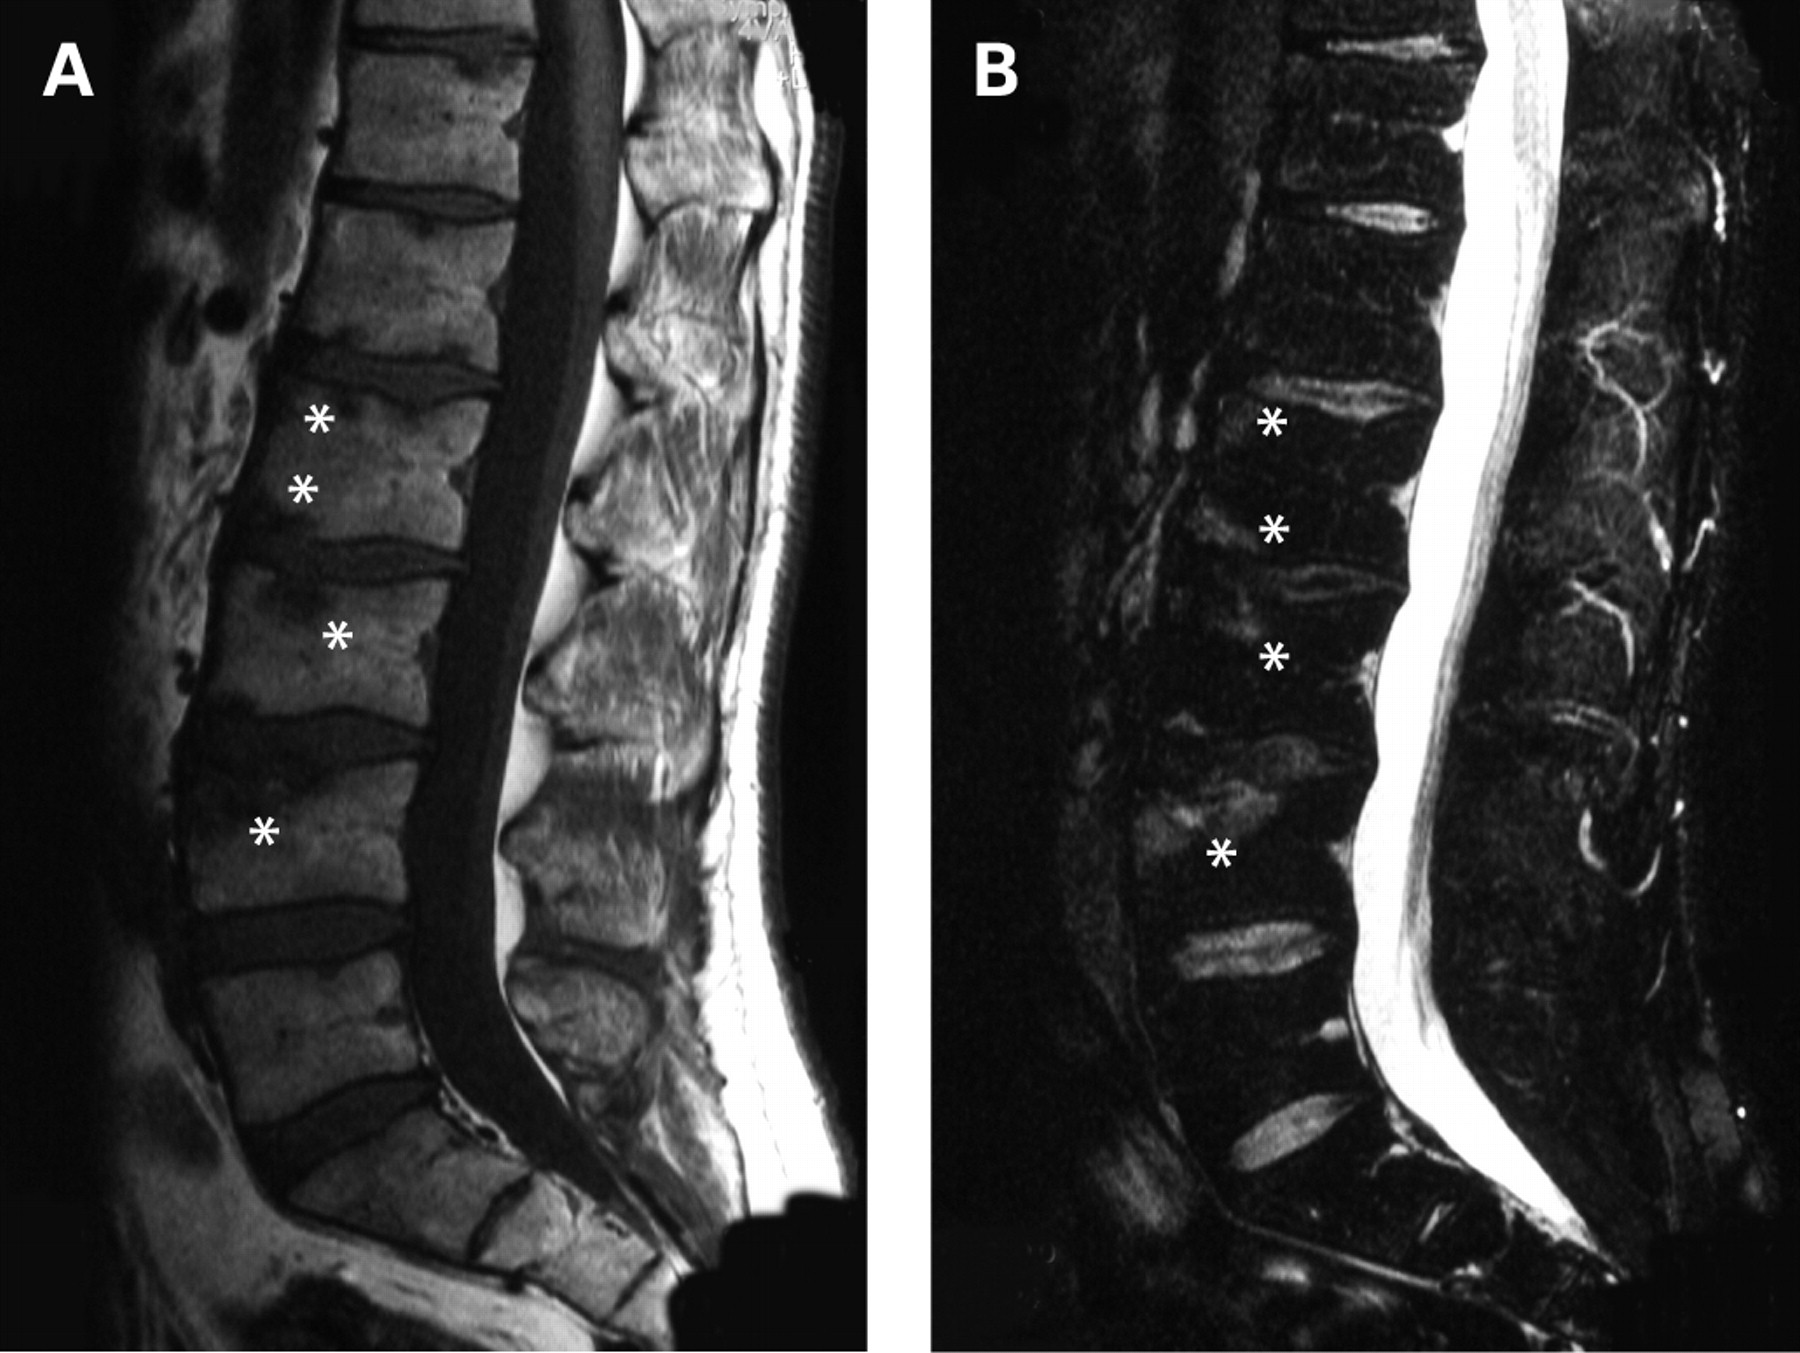
Bone marrow oedema (asterisks). (A) Hypointense in T1-weighted sequence and (B) hyperintense in short tau inversion recovery (STIR).

Bone marrow oedema of a whole vertebral body and adjacent vertebrae (short tau inversion recovery (STIR)).

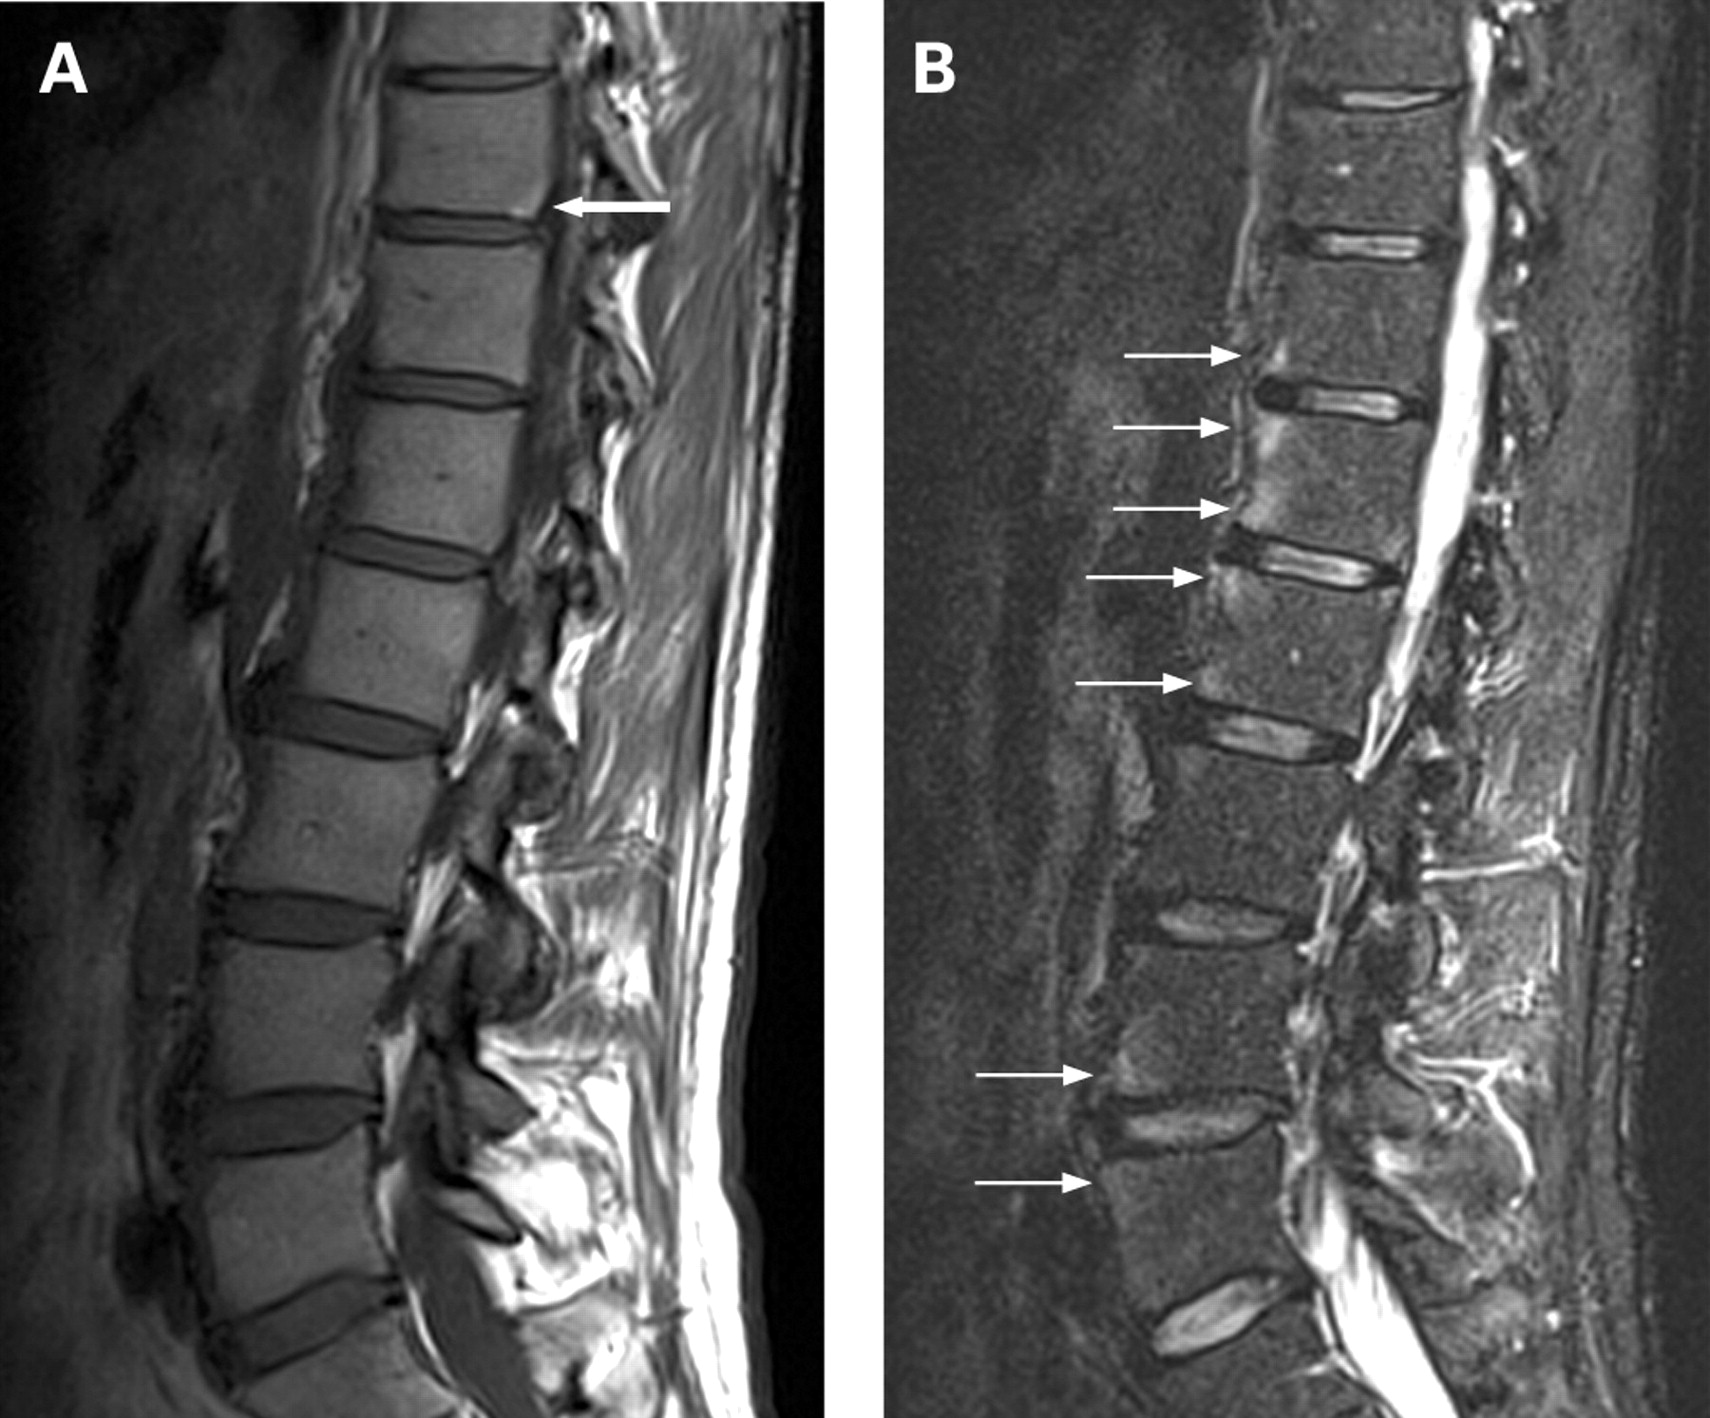
Arrows represent bone marrow oedema at different sites of vertebral bodies (short tau inversion recovery (STIR)).

A. T1-sequence. B. Short tau inversion recovery (STIR) sequence. Thin arrows, fatty degeneration in the posterior edges of the vertebrae. Bold arrow, chronic spondylodisciitis (Andersson lesion) represented by erosions of vertebral body endplates surrounded by areas of fat infiltration (hyperintense in the T1 sequence and hypointense in the STIR sequence). Arrowhead, acute spondylodisciitis represented by inflammatory bone marrow oedema (hyperintense in the STIR sequence and hypointense in the T1 sequence).

Active inflammation (bone marrow oedema) of facet (bold arrows) and costovertebral (arrow heads) joints and active spondylitis posterior (thin arrows). Short tau inversion recovery (STIR) sequence.

A. Sagittal short tau inversion recovery (STIR) sequence of thoracic spine demonstrating bone marrow oedema (arrow) in the lateral portion of the vertebral body and in the pedicle. B. Transverse T1-weighted turbo spin-echo sequence with fat saturation after contrast medium administration. Arthritis of the costovertebral joint T9 can be seen on the right (arrow). Increased signal intensity in the joint cleft, the head of the ninth rib and the bone marrow of the vertebral body on the right side indicates oedema formation (arrowheads). In addition, the adjacent soft tissue also shows increased signal intensity.

A. T1-sequence. B. Short tau inversion recovery (STIR) sequence. Active spondylitis posterior and extensive inflammation involving facet and costovertebral joints (hyperintense in the STIR sequence and hypointense in the T1 sequence; bold arrows). Fatty degeneration (hyperintense in T1 sequence; thin arrows).
Non-corner bone erosions (Andersson lesion) (arrow) of vertebral bodies (T1-weighted sequence).

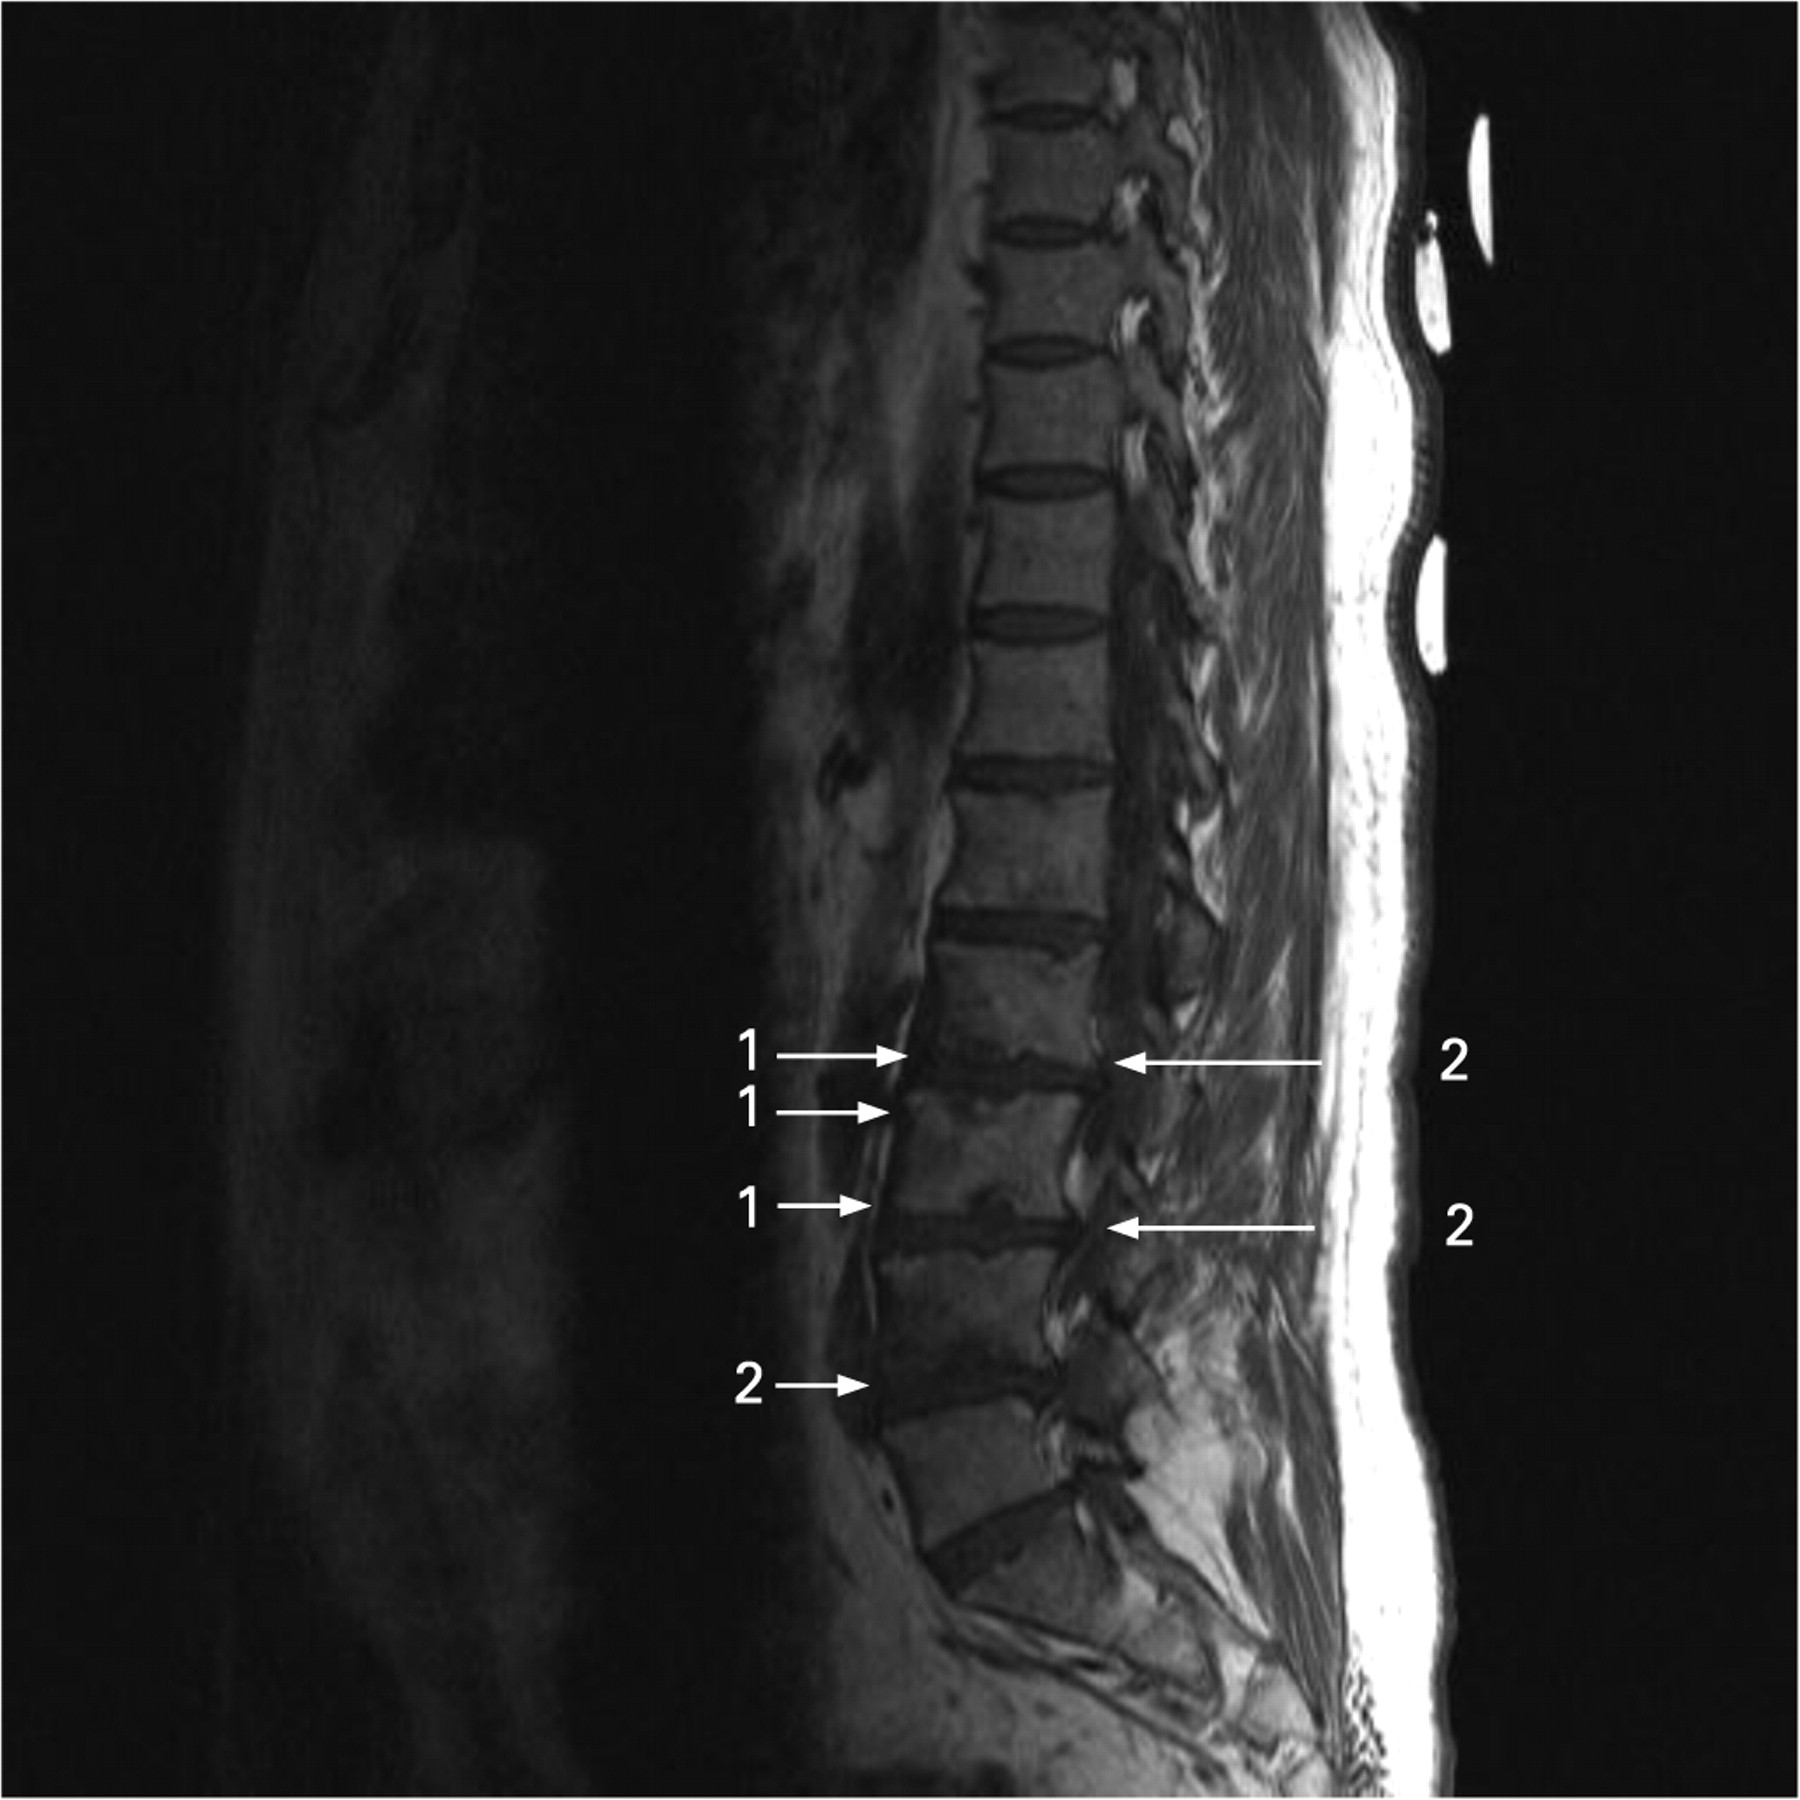
1: Corner bone erosions (spondylitis anterior); 2: non-corner bone erosions (Andersson lesion) of vertebral bodies (T1-weighted sequence).
Insufficiency fracture as a consequence of chronic spondylodisciitis (Andersson II lesion) (arrows) in ankylosing spondylitis (T1-weighted sequence).

Post-inflammatory fatty changes (arrows) of vertebral bodies (T1-weighted sequence).

Inflammation of a costovertebral joint in the thoracic spine of a patient with ankylosing spondylitis (arrow): (A) T1-weighted sequence, (B) short tau inversion recovery (STIR) sequence.

Acute inflammation of zygoapophyseal (facet) joints (arrow) in ankylosing spondylitis (short tau inversion recovery (STIR)).

Pitfalls in assessment of inflammatory spinal lesions by using MRI: (A) T1-weighted sequence, (B) short tau inversion recovery (STIR) sequence. Bold arrow, haemangioma in a typical position and shape. Thin arrows, fatty degeneration as a sign of degenerative lesion.

Pitfalls in assessment of inflammatory spinal lesions by using MRI: (A) T1-weighted sequence, (B) short tau inversion recovery (STIR) sequence. Typical position and shape of a blood vessel (arrow) in the middle of the vertebral body.

Pitfalls in assessment of inflammatory spinal lesions by using MRI: (A) T1 post-gadolinium sequence, (B) short tau inversion recovery (STIR) sequence. In this case, inflammation did not occur on the basis of ankylosing spondylitis but due to a bacterial infection. The definite diagnosis can be made based on the combination of patient history, clinical symptoms and laboratory results. As a typical sign of bacterial spondylodisciitis on MRI, the border between vertebral body and intervertebral disc is disrupted and coalesced (arrow).
Erosive osteochondrosis (Modic lesion) as a typical pitfall of inflammatory lesion when interpreting inflammatory changes in patients with ankylosing spondylitis: (A) T1 pre-gadolinium sequence, (B) T1 post-gadolinium sequence, (C) short tau inversion recovery (STIR) sequence. In the present case, a diagnostic differentiation between ankylosing spondylitis (AS)-specific and non-AS-specific changes, only based on MRI results, is not possible. The diagnostic approach should include patient history, clinical signs and symptoms indicating AS or mechanical back pain, plain radiographs of the sacroiliac joints and laboratory results.

Pitfalls in assessment of inflammatory spinal lesions by using MRI: severe mechanical erosive osteochondritis (Modic lesion) (arrows) (T1-weighted sequence); surrounded by fatty degeneration of the bone marrow L5/S1; (48-year-old man, chronic low back pain for 1 year).
Typical active inflammatory and chronic lesions of the spine in axial spondyloarthritis
Pitfalls in assessment of active inflammatory and chronic spinal lesions
PART C: X RAYS
x Rays of sacroiliac joints and spine have been used since the 1930s for diagnosis and staging of patients with AS. In contrast to MRI, x rays can only detect chronic bony changes (damage), which are the consequence of inflammation and not inflammation itself. Therefore, x rays are not suitable for early diagnosis of spondyloarthritis but are still the method of choice for the detection of chronic changes, and as such are widely used for diagnostic purposes in patients with already established disease (modified New York criteria for SI joints). Chronic changes of the spine, especially syndesmophytes, are not part of current classification or diagnostic criteria for AS because the disease nearly always starts in the SI joints, and the presence of spinal syndesmophytes with radiologically normal SI joints is a rare, although possible, event. While early destructive changes such as erosions can also be seen by x rays, this method is mostly superior to MRI for the detection of new bone formation such as ankylosis and syndesmophytes.
Different approaches have been proposed for the radiological investigation of the SI joints with the intention to get an optimal view of this irregularly-shaped joint. None of them have been shown to be clearly superior. ASAS recommends performing x rays of the whole pelvis because this allows the assessment of the hip joints as well as the SI joints, which are relatively frequently affected in spondyloarthritis. In order to show a clearer view of the SI joints, in most of the images in this handbook the hip joints are not shown. Regarding the spine, x rays of the cervical and lumbar spine should be performed. Although changes in the thoracic spine are frequent, they are more difficult to detect because of the overlying lung tissue and therefore radiographs of the thoracic spine are not routinely assessed. The preferred method for scoring chronic changes of the spine in clinical studies, the modified Stoke Ankylosing Spondylitis Spinal Score (mSASSS), investigates only lateral views of the cervical and lumbar spine.
Other imaging techniques
Scintigraphy has been used for many decades for the detection for active inflammation in patients with SpA, but no longer plays a role in diagnosis and management of patients with SpA because of limited sensitivity and specificity13 and has been replaced by MRI. Chronic bony changes can be better detected by computed tomography (CT) in comparison to x rays. However, CT is rarely used because of a much higher radiation exposure. It can be helpful in the differential diagnosis of diffuse idiopathic skeletal hyperostosis (DISH, or Forestier disease; see fig 40). Active inflammatory changes can also not be seen by CT, and fatty degeneration of the bone marrow (as an early sign of chronic changes) is only detectable by MRI and not by CT. It has to be seen in the future whether MRI, as another tomography technique, can replace CT in the assessment of chronic bony changes. Therefore, images of scintigraphy and CT (only exception: fig 40) have not been included in this handbook.
X RAYS OF THE SACROILIAC JOINTS IN PATIENTS WITH SPONDYLOARTHRITIS
Box 22 Radiological criterion according to the modified New York criteria for AS (1984)3 (see also Part A, Box 1)
Sacroiliitis grade ⩾2 bilaterally or grade 3–4 unilaterally.
Box 23 Grading of radiographic sacroiliitis (1966)14
Grade 0: normal.
Grade 1: suspicious changes.
Grade 2: minimal abnormality—small localised areas with erosion or sclerosis, without alteration in the joint width.
Grade 3: unequivocal abnormality—moderate or advanced sacroiliitis with one or more of: erosions, evidence of sclerosis, widening, narrowing, or partial ankylosis.
Grade 4: severe abnormality—total ankylosis.

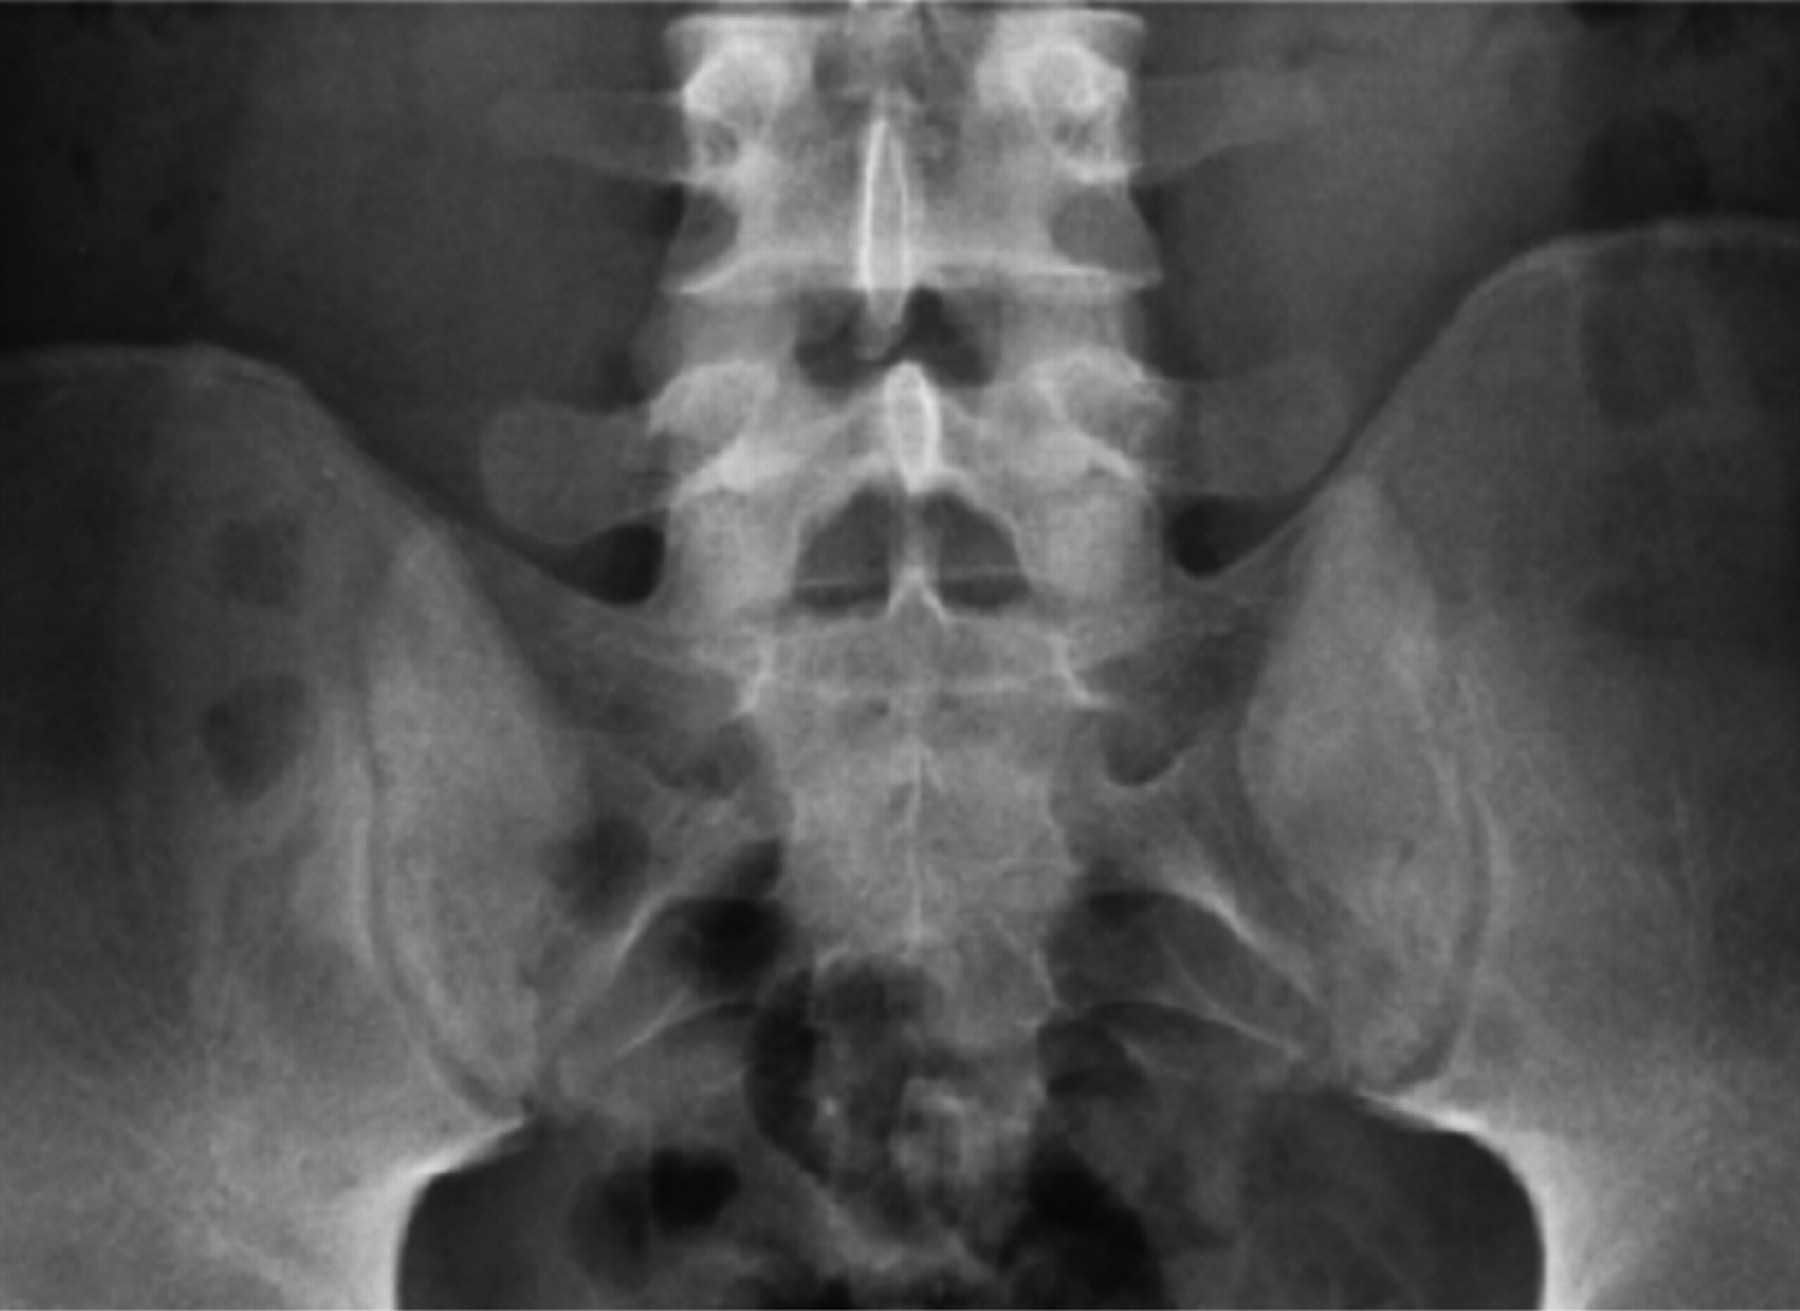
Normal sacroiliac (SI) joints at both sides with sharp joint margins, no sclerosis or erosions.

Both joints show irregular joint space without sclerosis or well defined erosions (grade 1 bilaterally).

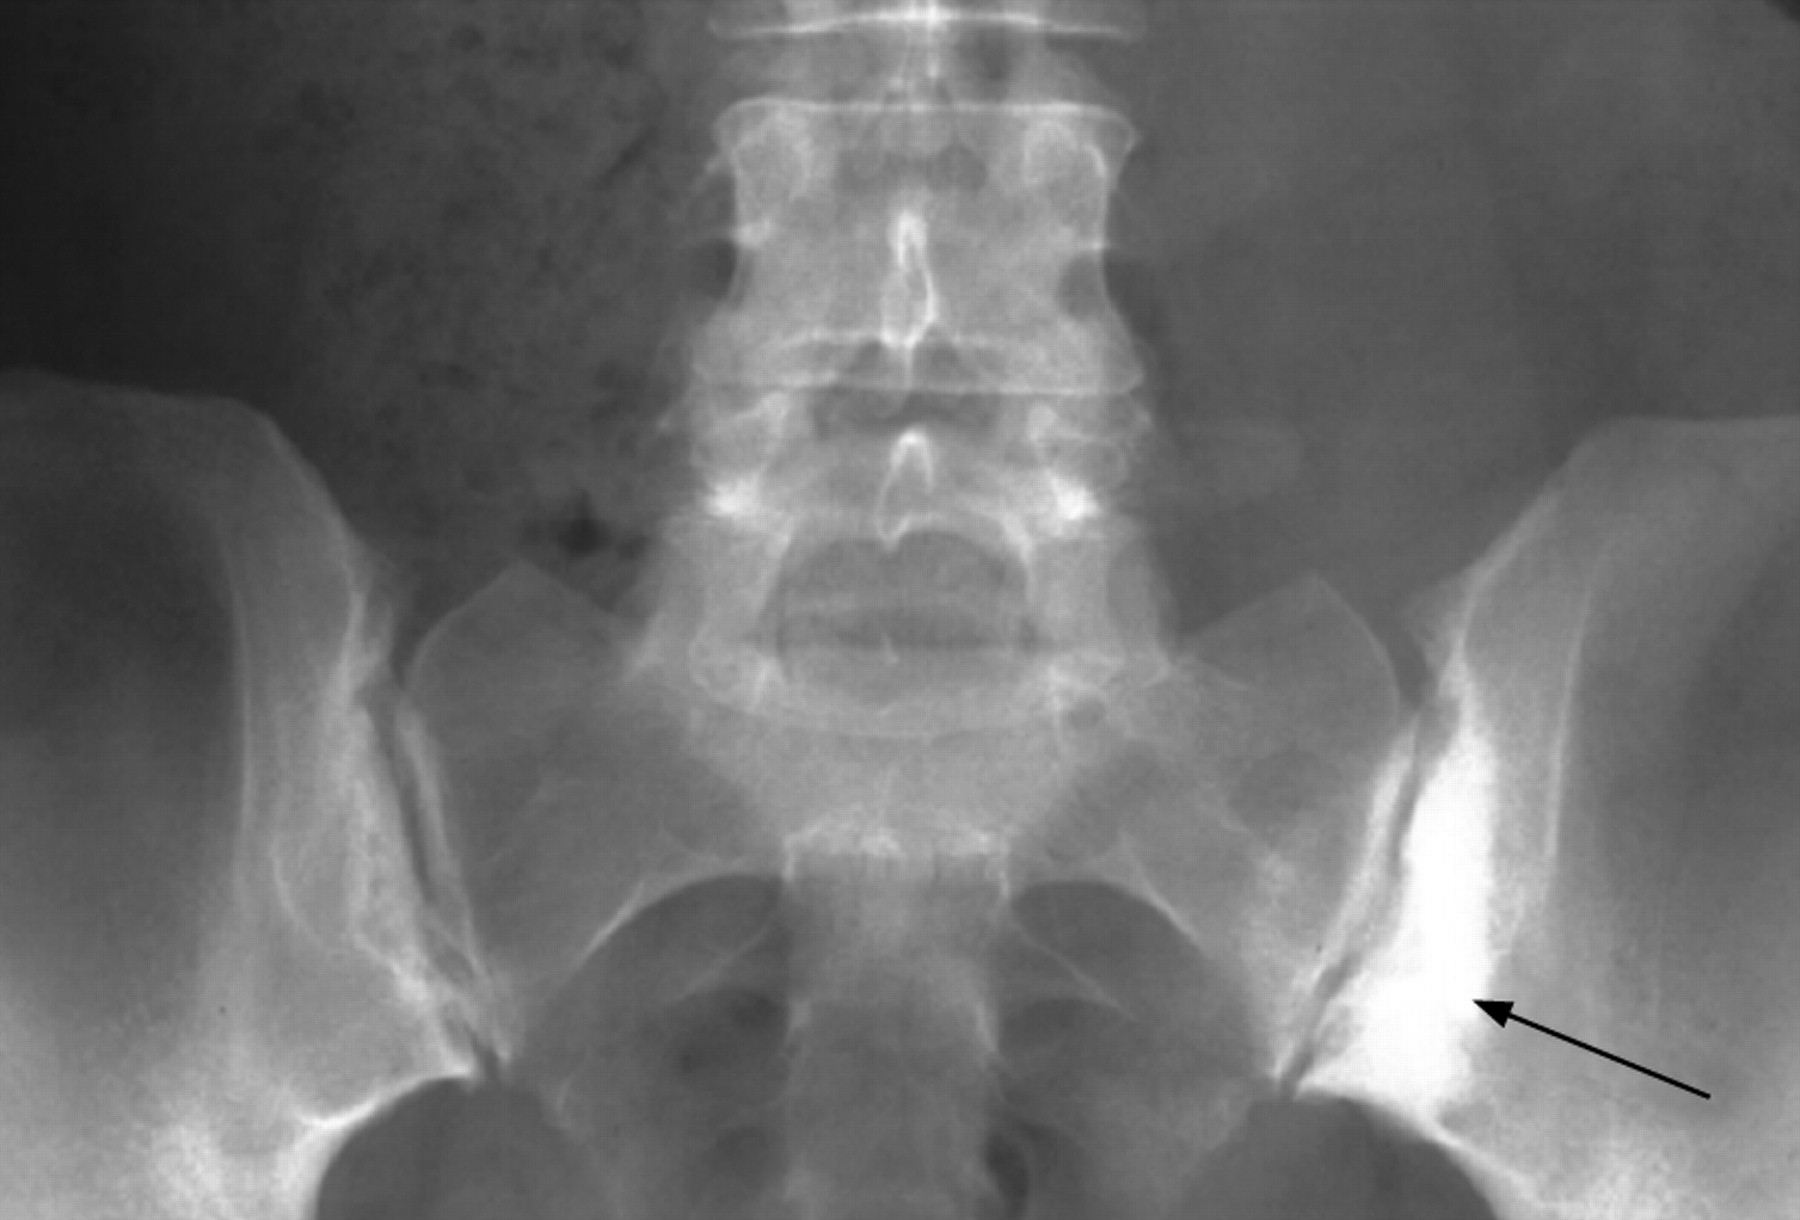
The left sacroiliac (SI) joint does not show specific changes but the joint does not appear completely normal (grade 1). At the site of the arrow at the right SI joint there is a minimal erosion and minimal sclerosis and ill defined margins at the iliac side of the joint (grade 2).

Both sacroiliac (SI) joints show ill-defined margins, sclerosis, and especially at the left SI joint an irregular joint space (grade 2 bilaterally).

Sclerosis at the iliac side, widespread erosions, pseudowidening of the joint space, blurring of the joint margins in both sacroiliac (SI) joints (bilateral grade 3).

Both sacroiliac (SI) joints show a complete ankylosis (grade 4 bilaterally). Additionally, the symphysis pubis (horizontal arrow) shows a partial ankylosis. At the insertion of the ligaments at the os pubis there are signs of blurry margins. The left hip shows severe joint space narrowing (vertical arrow), especially at the medial and central part with cyst formation in the acetabulum.

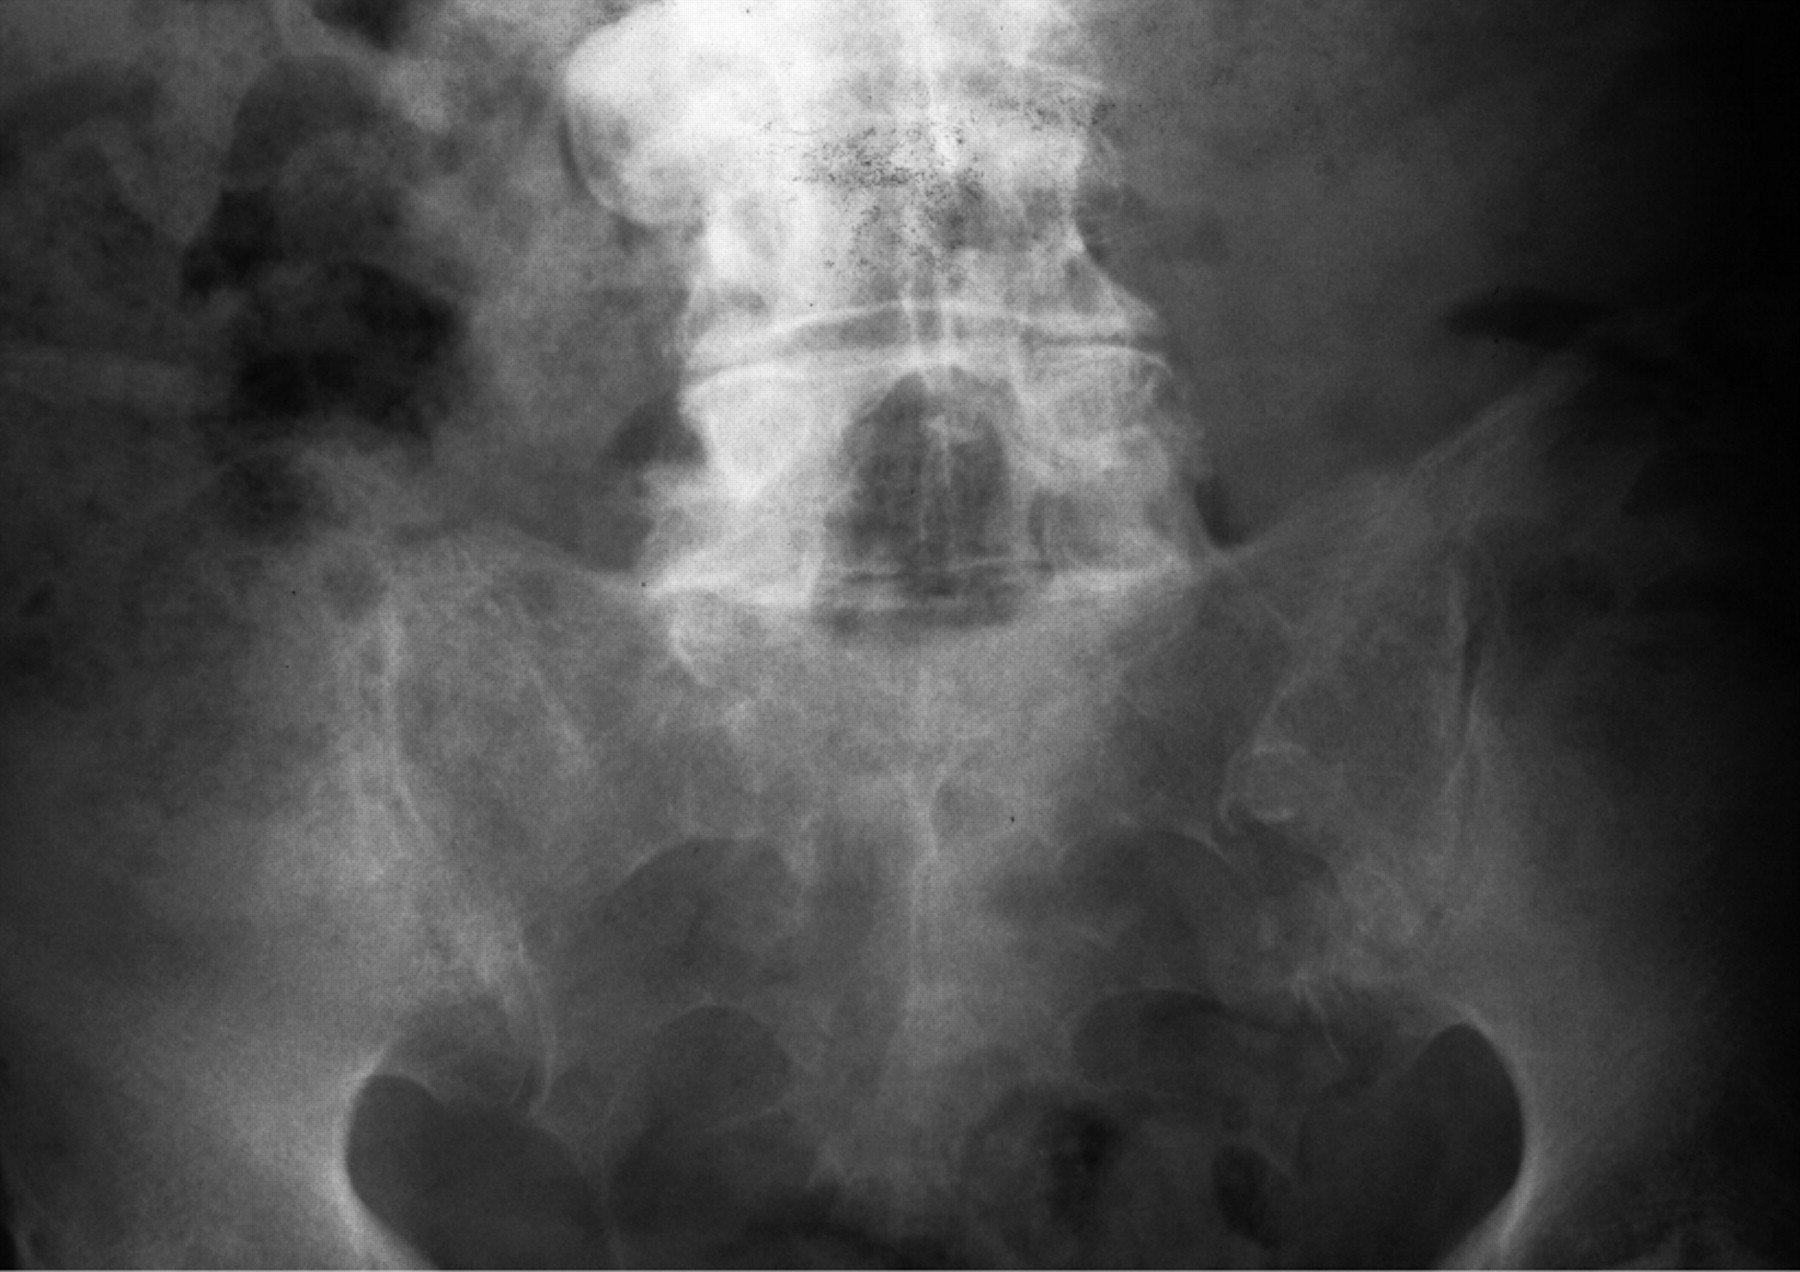
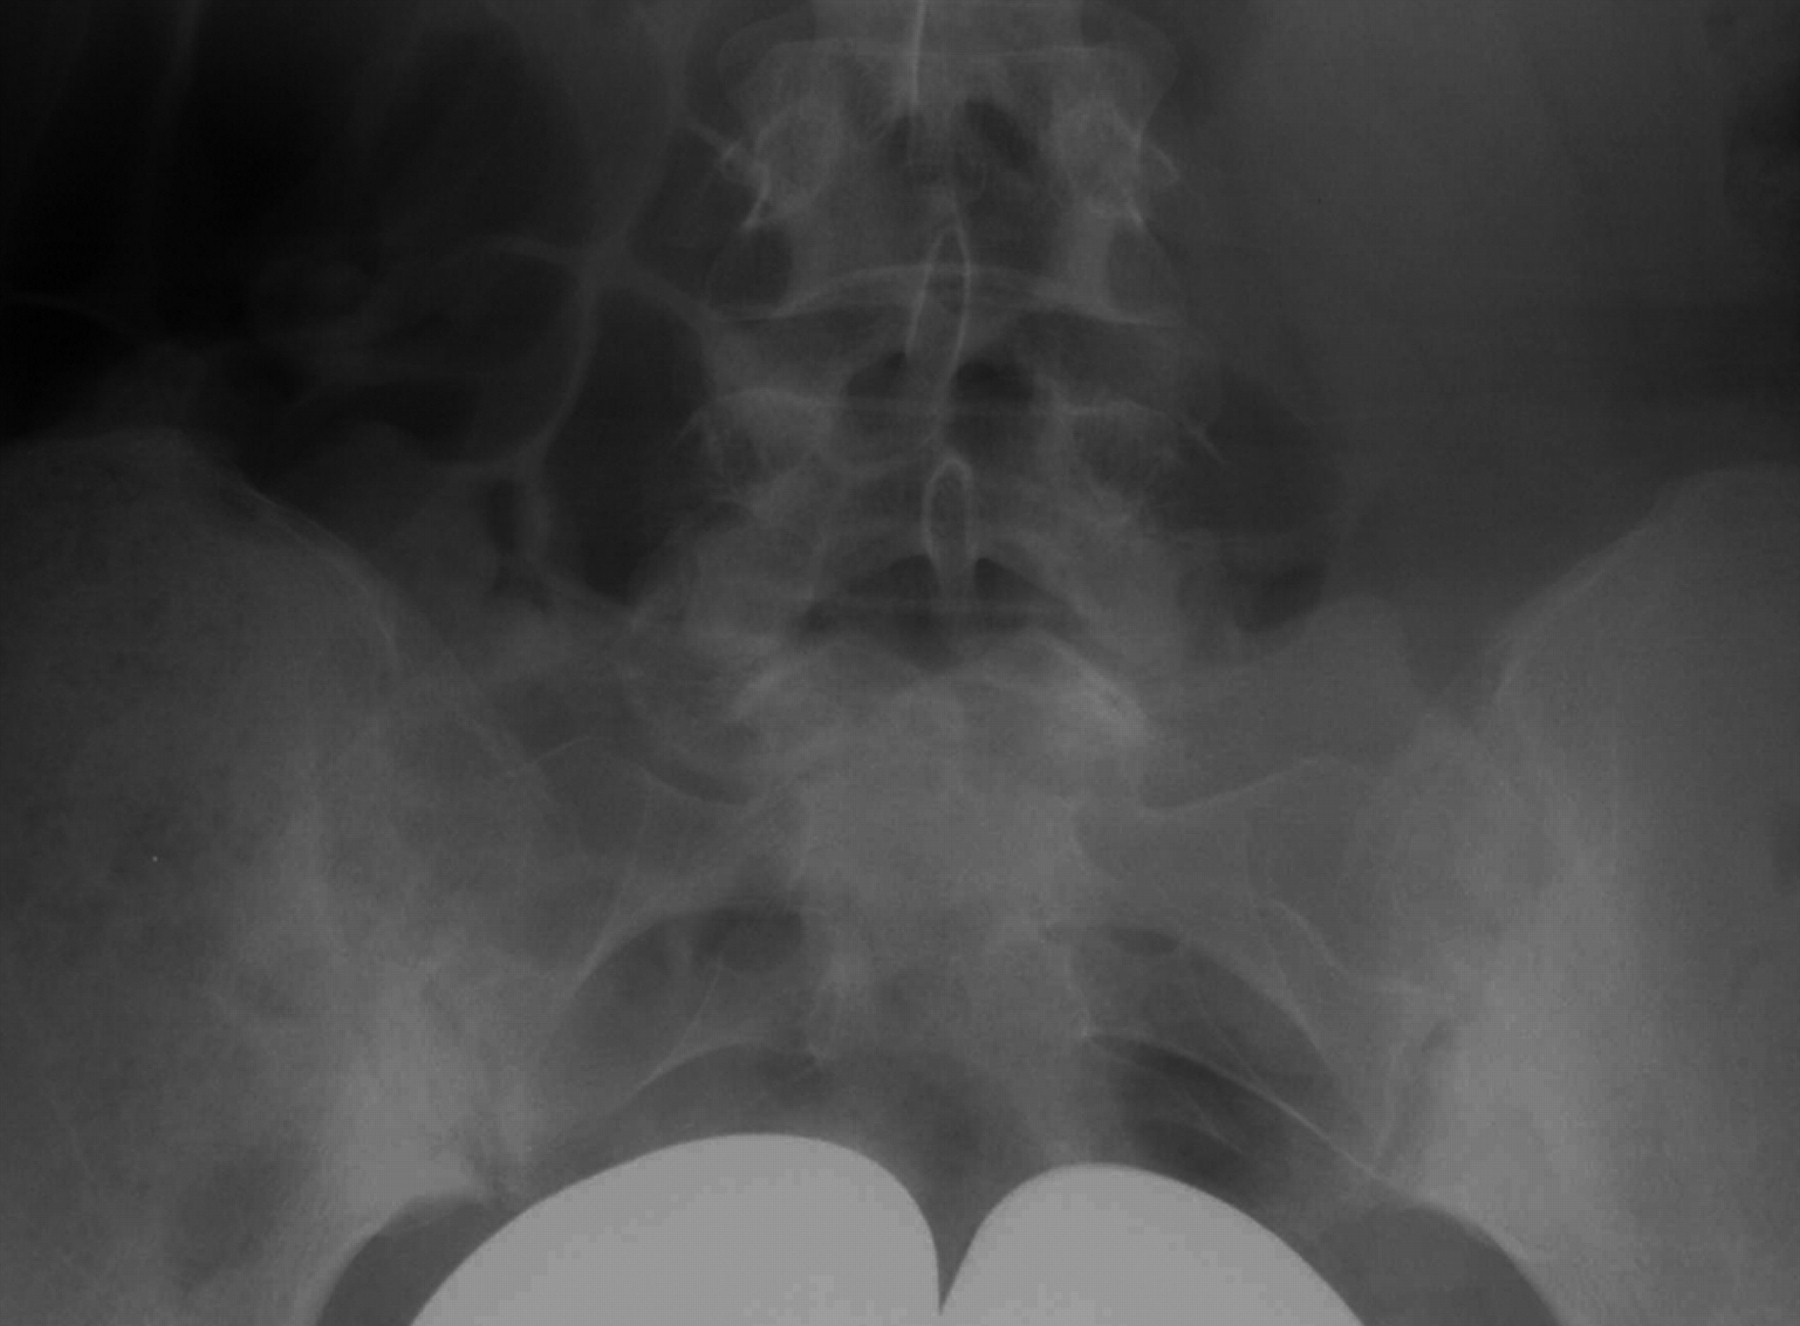
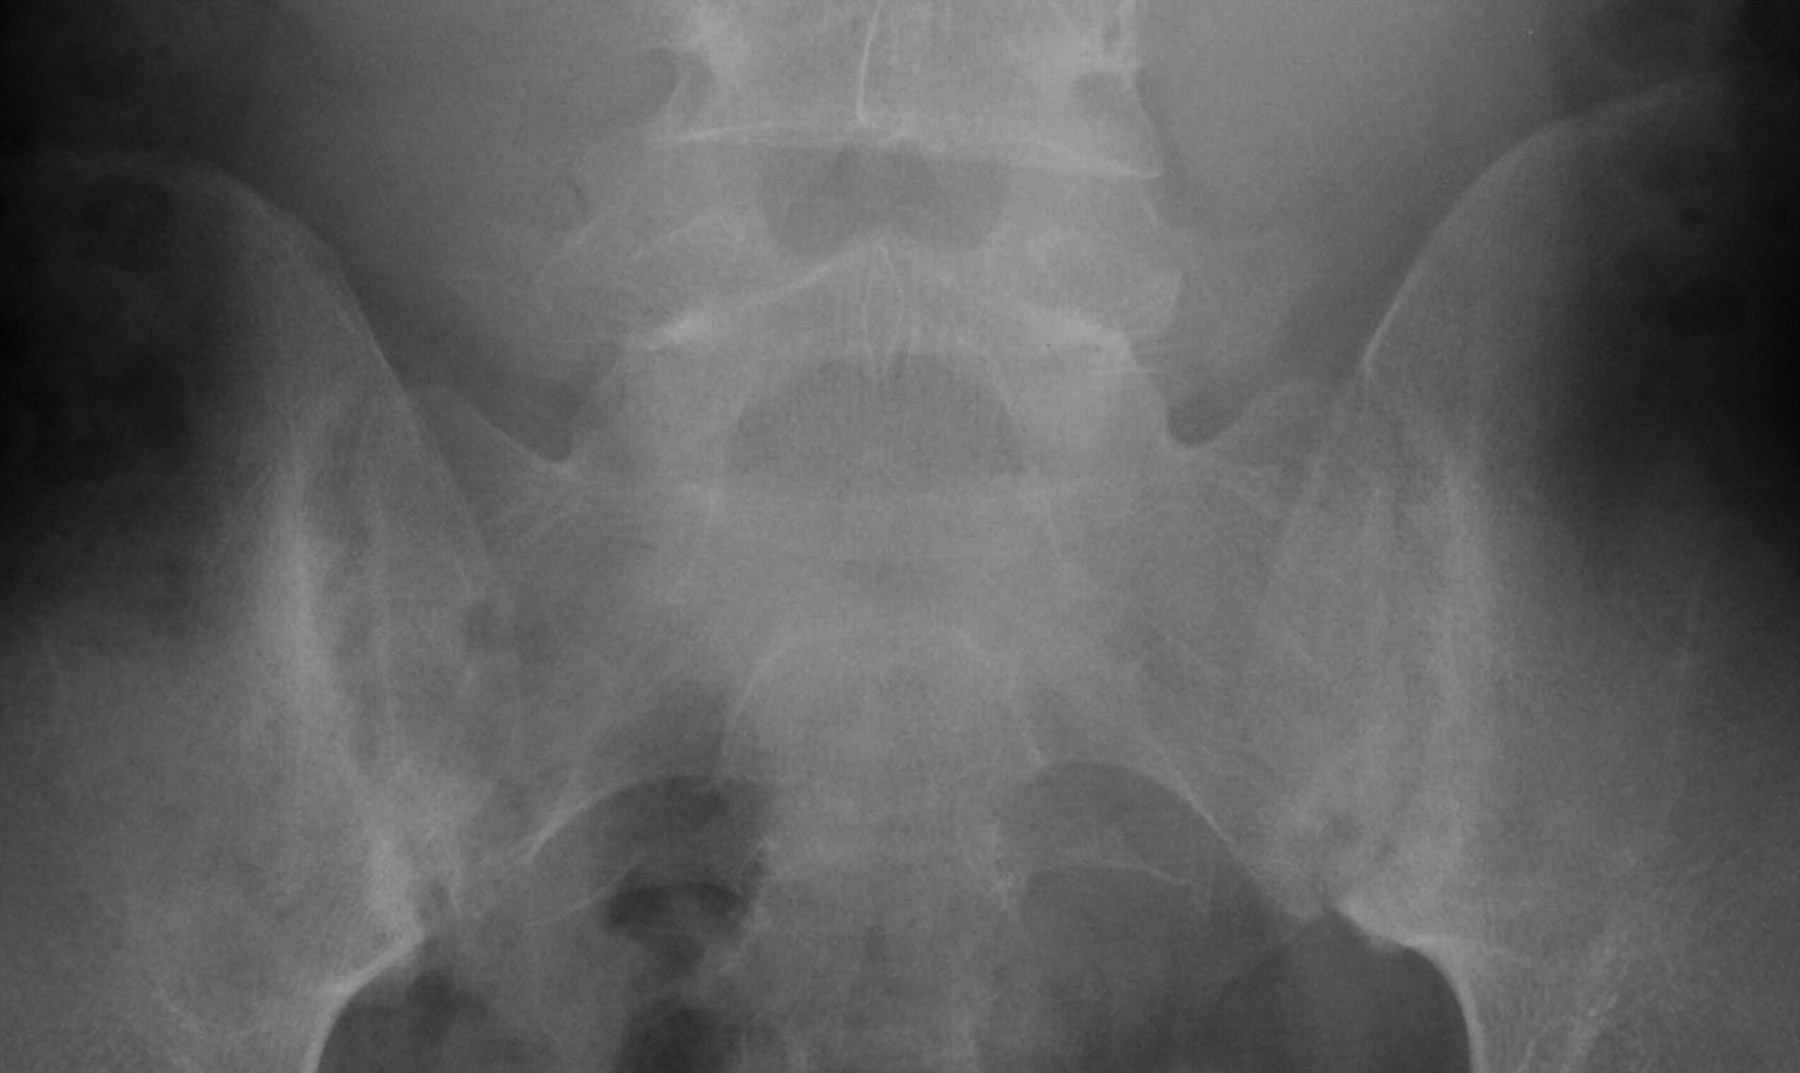
Both sacroiliac (SI) joints show complete ankylosis (grade 4). The lower lumbar vertebrae show syndesmophytes.

Differential diagnosis of ankylosing spondylitis. Extensive sclerosis at the iliac side of both sacroiliac (SI) joints (arrows) with completely normal SI joints. Well defined margins, no erosions, normal width. There is no sacroiliitis but bilateral osteitis condensans ilii.

Differential diagnosis of ankylosing spondylitis. Widespread sclerosis at the iliac side of the left sacroiliac (SI) joints. The SI joints have a normal joint space width and no erosions. Osteitis condensans ilii of the left SI joint (arrow) without sacroiliitis.
Differential diagnosis of ankylosing spondylitis. Irregularly-shaped right sacroiliac joint with bony bridges mimicking sacroliitis with partial ankylosis in an older man with DISH (diffuse idiopathic skeletal hyperostosis).

Differential diagnosis of ankylosing spondylitis. CT of the sacroiliac joint from the same patient with diffuse idiopathic skeletal hyperostosis (DISH) as in fig 39: right sacroiliac joint with calcified anterior joint capsule/ligament (arrow) and relatively normal sacroiliac joint configuration.
Differential diagnosis of ankylosing spondylitis
X RAYS OF THE SPINE IN PATIENTS WITH SPONDYLOARTHRITIS
Vertebral bodies

Typical x ray changes of the spine in ankylosing spondylitis: shiny corners, squaring of the vertebral bodies and syndesmophytes.

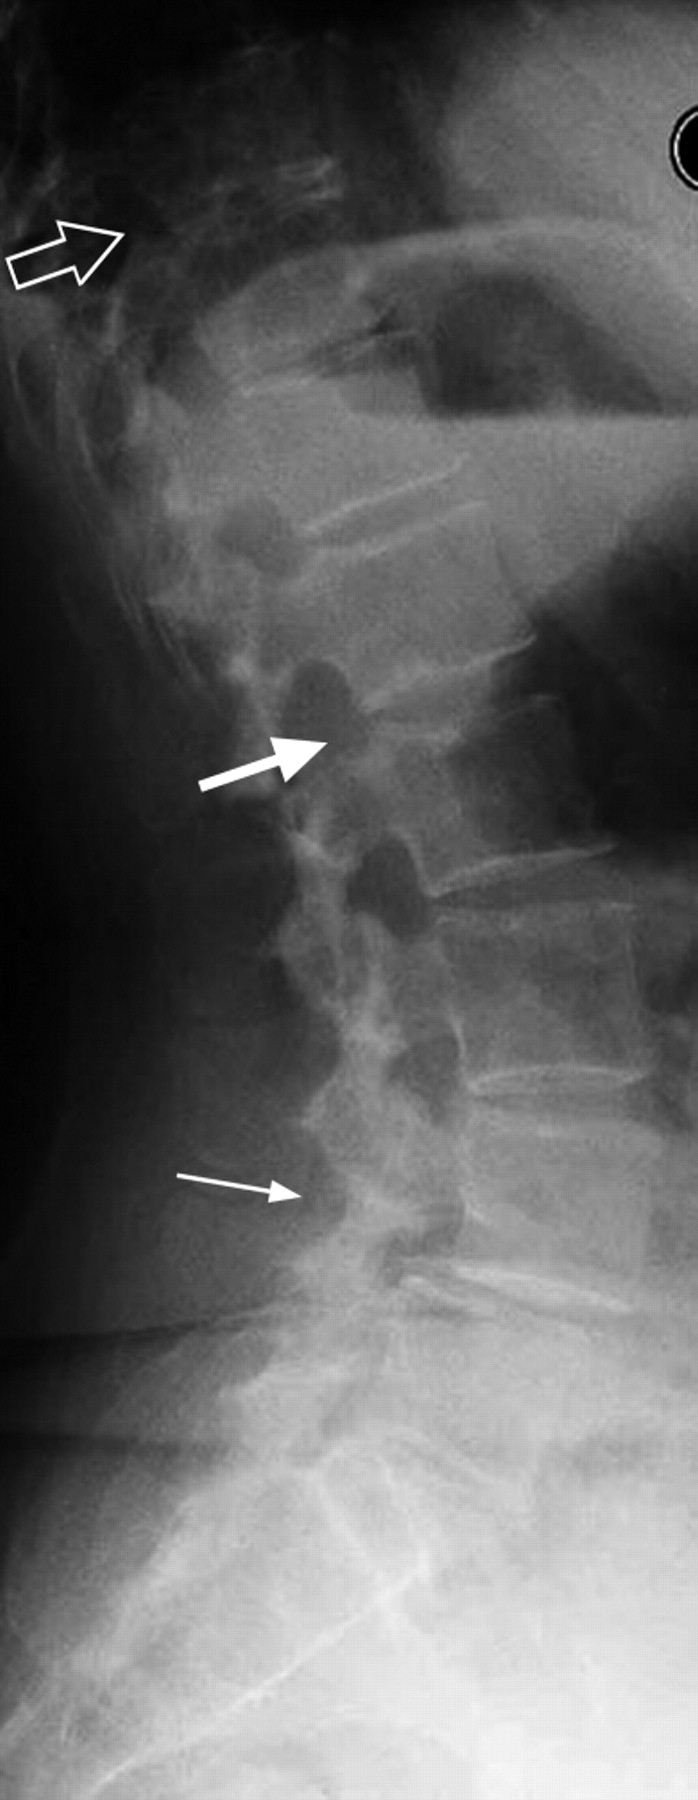
The two panels of the lateral lumbar spine were taken with a 2-year interval. At baseline indicated with a large arrow there is a very small and thin syndesmophyte at the upper corner of lumbar 2. By 2 years later this has evolved to a bridging syndesmophyte. At the sites indicated by the smaller arrows there are already bridging syndesmophytes at baseline but they showed progression over a 2-year period.

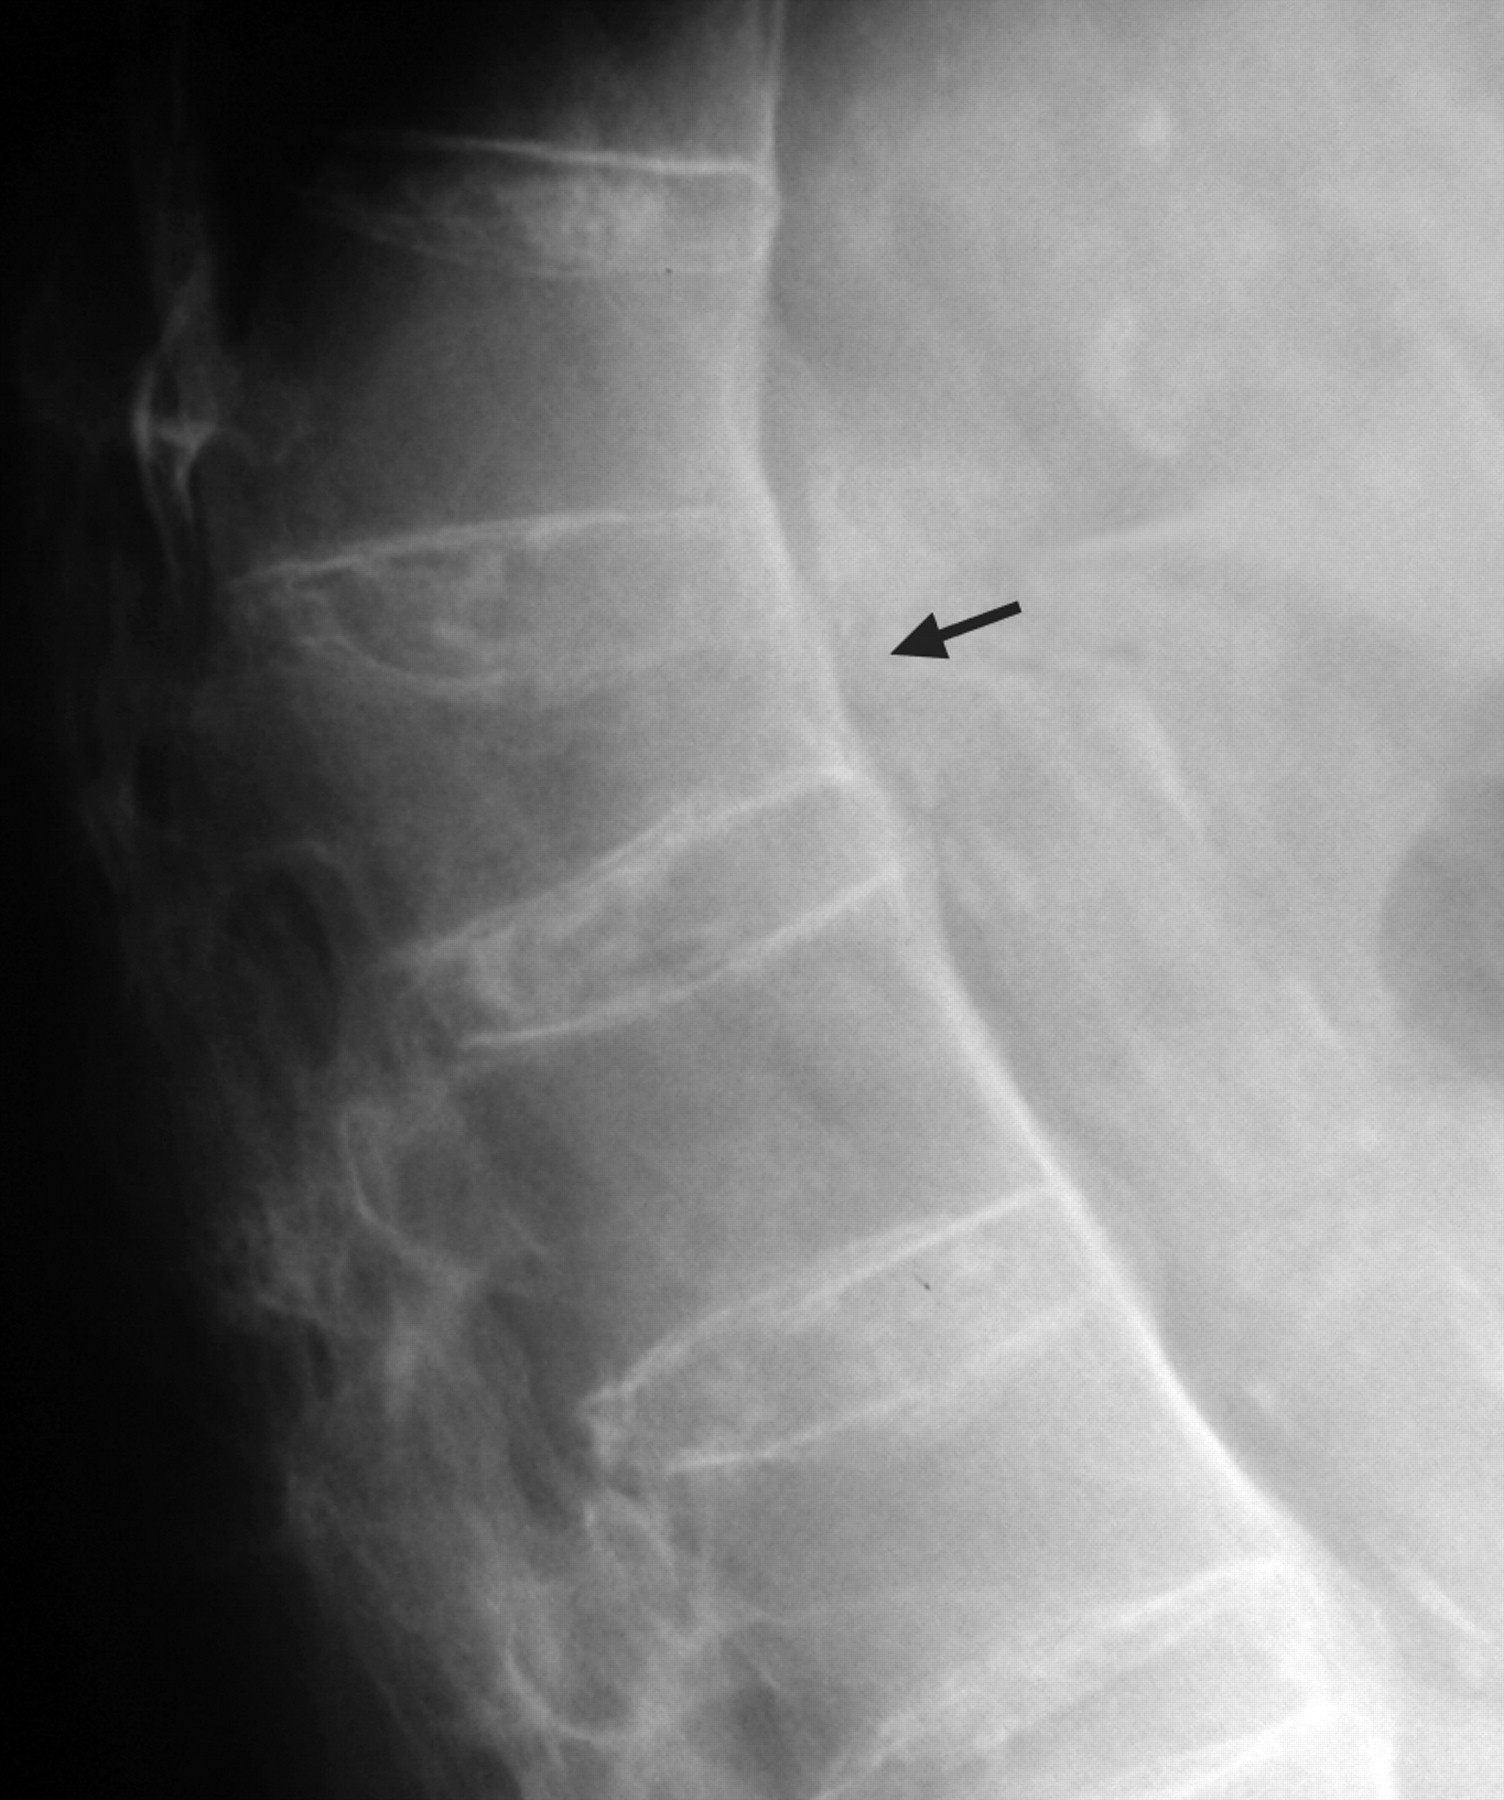
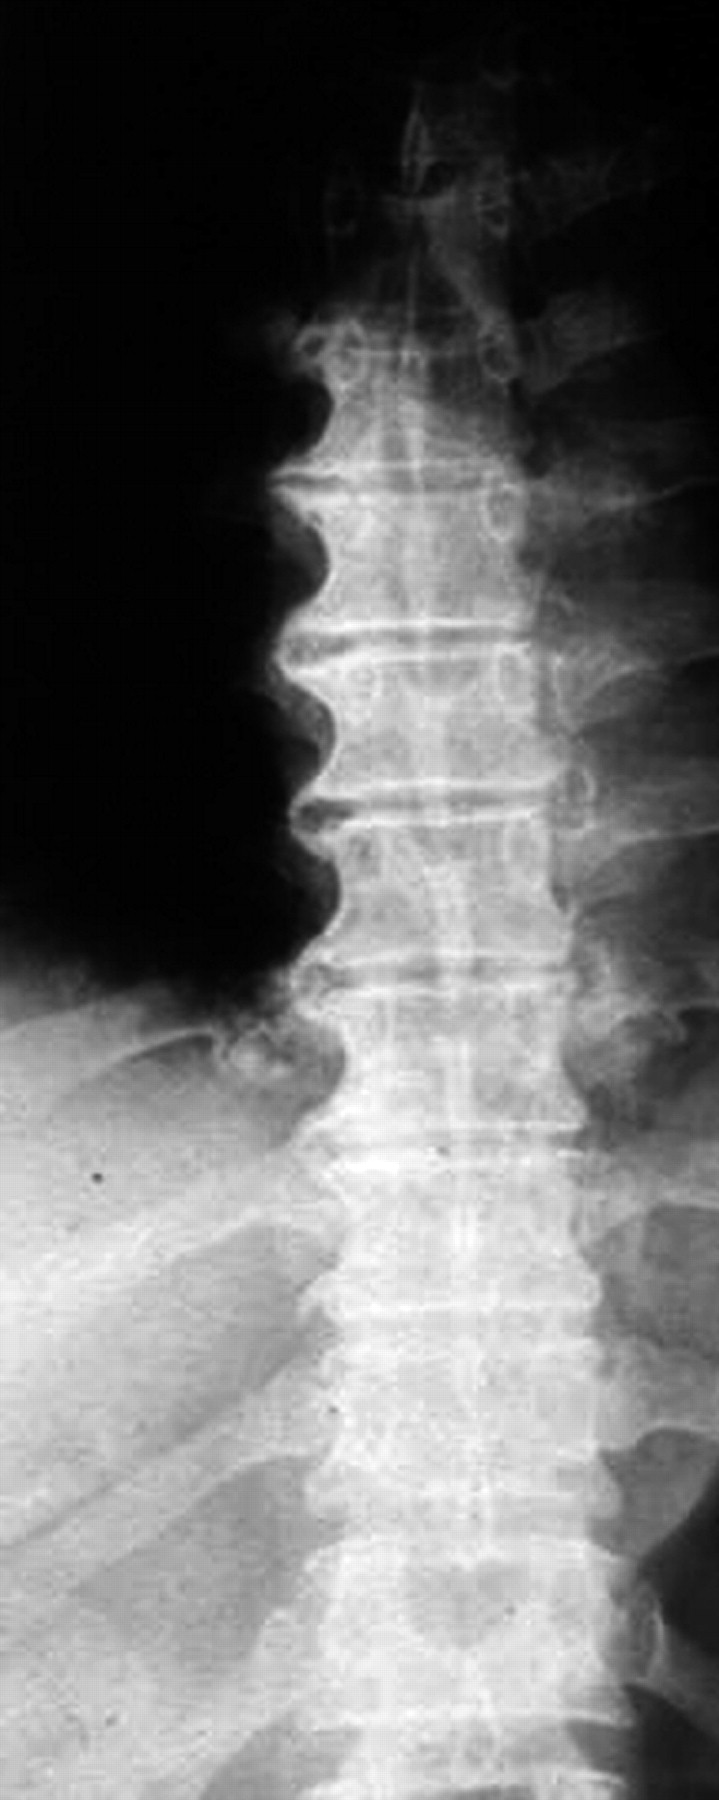
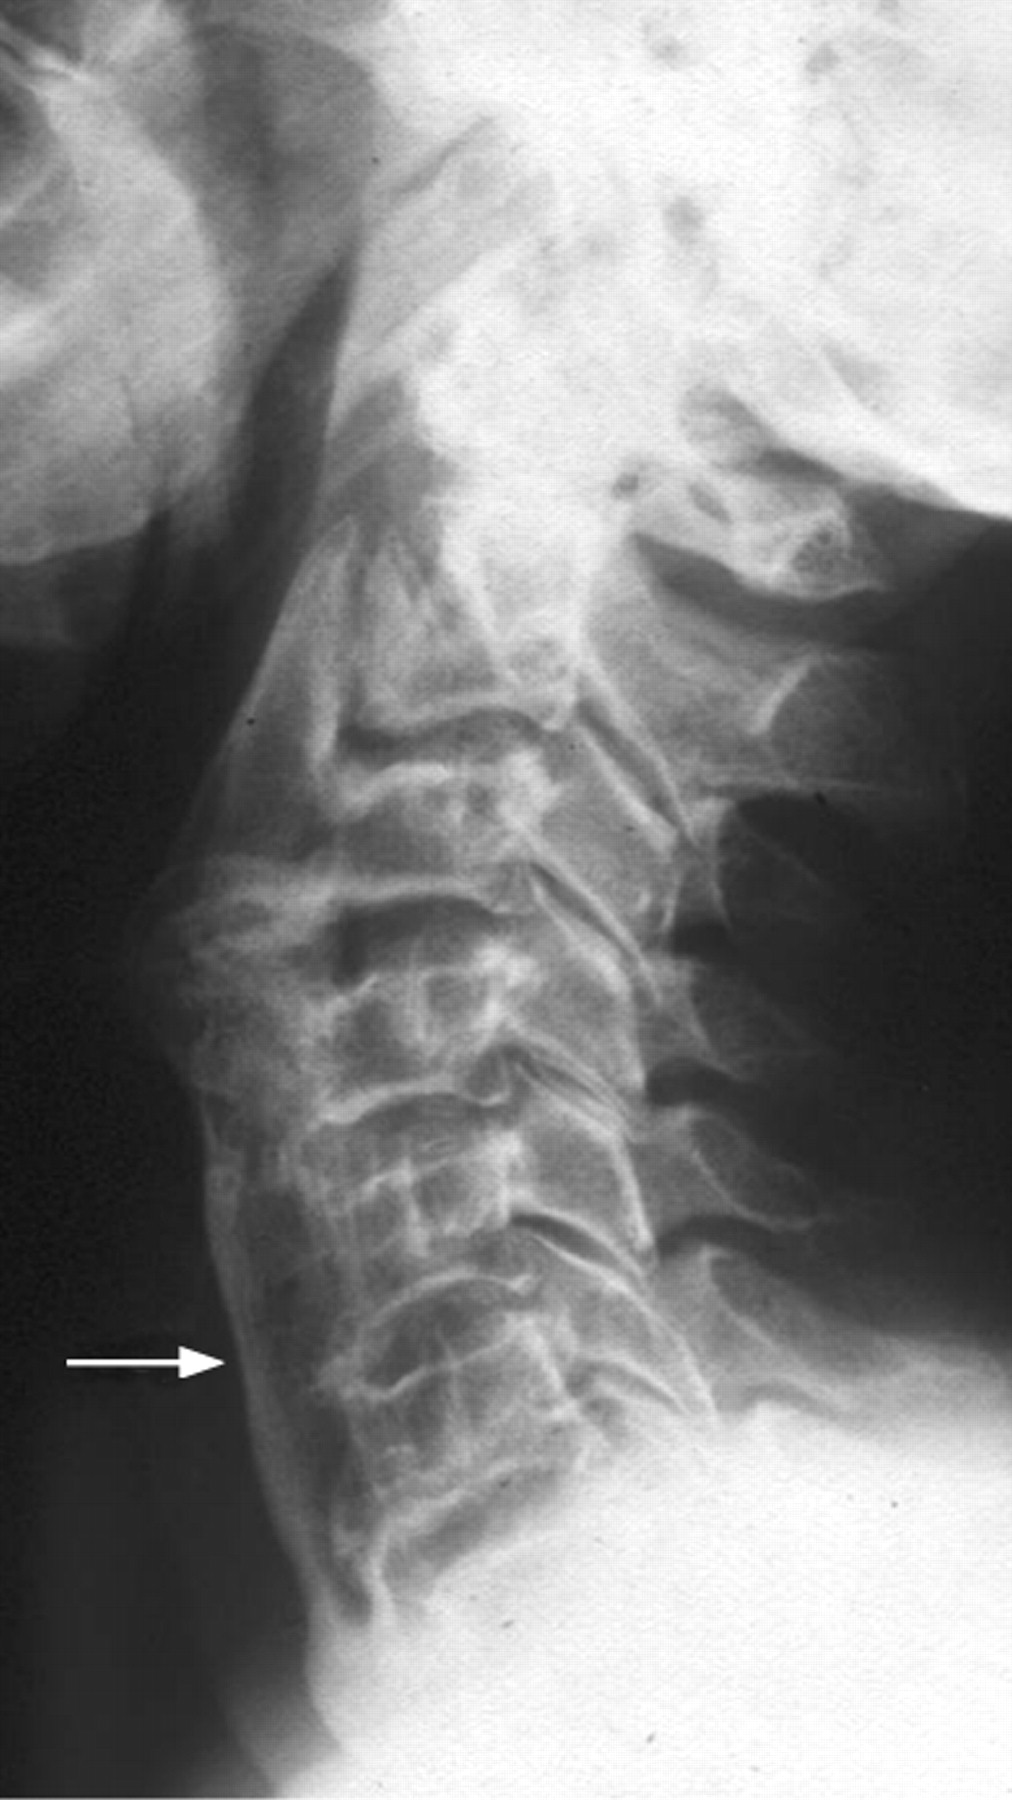
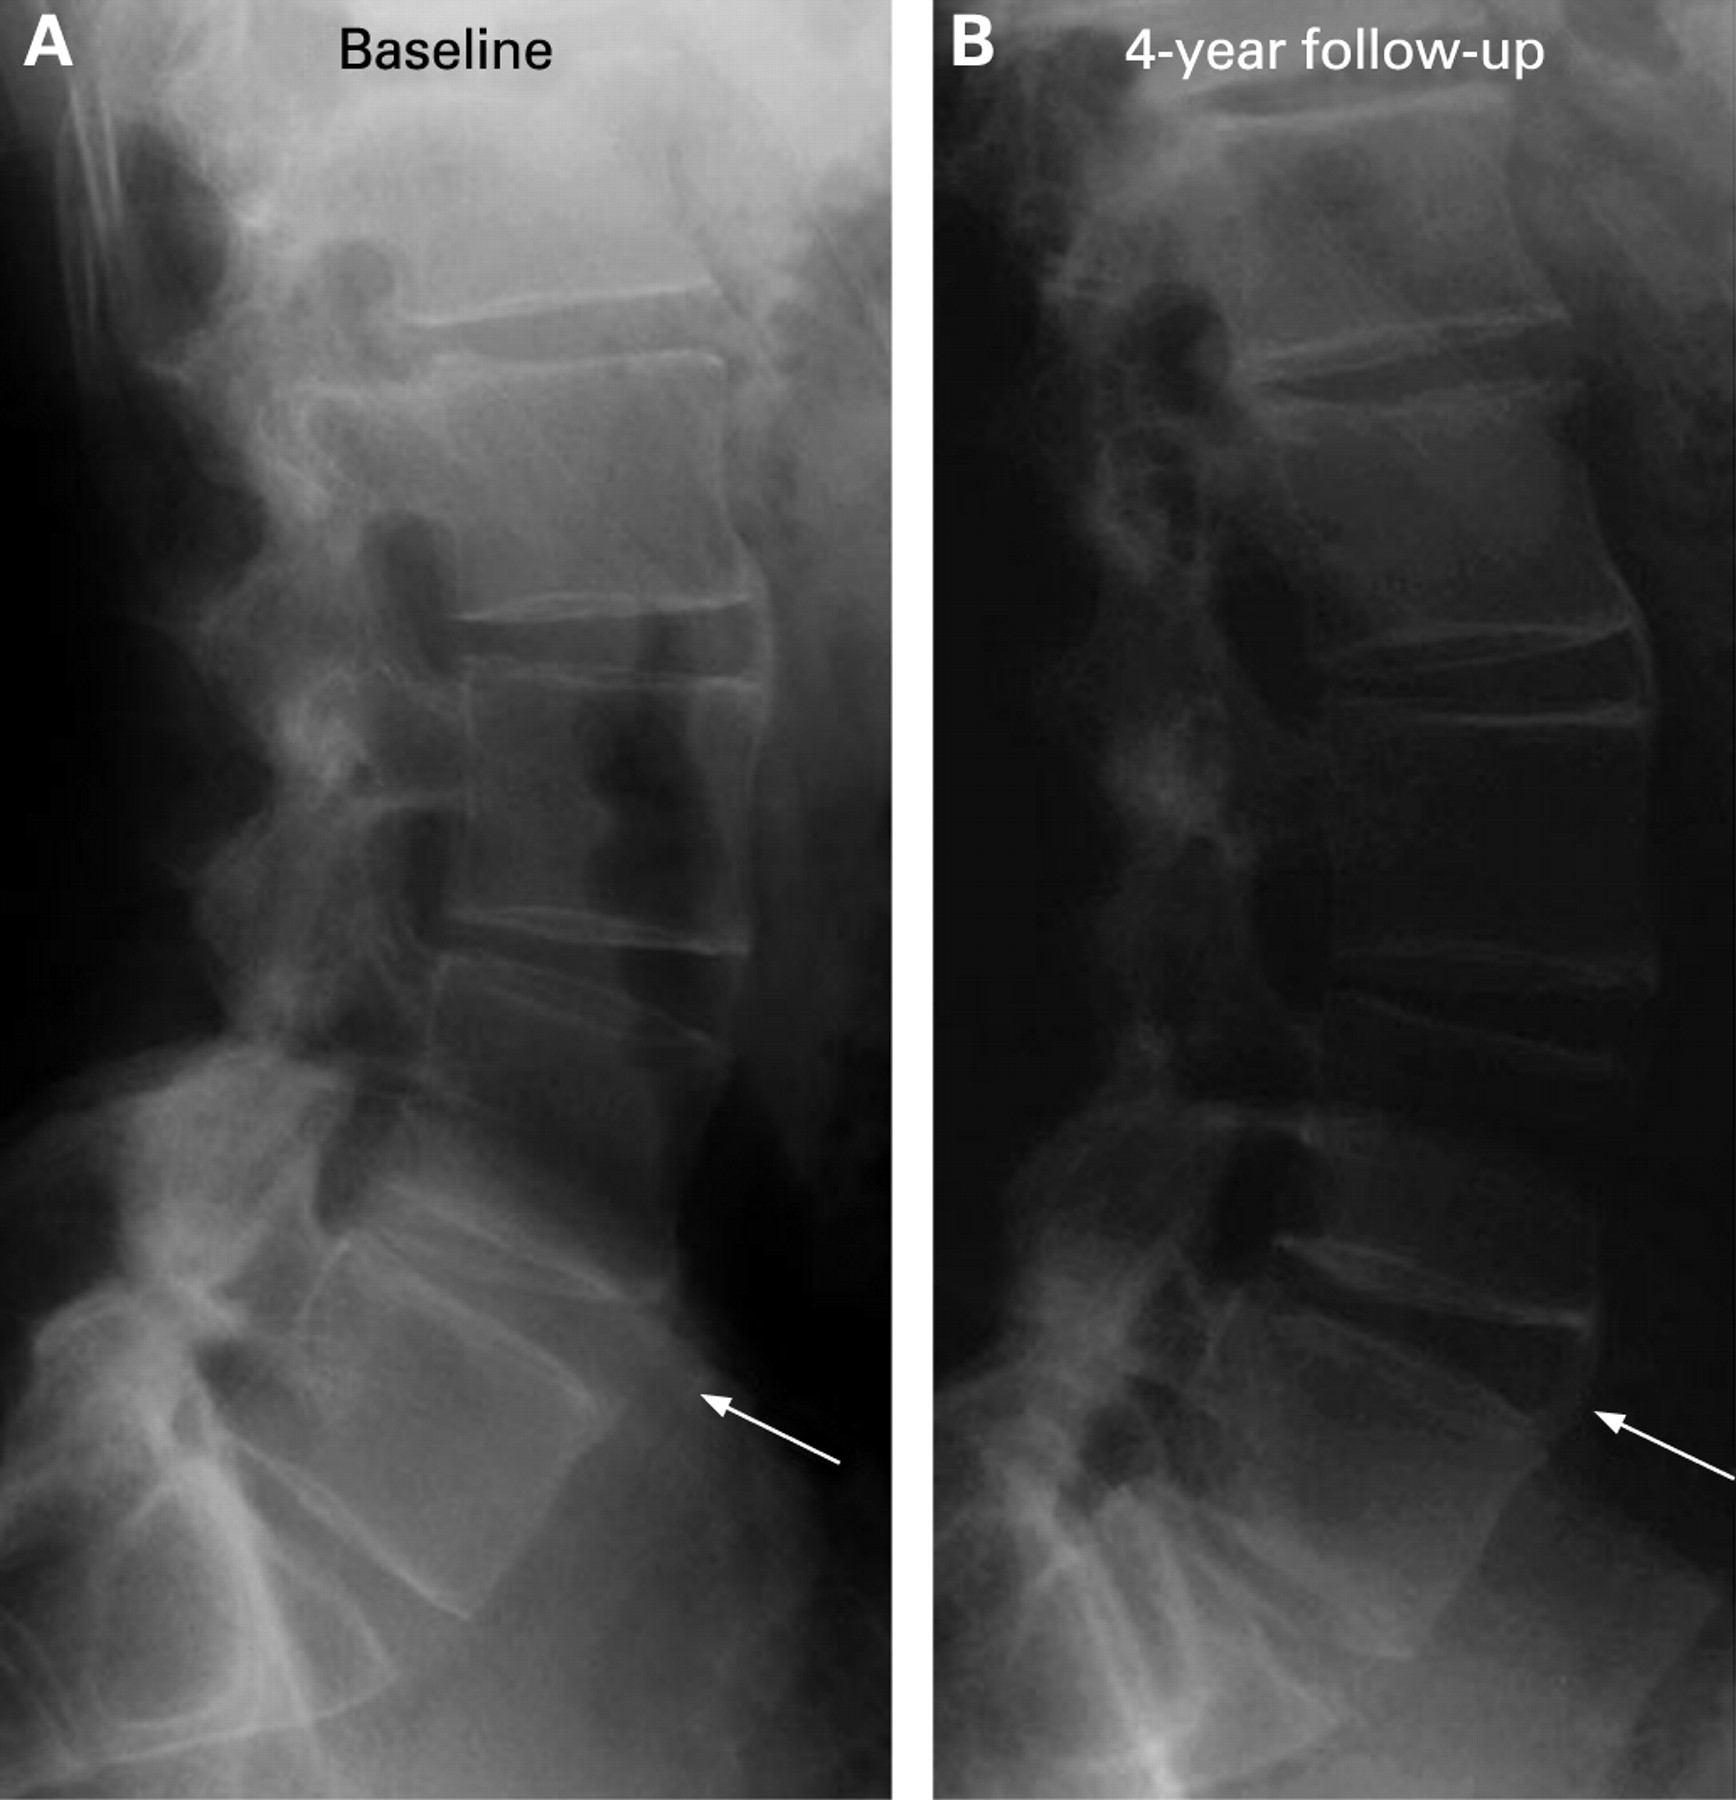
Lateral lumbar spine at 4-year interval. At baseline there are syndesmophytes indicated by the arrow at the lower corner of lumbar 4 and upper corner of lumbar 5. At the follow-up these syndesmophytes have formed a full bony bridge.

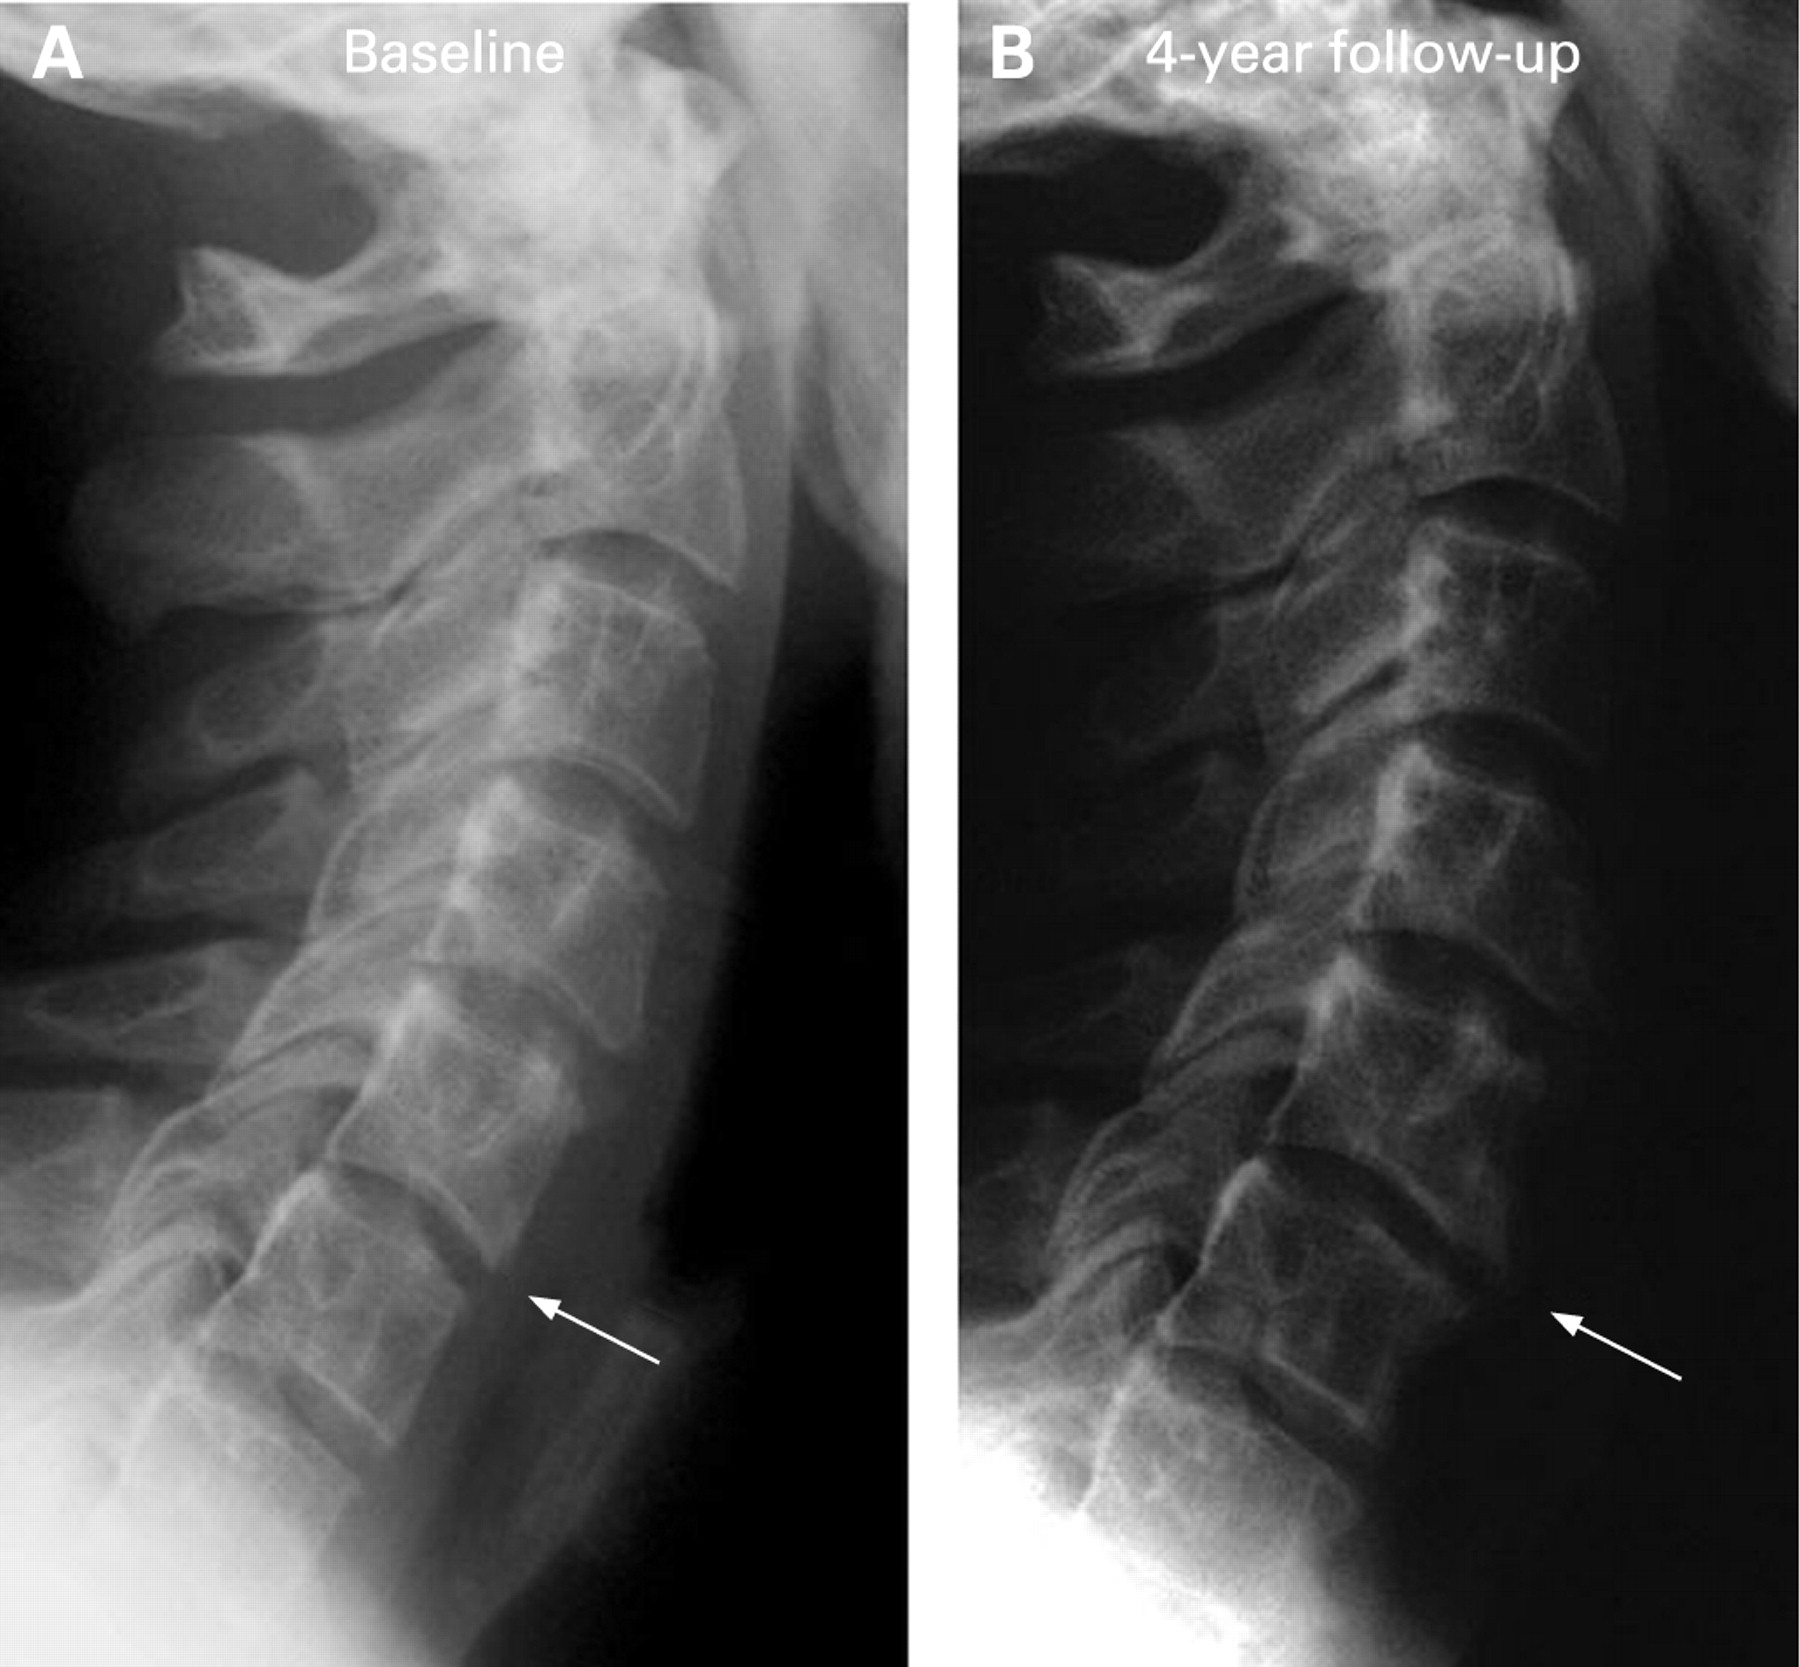
Lateral cervical spine at 2-year intervals. At baseline bridging syndesmophyte between C7 and Th1. By 2 years later there is new bridging syndesmophyte between C6 and C7 and a thin line of ossification between C5 and C6. By a further 2 years later, almost complete ossification at the anterior side. Note that the facet joints are normal.
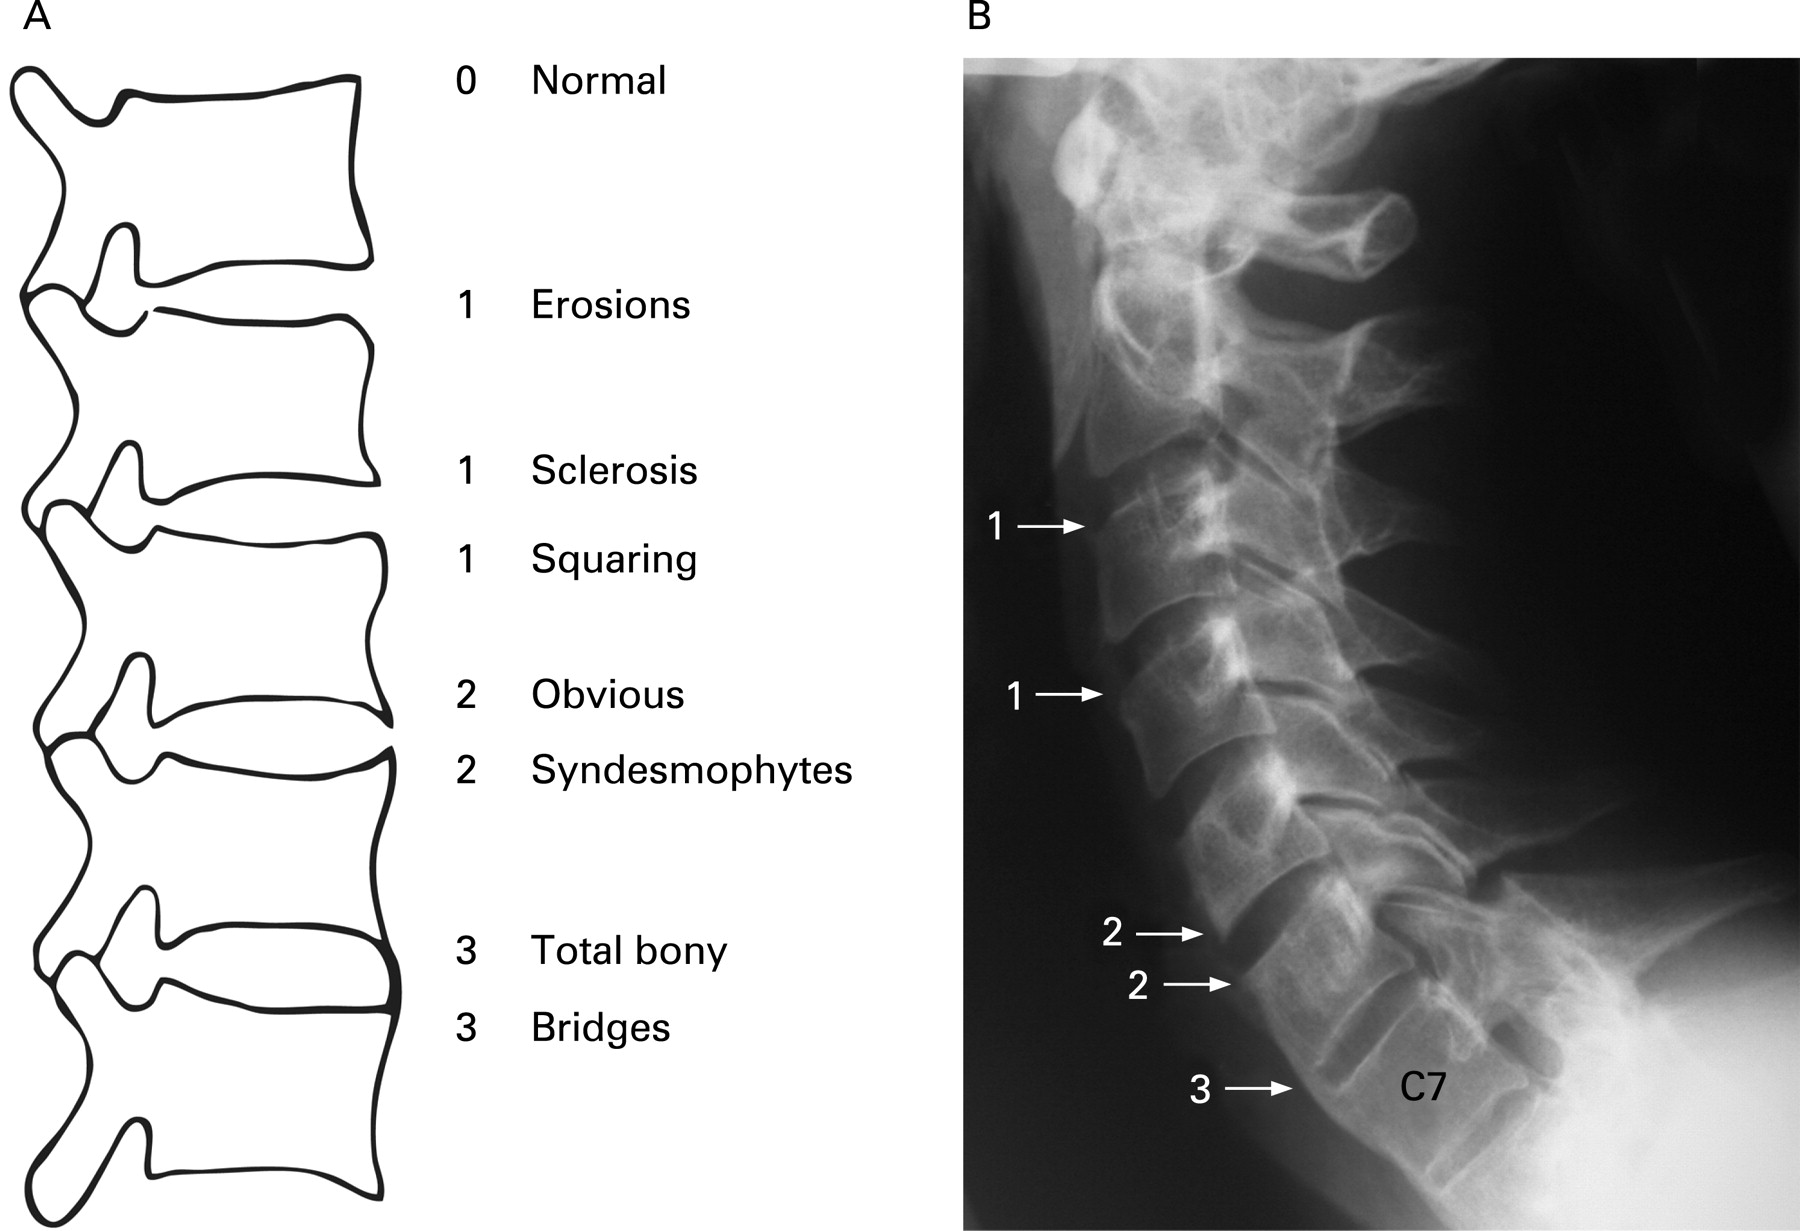
Modified Stoke Ankylosing Spondylitis Spine Score (mSASSS).15 16 A total of 24 sites are scored on the lateral cervical and lumbar spine (A): the anterior corners of the vertebrae from lower border of C2 to upper border Th1 (including) and from lower border of Th12 to upper border of S1 (including). Each corner can be scored from 0 to 3, resulting in a range from 0 to 72 for the total mSASSS. B: example of scoring according to the mSASSS. 0 = normal; 1 = sclerosis, squaring or erosion; 2 = syndesmophyte; 3 = bony bridge.
Complete bamboo spine with fusion of the facet joints. Vertebral fracture at the site of the arrow.

Vertebral fracture in a spine with relatively mild abnormalities due to ankylosing spondylitis, mostly in the facet joints.

Ankylosis of the facet joints (arrow). In the left panel in conjunction with bamboo spine formation, and in the right panel with syndesmophyte formation at a few levels.

Diagnostic pitfalls in the differential diagnosis of patients with (inflammatory) back pain. Solid large arrow, erosive osteochondrosis; Open large arrow, old lesion of Scheuermann disease; Small arrow, spondylolisthesis of L4/5 in combination with arthrosis of the facet joints (L4/5 and L5/S1).
Unilateral (right) bulky bridging syndesmophytes in the thoracic spine in a patient with DISH (diffuse idiopathic skeletal hyperostosis, or Forestier disease).
Wide band of calcification in front of the vertebrae (arrow) with normal facet joints. This is a typical image of DISH (diffuse idiopathic skeletal hyperostosis, or Forestier disease).

Differentiation between ankylosing spondylitis specific and degenerative changes in a patient with ankylosing spondylitis. The solid arrow indicates a bridging syndesmophyte; the open arrow spondylophytes. Note: sometimes the first appearance of syndesmophytes is as osteophytes but after further growth and remodelling they become real syndesmophytes.
Degenerative spine disease. Over 4 years there has been osteophyte (spondylophyte) formation at the site of the arrow. Spondylophytes are sometimes difficult to differentiate from ankylosing spondylitis (AS)-specific features such as syndesmophytes. In general, typical syndesmophytes grow in a vertical direction and typical spondylophytes in a horizontal direction.
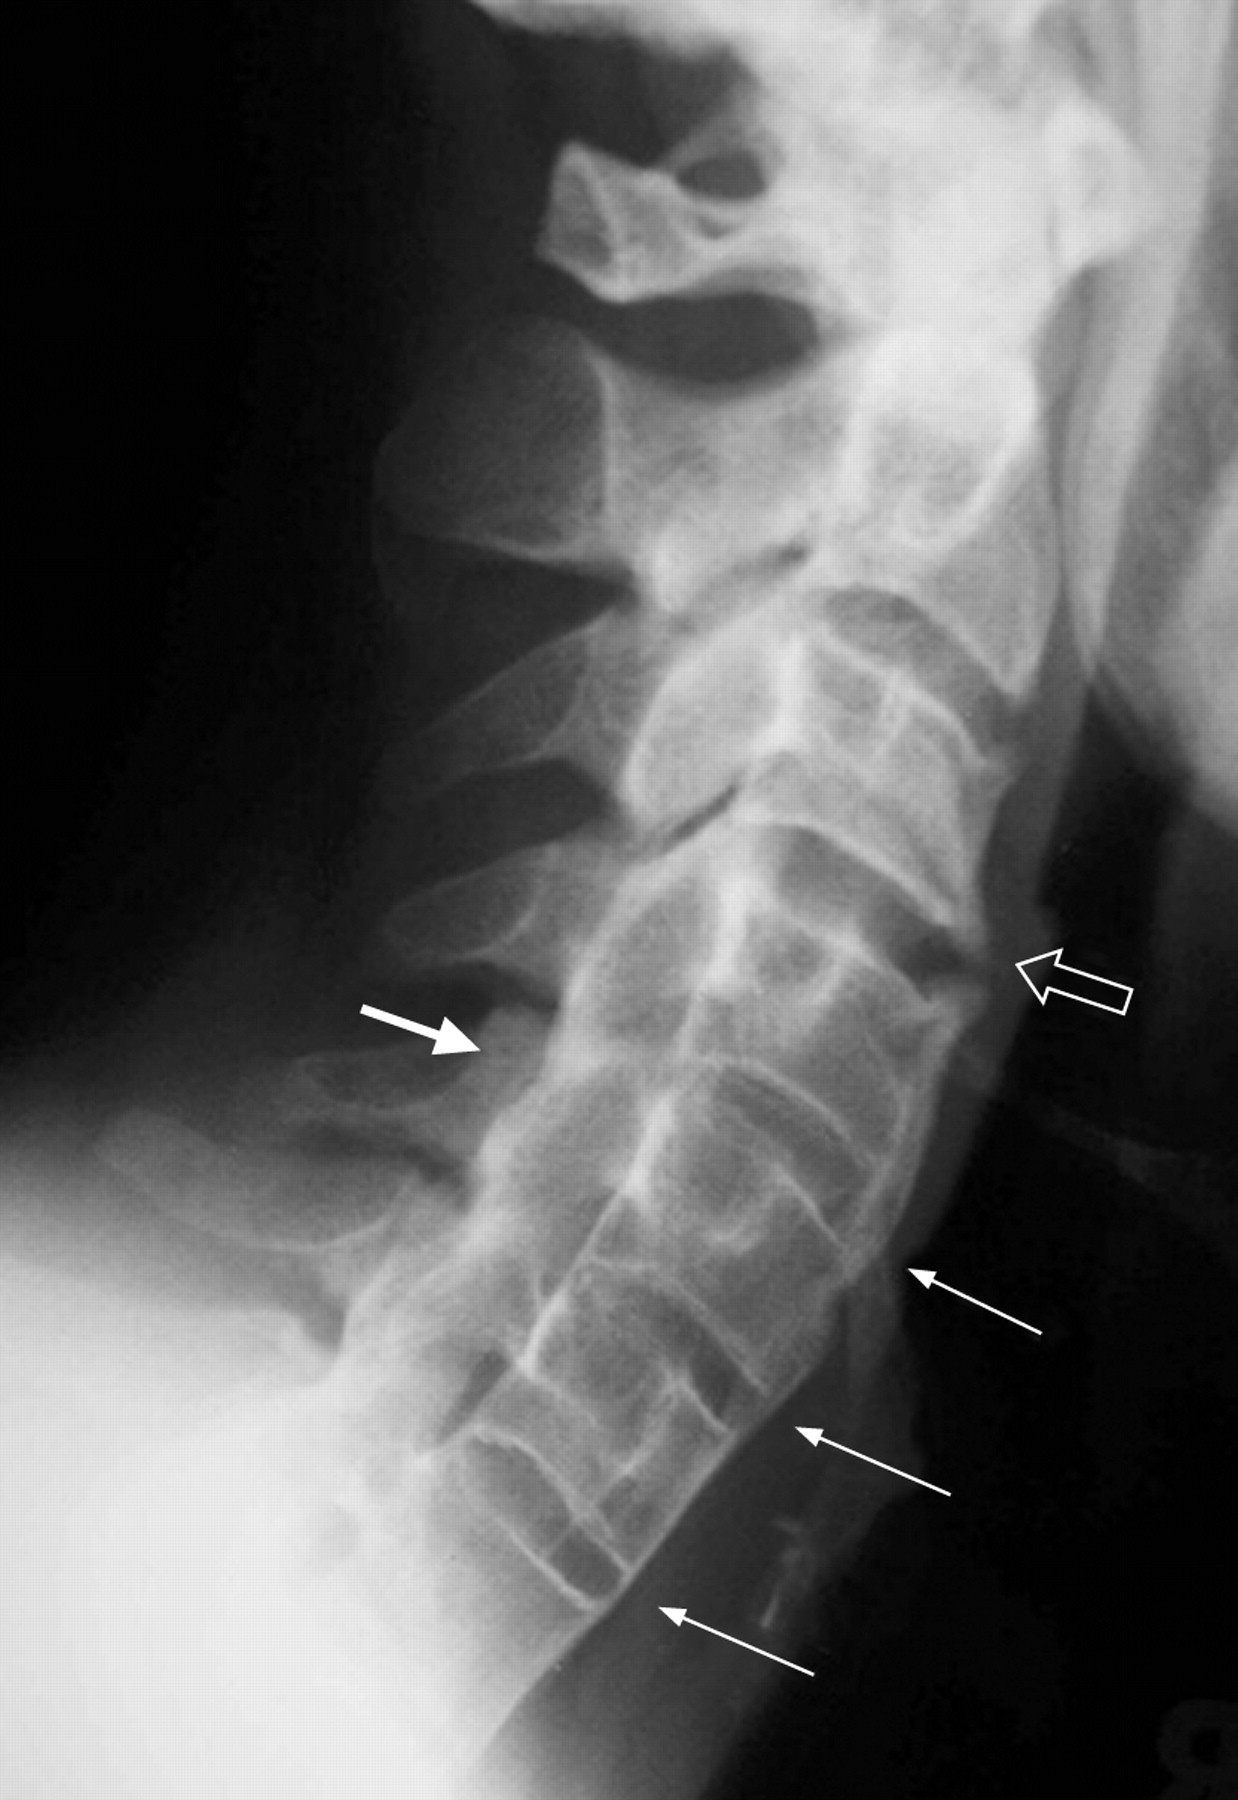
Differentiation between ankylosing spondylitis specific and degenerative changes in a patient with ankylosing spondylitis. Bony bridging at lateral cervical spine from C4 down to C7 at the sites of small arrows. Open arrow, difficult to differentiate between syndesmophyte or spondylophyte at this stage. Solid large arrow indicates fused (ankylosed) facet joints.
Osteoporotic fractures in ankylosing spondylitis
Facet joints
Diagnostic pitfalls
PART D: CLINICAL ASSESSMENT/OUTCOME MEASUREMENTS
In the following section the ASAS-endorsed outcome measures will be described in detail. It will start with a description of the different core sets (most recently updated version) and it will provide detailed information about the different measurement instruments. The focus is on practicality, and if necessary illustrative pictures have been added to further clarify. Assessments will be addressed domain-wise, which means that measures of disease activity will be discussed separately from measures of spinal mobility, or scoring methods for radiographic progression.
There is also a detailed overview of validated ASAS-endorsed response criteria and how to use them in clinical trials, and the newly developed ASDAS formulae will be presented.

Box 25 Spinal pain
Two questions (on average last week), visual analogue scale (VAS) or numerical rating scale (NRS):
How much pain of your spine due to AS do you have?
How much pain of your spine due to AS do you have at night?

Box 26 Patient global
How active was your spondylitis on average during the last week? (VAS, NRS)

Box 27 Stiffness spine
How long does your morning stiffness last from the time you wake up? (NRS) (same as Bath Ankylosing Spondylitis Disease Activity Index (BASDAI) question 6, see Box 28)


Box 29 Bath Ankylosing Spondylitis Functional Index (BASFI)19 (Adapted with permission from J Rheumatol.)
Items to be scored by the patient:
Putting on your socks or tights without help or aids (eg, sock aid).
Bending forward from the waist to pick up a pen from the floor without an aid.
Reaching up to a high shelf without help or aids (eg, helping hand).
Getting up out of an armless dining room chair without using your hands or any other help.
Getting up off the floor without help from lying on your back.
Standing unsupported for 10 min without discomfort.
Climbing 12 to 15 steps without using a handrail or walking aid. One foot at each step.
Looking over your shoulder without turning your body.
Doing physically demanding activities (eg, physiotherapy, exercises, gardening or sports).
Doing a full day’s activities, whether it be at home or at work.
The BASFI is the mean of 10 item scores completed on a numerical rating scale.
Alternatively, a VAS between 0 and 100 can be used. ASAS prefers to use an NRS.

Box 30 Bath Ankylosing Spondylitis Metrology Index (BASMI)20–22
Five clinical measurements that reflect axial mobility:
tragus to wall
lumbar flexion
cervical rotation
lumbar side flexion
intermalleolar distance.
Grading 0–2 or grading 0–10 or linear function.
Total score 0–10.

Box 32 Spinal mobility measures
Cervical rotation*†
Lateral spinal flexion*†
Modified Schober*†
Intermalleolar distance*
Tragus to wall distance*
Occiput to wall distance†
Chest expansion†
*Included in the BASMI; †included in core set.
Box 33 Modified Schober
Patient must be standing erect.
Mark an imaginary line connecting both posterior superior iliac spines (close to the dimples of Venus) (A).
The next mark is placed 10 cm above (B).
The patient bends forward maximally: measure the difference (C).
Report the increase (in cm to the nearest 0.1 cm).
The better of two tries is recorded.

Box 34 Lateral spinal flexion
Patient’s heels and back rest against the wall. No flexion in the knees, no bending forward.
Place a mark on the thigh (A1), bend sideways without bending knees or lifting heels (A2), place a second mark and record the difference (A3).
Alternatively, measure the distance between the patient’s middle fingertip and the floor before (B1) and after bending sideways (B2), and record the difference.
The better of two tries is recorded for left and right separately. The mean of left and right is reported for lateral spinal flexion (in cm to the nearest 0.1 cm).

Box 35 Occiput to wall (grey arrow) and tragus to wall (white arrow)
Patient’s heels and back rest against the wall.
Chin at usual carrying level.
Maximal effort to touch the head against the wall.
Report the better of two tries in cm (eg, 10.2 cm).

Box 36 Cervical rotation
The patient sits straight on a chair, chin level, hands on the knees.
The assessor places a goniometer at the top of the head in line with the nose (A).
The assessor asks to rotate the neck maximally to the left, follows with the goniometer, and records the angle between the sagittal plane and the new plane after rotation (B).
A second reading is taken and the better of the two is recorded for the left side.
The procedure is repeated for the right side.
The mean of left and right is recorded in degrees (0–90°).

Box 37 Intermalleolar distance
The patient is lying down (A) with the legs separated as far as possible with knees straight and toes pointing upwards (preferred method).
Alternatively, the patient stands (B) and separates the legs as far as possible.
The distance between the medial malleoli is measured.

Box 38 Chest expansion (not included in BASMI)
The patient has their hands resting on or behind the head.
Measure at fourth intercostal level anteriorly.
Difference between maximal inspiration and expiration in cm is recorded (eg, 4.3 cm).
Report the better of two tries.

Box 39 Number of swollen joints
44 joints
No grading
Range from 0 to 44.

Box 40 Maastricht Ankylosing Spondylitis Enthesitis Score (MASES)23
13 Sites:
Costochondral 1 right/left (a)
Costochondral 7 right/left (b)
Spina iliaca anterior superior right/left (c)
Crista iliaca right/left (d)
Spina iliaca posterior right/left (e)
Processus spinosus L5 (f)
Achilles tendon, proximal insertion right/left (g).
No grading
All sites are scored as 0 or 1
The MASES is the sum of all site scores (from 0 to 13).

Box 41 Parameters used for the ASDAS24
Total back pain (BASDAI question 2, see Box 28)
Patient global of disease activity (see Box 26)
Peripheral pain/swelling (BASDAI question 3, see Box 28)
Duration of morning stiffness (BASDAI question 6, see Box 28)
C-reactive protein (CRP) in mg/litre (or erythrocyte sedimentation rate (ESR)).
Box 42 Calculation of the ASDAS24
ASDASCRP: 0.121×total back pain+0.110×patient global+0.073×peripheral pain/swelling+0.058×duration of morning stiffness+0.579×Ln(CRP+1).
ASDASESR: 0.113×patient global+ +0.086×peripheral pain/swelling+0.069×duration of morning stiffness+0.079×total back pain.
ASDASCRP is preferred, but the ASDASESR can be used in case CRP data are not available. CRP in mg/litre; all patient assessments on a 10 cm scale.
Box 43 mSASSS16
(For more details see Part C, fig 45.)
Both sacroiliac (SI) joints (right more than left) show some erosions, irregular joint space and ill-defined margins. (right grade 3, left grade 2).
Lateral view lumbar and cervical spine
Anterior sites of the vertebrae are scored:
squaring (1 scoring point)
erosions (1 scoring point)
sclerosis (1 scoring point)
syndesmophytes (2 scoring points)
bridging syndesmophytes (3 scoring points)
Only squaring or erosions or sclerosis can be scored per site
Score range 0–72.
Box 44 ASAS 20 improvement criteria25
Four domains:
Patient global (see Box 26)
Pain (see Box 25)
Function (see Box 29)
Inflammation (mean of BASDAI questions 5 and 6, see Box 28).
Improvement of ⩾20% and ⩾1 unit in at least 3 domains on a scale of 10.
No worsening of ⩾20% and ⩾1 unit in remaining domain on a scale of 10.
Box 45 ASAS partial remission criteria25
Four domains:
Patient global (see Box 26)
Pain (see Box 25)
Function (see Box 29)
Inflammation (mean of BASDAI questions 5 and 6, see Box 28).
A value not above 2 units in each of the domains on a scale of 10.
Box 46 ASAS 40 improvement criteria26
Four domains:
Patient global (see Box 26)
Pain (see Box 25)
Function (see Box 29)
Inflammation (mean of BASDAI questions 5 and 6, see Box 28).
Improvement of ⩾40% and ⩾2 unit in at least 3 domains on a scale of 10.
No worsening at all in remaining domain.
Box 47 ASAS 5/6 improvement criteria26
Six domains:
Patient global (see Box 26)
Pain (see Box 25)
Function (see Box 29)
Inflammation (mean of BASDAI questions 5 and 6, see Box 28)
CRP
Spinal mobility (lateral spinal flexion, see Box 34).
Improvement of ⩾20% in at least five domains.
PART E: MANAGEMENT RECOMMENDATIONS
By using a combined approach of a thorough analysis of the current literature and organising a meeting of international spondyloarthritis experts, ASAS has developed the first international criteria for the management of AS in general and also recommendations for the treatment of AS with tumour necrosis factor (TNF) blockers. At the time of the development of these recommendations, sufficient data were only available for patients with AS normally fulfilling the modified New York criteria. In the light of the recently developed new ASAS criteria for axial SpA (also including patients in the early non-radiographic phase of their disease) and of recent results showing an at least equal efficacy of TNF blockers in the treatment of non-radiographic axial SpA in comparison to established AS, these recommendations must and will be extended to early SpA in the near future.

Acknowledgments
We are grateful to Anne Grethe Jurik, Mikkel Østegaard and Herman Mielants for providing images and/or participating in the discussion on the definition of positive MRIs. We would like to thank Janis Vahldiek and Georg Heine for the excellent technical assistance.
REFERENCES
Footnotes
None declared.