


Abstract
Objectives. Ventricular and arterial stiffness is an accepted cause of myocardial diastolic dysfunction. The aim of this study is to determine whether there is increased ventricular and arterial stiffness in patients with PsA and any relationship with disease-related risk factors.
Methods. Seventy-three patients with PsA were divided into two subgroups based on the absence or presence of hypertension and/or left ventricular (LV) hypertrophy. Fifty healthy controls were enrolled for comparison. All participants underwent non-invasive assessments including conventional echocardiography with tissue Doppler imaging and pulse wave analysis. Ventricular stiffness was measured by ventricular end-systolic and diastolic elastance, whereas arterial stiffness was measured by total arterial compliance and aortic augmentation index.
Results. There was significantly increased ventricular and arterial stiffness in patients with PsA (P < 0.001), even in those without hypertension and/or LV hypertrophy. Based on the cut-off points derived from the controls, 38.4% of PsA patients had increased LV stiffness including 31.5% in diastole and 17.8% in systole, and 15.1% had increased arterial stiffness. Multivariable logistic regression analysis showed that long PsA disease duration (>10 years) (odds ratio = 6.55, P = 0.001) was an independent risk factor for increased LV diastolic elastance after adjusting for age, gender and hypertension.
Conclusion. Patients with PsA may have increased ventricular and arterial stiffness even without evidence of LV remodelling, and those with long disease duration may be at a higher risk. Therefore, prolonged inflammatory burden may be an important cause of early cardiovascular disease in patients with PsA.
Introduction
PsA is an autoimmune inflammatory disease, which is associated with an increased prevalence of hypertension, ischaemic heart disease, congestive heart failure, peripheral vascular disease, cerebrovascular disease and type II diabetes [1]. A mortality study showed that cardiovascular diseases (CVD) are the leading cause of death in patients with PsA compared with controls with a 1.3-fold risk of increased death [2]. However, the mechanism of CVD has not been fully elucidated in these patients. Recently, ventricular and arterial stiffness has been identified as an important pathophysiological determinant of CVD [3] and has been studied in different populations including the elderly, patients with cardiovascular risk factors, hypertension, diabetes mellitus, end-stage renal disease and obstructive sleep apnoea [4–9]. Nevertheless, no published study has focused on the early detection of ventricular and arterial stiffness in patients with PsA.
With tissue Doppler imaging subclinical myocardial disease, not detectable by conventional echocardiography, can be recognized [10–13]. In addition, ventricular and arterial stiffness can be derived from echocardiographic measurements [14]. Furthermore, non-invasive pulse wave analysis (PWA) has recently gained recognition as a measure of subclinical vascular disease, using applanation tonometry, which records a peripheral arterial waveform. A derived central aortic waveform can be obtained by applying a generalized transfer function. The aortic augmentation index provided by PWA can indirectly evaluate arterial stiffness. Using these non-invasive techniques, we sought to test the hypothesis that patients with PsA might have a high propensity to experience increased ventricular and arterial stiffness independent from standard risk factors and which may be associated with some disease-related risk factors.
Methods
Study population
Ninety-five patients were screened, and 73 of them fulfilling the classification of PsA criteria [15] were recruited consecutively from the rheumatology clinic of a university affiliated teaching hospital. Exclusion criteria included pregnancy, hypothyroidism, clinically significant renal disease (serum creatinine level ≥ 270 μmol/l), diabetes mellitus, those with history of angina, stable coronary artery disease, previous acute coronary syndromes, coronary revascularization, bundle-branch block, second-degree or higher atrioventricular block, atrial fibrillation, valvular stenosis or at least moderate valvular regurgitation, valvular replacement or repair or mitral annular calcification. Patients were divided into two subgroups based on the absence or presence of hypertension (defined as a systolic blood pressure ≥140 mm Hg or a diastolic blood pressure ≥90 mm Hg or the use of antihypertensive agents) and/or left ventricular hypertrophy (LVH) evidenced by echocardiography. Fifty healthy control subjects without a history of overt CVD were recruited from the community through advertisement or from other clinics. The control group was matched to the patient subgroup without hypertension or LVH for age, gender, BMI and blood pressure. The Ethics Committee of our institution (Ethics Committee of The Chinese University of Hong Kong and the Hong Kong Hospital Authority) approved the study that was conducted in compliance with the Declaration of Helsinki (2000) of the World Medical Association. All participants provided written informed consent.
PsA clinical assessment
Disease patterns
PsA patients with predominant peripheral arthritis were included in the category of peripheral arthritis, and those with predominant inflammatory arthritis of the back were included in the category of spondyloarthritis.
Disease activity and severity
Pain, physician’s and patient’s global assessments, was assessed using a 10-point visual analogue scale (0 = excellent well-being; 10 = feeling extremely unwell). Physical examination recorded the number of tender and swollen joints using the 68 tender/66 swollen joint count, the presence of dactylitis and the number of permanently deformed joints. Disease activity was assessed using the disease activity score in 28 joints (DAS28) [16].
Sign and symptoms of psoriasis
Skin abnormality and nail lesions were examined, and the psoriasis area and severity index (PASI) was calculated to evaluate the severity of psoriasis [17]. Radiographs (spine, pelvis, feet and hands) were reviewed for the presence of erosion at the time of the study.
Laboratory
ESR was measured using the Westergren method. The high-sensitivity CRP level was measured using an immunoturbidimetric assay performed with Olympus OSR6185 (Olympus Diagnostics, Lismeehan, County Clare, Ireland). Apolipoproteins A and B were tested by automated analyzer (Cobas-Mira Plus, Hoffman-La Roche Diagnostics, Mannheim, Germany), using a turbidimetric assay. Plasminogen activator inhibitor-1 was measured by ELISA, using commercially available kits (Diagnostica Stago, Freres Chausson, France). Fibrinogen was measured using a modified clot-rate assay.
Echocardiography
Conventional echocardiography
A comprehensive echocardiography with Doppler studies was performed by using Vivid 7 systems with a 3.5-MHz probe (GE Medical Systems, Milwaukee, WI, USA). Standard echocardiographic assessments included the measurements of LV dimensions, wall thickness, LV mass index, ejection fraction and colour Doppler imaging of all valves were done according to the recommendations of American Society of Echocardiography [18]. LVH was considered present if the LV mass index to body surface exceeded 95 g/m2 in women and 115 g/m2 in men. Relative wall thickness (RWT) was calculated by the formula (2 × LV end-diastolic posterior wall thickness/LV end-diastolic internal dimension) to classify LV remodelling as normal geometry (no LVH and RWT ≤0.42), concentric remodelling (no LVH but RWT > 0.42), eccentric hypertrophy (LVH with RWT ≤0.42) or concentric hypertrophy (LVH with RWT >0.42) [18]. The LV ejection fraction was evaluated by modified biplane Simpson method.
Tissue Doppler imaging and subclinical LV dysfunction
Color tissue Doppler images in at least three consecutive beats were acquired from apical 4-chamber, 2-chamber and long-axis with a highest possible frame rate (>100 frames/s), and off-line analysis programs (EchoPac-PC 108.1.5, Horten, Norway) included peak systolic (Sm) and peak early diastolic (Em) myocardial velocities of 12 LV segments. Real-time pulsed-wave tissue Doppler velocities were recorded from the septal and lateral sites of the mitral annulus in the apical 4-chamber view for measurements of early peak (E′) diastolic velocity. In our laboratory, the intraobserver and interobserver variability for tissue Doppler velocity data were 3% and 5%, respectively, as previously reported [19]. Subclinical LV diastolic dysfunction was identified by lateral E′ <11.5 cm/s and/or the ratio of the mitral inflow early diastolic filling velocity (E) to lateral E′ (E/E′) >10 [20–22]; subclinical LV systolic dysfunction was defined by mean Sm from only six basal LV segments <4.4 cm/s [10]. Subclinical LV dysfunction included subclinical LV diastolic and/or systolic dysfunction.
Non-invasive vascular assessment
Vascular ultrasound
Carotid intima–media thickness (IMT) was scanned by using B-mode ultrasound with a 10-MHz linear vascular probe (Vivid 7; GE Vingmed Ultrasound, Horten, Norway). Minimal gain was adjusted to visualize the lumen–intimal and medial–adventitial interfaces defining IMT in the far wall. Digital images of three cardiac cycles were saved with ECG signals. The IMT was measured in the distal 1 cm of common carotid artery, carotid bifurcation and the initial 1 cm of internal carotid artery by using dedicated software (Carotid Analyzer; Medical Imaging Applications, Coralville, IA, USA). The cardiologist was blinded to all clinical information when carrying out online and offline analysis. The mean IMT was recorded, not including plaques, for the following calculation. Plaque was defined as a localized thickening >1.2 mm that did not uniformly involve the whole artery.
PWA
The examination was performed as recommended [23]. PWA was performed using the SphygmoCor device (SCOR 2000 v.7.01; AtCor. Medical Pty Ltd, Sydney, Australia) with a tonometer probe at the right radial artery. The central aortic arterial pulse wave was transferred from the peripheral arterial pulse wave, and the aortic augmentation index was standardized to a heart rate of 75 bpm to minimize the effect of heart rate automatically [24]. The standardized aortic augmentation index was used for the main analysis.
Definitions of ventricular and arterial stiffness
Ventricular stiffness was evaluated by LV end-systolic elastance (0.9 × systolic blood pressure/LV end-systolic volume) and diastolic elastance [(lateral E/E′)/LV stroke volume] [14]. Arterial stiffness was estimated by effective arterial elastance (0.9 × systolic blood pressure/LV stroke volume), total arterial compliance (LV stroke volume/pulse pressure) and aortic augmentation index [14, 25, 26]. Vascular ventricular coupling was assessed by the ratio of effective arterial elastance to LV end-systolic elastance [14].
Statistical analysis
SPSS 17.0 (SPSS, Inc., Chicago, IL, USA) was used for the analyses. Results are expressed as mean (s.d.) for normally distributed data and the median [interquartile range (IQR)] for non-normally distributed data. Comparisons among groups were assessed using unpaired t-test or analysis of variance test for continuous variables and χ2 test for categorical variables. Mann–Whitney U test was used for continuous variables that were skewed. Curve estimation and logistic regression analysis were performed to assess the relationship between echocardiographic and clinical variables. Curve estimation is a curve-fitting program that can be used to compare and select suitable curve relationships (such as linear, logarithmic, inverse, compound and so on) to illustrate the relationships between variables, which are illustrated in figures with r values. As for logistic regression, all potential risk factors were included into univariable logistic regression analysis based on t-test results, then those with P < 0.10 in univariable logistic regression analysis were selected for the multivariable logistic regression analysis. The cut-off points of LV and arterial stiffness were derived from control group by using mean +2 s.d., because 95% of all the data values in control group can be found between the mean +2 s.d. and the mean −2 s.d. All tests were 2-tailed and P-values <0.05 were considered statistically significant.
Results
The mean age of these 73 PsA patients at diagnosis was 34 years, and the median disease duration of PsA was 10.7 (IQR: 6.3–18.0) years. Fifty-seven (78.1%) patients had concurrent psoriasis, 47 (64.4%) had nail lesions and 34 (46.6%) had erosions on radiography at the time of assessment. Sixty-one (83.6%) patients had peripheral arthritis and 12 (16.4%) had spondyloarthritis. Based on the DAS28 score, 45 (61.6%) patients had active disease. More than half of the patients had been on NSAIDs and DMARDs (Table 1). Forty-three patients did not have hypertension or LVH, whereas 30 patients had either hypertension (n = 27, 37.0%) or LVH (n = 7, 9.6%).
Disease-related characteristics in patients with PsA
| Parameter | PsA, n = 73 |
|---|---|
| Age at psoriasis diagnosis, years | 34 (15) |
| Age at PsA diagnosis, years | 39 (12) |
| Psoriasis duration, median (IQR) | 10.7 (6.3–18.0) |
| PsA duration, years; median (IQR) | 8.2 (2.1–11.4) |
| Disease pattern, n (%) | |
| Peripheral | 61 (83.6) |
| Spondylarthritis | 12 (16.4) |
| Disease activity, n (%) | |
| Inactive (DAS28 ≤ 3.2) | 28 (38.4) |
| Moderately active (3.2 < DAS28 ≤ 5.1) | 29 (39.7) |
| Very active (DAS28 > 5.1) | 16 (21.9) |
| PASI, median (IQR) | 2.4 (1.0–8.0) |
| Physician’s global (VAS 0–10), median (IQR) | 2.0 (0–3.0) |
| Patient’s global (VAS 0–10) | 4.5 (2.3) |
| Number of damaged joints, median (IQR) | 1.0 (0–4.0) |
| Erosion, n (%) | 17 (39.5) |
| HAQ, median (IQR) | 0.4 (0–0.9) |
| ESR, mm/h, median (IQR) | 22.0 (10.0–37.0) |
| hs-CRP, median (IQR) | 4.2 (1.6–12.5) |
| Apo A-1, mg/dl | 151.0 (32.0) |
| Apo B, mg/dl | 83.2 (15.9) |
| Fibrinogen, mg/l | 4.1 (0.8) |
| PAI-1, median (IQR) ng/ml | 24.0 (15.6–36.2) |
| White cell count, ×109/l | 6.8 (2.3) |
| Platelet count, ×109/l | 305.0 (69.9) |
| Serum creatinine, µmol/l | 72.0 (15.1) |
| Current NSAIDs, n (%) | 47 (64.4) |
| Current DMARDs, n (%) | 41 (56.2) |
| Corticosteroid ever, n (%) | 6 (8.2) |
| Current anti-hypertensive therapy, n (%) | 16 (21.9) |
| CCB | 8 (11.0) |
| ACEI/ARB | 2 (2.7) |
| β-Blocker | 8 (11.0) |
VAS: visual analogue scale; Apo A-1: apolipoprotein A-1; Apo B: apolipoprotein B; PAI-1: plasminogen activator inhibitor-1; hs-CRP: high-sensitivity CRP; CCB: calcium-channel blocker; ACEI: angiotensin-converting enzyme inhibitor; ARB: angiotensin receptor blocker.
Data are expressed as mean (s.d.) unless specified otherwise.
Comparisons of ventricular and arterial stiffness and remodelling between patients and control groups
| Parameter | Controls, n = 50 | PsA without HT or LVH, n = 43 | PsA with HT or LVH, n = 30 | ANOVA, P |
|---|---|---|---|---|
| Age, years | 44 (14) | 43 (12) | 53 (10)*,† | 0.001 |
| Gender, female/male | 22/28 | 20/23 | 16/14 | 0.717 |
| BMI, kg/m2 | 22.8 (3.3) | 24.2 (5.4) | 26.6 (3.7)*,‡ | 0.005 |
| Systolic BP, mm Hg | 120 (12) | 119 (10) | 138 (17)*,† | <0.001 |
| Diastolic BP, mm Hg | 74 (9) | 74 (7) | 82 (11)*,† | <0.001 |
| Stiffness | ||||
| LV end-systolic elastance, mm Hg/ml | 3.86 (0.87) | 4.31 (1.15) | 4.70 (1.32)* | 0.007 |
| LV diastolic elastance | 0.11 (0.03) | 0.13 (0.04)** | 0.20 (0.08)*,† | <0.001 |
| Effective arterial elastance, mm Hg/ml | 2.22 (0.44) | 2.32 (0.45) | 2.78 (0.88)*,‡ | <0.001 |
| Effective arterial elastance to LV end-systolic elastance ratio | 0.51 (0.15) | 0.56 (0.14) | 0.60 (0.13)** | 0.046 |
| Total arterial compliance, ml/mm Hg | 1.26 (0.37) | 1.10 (0.31)** | 0.92 (0.37)*,‡ | 0.001 |
| Aortic augmentation index, % | 14.7 (8.8) | 22.0 (15.5)** | 29.1 (15.3)*,‡ | 0.001 |
| Remodelling | ||||
| Interventricular septum thickness, cm | 0.82 (0.12) | 0.87 (0.16) | 0.94 (0.22)*,‡ | 0.008 |
| LV end-diastolic diameter, cm | 4.68 (0.32) | 4.63 (0.45) | 4.77 (0.34) | 0.274 |
| Posterior wall thickness, cm | 0.79 (0.12) | 0.81 (0.12) | 0.89 (0.15)*,† | 0.003 |
| LV mass index, g/m2 | 74.6 (12.7) | 77.8 (15.5) | 88.5 (21.1)*,‡ | 0.001 |
| RWT | 0.34 (0.05) | 0.35 (0.06) | 0.37 (0.06)** | 0.047 |
| LV remodelling, n (%) | ||||
| Normal geometry | 46 (92.0) | 38 (88.4) | 20 (66.7)* | <0.001 |
| Concentric remodelling | 4 (8.0) | 5 (11.6) | 3 (10.0)* | |
| Eccentric LVH | 0 | 0 | 4 (13.3)* | |
| Concentric LVH | 0 | 0 | 3 (10.0)* | |
| Mean of IMTCCA, mm | 0.62 (0.08) | 0.69 (0.16)** | 0.75 (0.13)* | 0.002 |
| Max of IMTCCA, mm | 0.65 (0.09) | 0.73 (0.17)** | 0.82 (0.15)*,‡ | <0.001 |
| Cardiac function | ||||
| Left ventricle | ||||
| LV ejection fraction, % | 65.1 (6.0) | 64.4 (5.2) | 63.3 (5.7) | 0.410 |
| Mean Sm of LV 12 segments, cm/s | 5.8 (1.0) | 4.5 (1.0)* | 4.2 (1.1)* | <0.001 |
| Mean Em of LV 12 segments, cm/s | 7.8 (1.9) | 7.0 (2.0)** | 5.5 (1.6)*,† | <0.001 |
| E/E′ ratio | 5.8 (1.1) | 6.1 (1.5) | 9.3 (2.8)*,† | <0.001 |
| Subclinical LV dysfunction, n (%) | ||||
| Normal | 41 (82.0) | 24 (55.8) | 5 (16.7) | <0.001 |
| Only diastolic dysfunction | 9 (18.0) | 9 (20.9) | 14 (46.7) | |
| Only systolic dysfunction | 0 | 4 (9.3) | 0 | |
| Both | 0 | 6 (14.0) | 11 (36.7) | |
| Right ventricle | ||||
| PASP, mm Hg | 15.2 (9.7) | 22.6 (10.1)** | 27.3 (13.5)** | <0.001 |
| S′ at tricuspid annulus, cm/s | 13.8 (1.7) | 12.8 (2.4) | 11.7 (1.5)** | 0.001 |
| E′ at tricuspid annulus, cm/s | 14.4 (2.7) | 11.8 (3.2)* | 9.7 (2.0)*,‡ | <0.001 |
ANOVA: analysis of variance; HT: hypertension; BP: blood pressure; IMTCCA: IMT thickness of common carotid artery; PASP: pulmonary arterial systolic pressure; S′: peak systolic annulus velocity.
Data are expressed as mean (s.d.) unless specified otherwise.
*P < 0.005 and **P < 0.05, compared with controls; †P < 0.05 and ‡P < 0.05, compared with PsA without HT or LVH.
Stiffness in patients with PsA
Compared with controls, patients with PsA demonstrated an increase in ventricular and arterial stiffness and an early impairment of LV longitudinal systolic and diastolic function (P < 0.001), even in those without hypertension or LVH (Table 2). Based on the cut-off points deduced from controls (mean +2 s.d.), 28 (38.4%) PsA patients had increased LV stiffness including 23 (31.5%) in diastole (diastolic elastance >0.17) and 13 (17.8%) in systole (end-systolic elastance >5.6), and 11 (15.1%) had increased arterial stiffness (arterial elastance >3.1). Altogether, 31 (42.5%) patients had increased ventricular and/or arterial stiffness, and 20 (27.4%) had only increased LV stiffness. Furthermore, patients without hypertension or LVH presented a higher prevalence of increased ventricular and/or arterial stiffness (27.9% vs. 8.0%, P = 0.011) and LV stiffness (20.9% vs. 6.0%, P = 0.032) compared with matched controls.
Relationship between disease duration and stiffness
Fig. 1 showed the positive correlation between LV diastolic elastance and PsA disease duration (r = 0.472, P < 0.001). Table 3 compared the remodelling and PsA-related parameters between patients with normal and increased LV diastolic stiffness (identified by diastolic elastance >0.17). There was a higher proportion of women, longer PsA disease duration and a higher prevalence of hypertension and remodelling (P < 0.10) in patients with increased LV diastolic stiffness. Multivariable logistic regression analysis showed that PsA disease duration was an independent explanatory variable of LV diastolic stiffness [odds ratio (OR) = 1.12, P = 0.012], and long disease duration (>10 years) contributed more to LV diastolic stiffness (OR = 6.55, P = 0.001) after adjusting for age, gender and hypertension (Table 4).
Similar analysis was repeated between PsA disease duration and other stiffness parameters, showing positive correlation with LV end-systolic elastance (r = 0.238, P = 0.047) and natural logarithm of aortic augmentation index (r = 0.259, P = 0.036) and a negative correlation with total arterial compliance (r = −0.267, P = 0.025) (Fig. 1). However, these correlations were not significant after adjustment for age, gender and hypertension.
Discussion
This study has demonstrated that there is increased ventricular and arterial stiffness in PsA patients, even in those without hypertension and LVH, and this is significantly associated with disease duration.
Stiffness and remodelling in patients with PsA
It has been observed that normal age-related vascular stiffening was accompanied by comparable changes in the LV stiffness and diastolic compliance [14]. Furthermore, this combination concomitance of ventricular and arterial stiffening seems to be common in patients with hypertension and heart failure with preserved ejection fraction [27, 28]. Similar changes were observed in our current study. Does cardiovascular involvement in PsA share the same mechanisms as the ageing process or hypertension? In our study, PsA patients without hypertension and/or LVH still had significantly increased LV elastance and decreased total arterial compliance when compared with the matched control group. In addition, the prevalence of abnormal LV stiffness was significantly higher than that in age, BMI and blood pressure matched controls, whereas vascular ventricular coupling was not different. In a recent study, Costa et al. [29] compared the arterial stiffness (identified by aortic pulse wave velocity) between 20 PsA patients without known cardiovascular risk factors and 20 age, weight and height matched healthy controls, and an increased arterial stiffness was found in patient group after adjusting for age, weight, height, heart rate and central mean pressure. Therefore, there might be other risk factors contributing to cardiovascular stiffness besides the traditional risk factors (hypertension and LVH) and conventional mechanisms (age and vascular ventricular coupling). Furthermore, these changes of ventricular stiffness may have an important detrimental effect on LV mechanics especially on exercise and lead to significant exercise limitation and breathlessness [30].
Ventricular remodelling generally includes cellular proliferation, hyperplasia, necrosis or apoptosis and interstitial fibrosis, which may cause hypertrophy, dilation and stiffening and finally result in cardiovascular dysfunction. Pieretti et al. found increased LV mass and prevalence of LVH (16.9%) in patients with SLE compared with age and gender matched controls and disease-related inflammatory markers related to LV mass index, which suggested inflammation-related arterial stiffening may be the possible reason [31]. Such ventricular remodelling was also found in our study; however, the prevalence of LVH (9.6%) and concentric remodelling (11.0%) was relative low. Furthermore, Gonzalez-Juanatey et al. investigated 50 PsA patients without clinically evident CVD or classic atherosclerosis risk factors and found no significant difference of LV dimension and mass compared with matched controls [32]. In addition, Fukuhara et al. [33] and Eliakim-Raz et al. [34] ever reported a potential relationship between PsA/psoriasis and dilated cardiomyopathy. All the above studies suggest that there is a diversity of remodelling in autoimmune inflammatory diseases and that LVH may be a late manifestation of cardiac involvement in PsA.
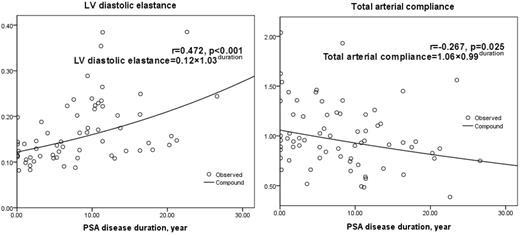
Relationship between stiffness and PsA disease duration.
PsA duration was positively correlated with LV diastolic elastance and negatively correlated with total arterial compliance.
Comparison between patients with normal and increased LV diastolic stiffness
| Parameter | LV diastolic stiffness | ||
|---|---|---|---|
| Normal, n = 50 | Increased, n = 23 | P | |
| Age, years | 46 (13) | 50 (10) | 0.140 |
| Gender, male/female | 30/20 | 7/16 | 0.019 |
| HT, n (%) | 14 (28.0) | 13 (56.5) | 0.019 |
| LV ejection fraction, % | 64.1 (5.4) | 63.6 (5.6) | 0.712 |
| PASP, mm Hg | 23.4 (11.0) | 27.1 (13.3) | 0.219 |
| S′ at tricuspid annulus, cm/s | 12.5 (2.0) | 11.9 (2.2) | 0.290 |
| E′ at tricuspid annulus, cm/s | 11.2 (2.9) | 10.3 (3.0) | 0.205 |
| Remodelling | |||
| LV mass index, g/m2 | 83.1 (19.9) | 80.6 (15.0) | 0.597 |
| RWT | 0.37 (0.07) | 0.35 (0.05) | 0.190 |
| LV remodelling, n (%) | |||
| Normal geometry | 39 (78.0) | 19 (82.6) | 0.054 |
| Concentric remodelling | 8 (16.0) | 0 | |
| LVH | 3 (6.0) | 4 (17.4) | |
| Mean of IMTCCA, mm | 0.71 (0.15) | 0.72 (0.13) | 0.877 |
| Max of IMTCCA, mm | 0.76 (0.17) | 0.78 (0.15) | 0.716 |
| PsA-related parameters | |||
| Age at psoriasis diagnosis, years | 35 (16) | 33 (12) | 0.864 |
| Age at PsA diagnosis, years | 38 (13) | 39 (10) | 0.853 |
| Psoriasis duration, median (IQR), years | 4.9 (1.2–9.3) | 10.8 (9.4–13.4) | 0.003 |
| PsA duration, median (IQR), years | 8.4 (4.0–15.3) | 14.6 (10.1–25.3) | 0.001 |
| PsA duration >10 years, n (%) | 11 (22.0) | 15 (65.2) | <0.001 |
| Disease pattern, n (%) | |||
| Peripheral | 44 (88.0) | 17 (73.9) | 0.131 |
| Spondylarthritis | 6 (12.0) | 6 (26.1) | |
| Disease activity, n (%) | |||
| Inactive (DAS28 ≤ 3.2) | 19 (38.0) | 9 (39.1) | 0.803 |
| Moderately active (3.2 < DAS28 ≤ 5.1) | 19 (38.0) | 10 (43.5) | |
| Very active (DAS28 > 5.1) | 12 (24.0) | 4 (17.4) | |
| PASI, median (IQR) | 1.8 (0.8–7.7) | 3.3 (1.8–8.8) | 0.173 |
| Apo A-1, mg/dl | 153.9 (33.3) | 146.1 (31.7) | 0.441 |
| Apo B, mg/dl | 84.1 (17.5) | 81.6 (13.1) | 0.662 |
| ESR, median (IQR) mm/h | 16.0 (9.0–37.0) | 26.0 (14.5–44.0) | 0.296 |
| hs-CRP, median (IQR) mg/l | 4.0 (1.6–12.5) | 4.3 (1.3–15.4) | 1.000 |
| Medical therapy, n (%) | |||
| Current NSAIDs | 31 (62.0) | 16 (69.6) | 0.531 |
| Current DMARDs | 27 (54.0) | 14 (60.9) | 0.583 |
| Current anti-hypertensive therapy | 9 (18.0) | 7 (30.4) | 0.233 |
Data are expressed as mean (s.d.) unless specified otherwise. Apo A-1: apolipoprotein A-1; Apo B: apolipoprotein B; HT: hypertension; PASP: pulmonary arterial systolic pressure.
PsA disease duration: a surrogate long-term inflammatory burden and a risk factor for stiffness
Many studies have verified that inflammation may accelerate cardiovascular damage by its involvement in atherosclerosis, contributing to cardiac fibrosis [35], and accelerating necrosis and apoptosis. In general, inflammation may lead to so-called functional stiffening of the large arteries because of reduced nitric oxide bioavailability and increased activity of opposing mediators such as endothelin-1 [36, 37], and structural stiffening of the larger vessels because of smooth muscle cell proliferation and increased synthesis of structural proteins including collagen [38]. Recent studies have found evidence of CVD in SLE without any clinically obvious CVD, such as LVH, subclinical myocardial dysfunction and increased arterial stiffness, which were associated with disease duration, severity and/or activity [31, 39, 40]. Similar findings were also reported in RA [41]. Moreover, the disease-modifying anti-rheumatic drugs could improve inflammation-associated arterial stiffness [42]. All these studies not only confirmed the role of inflammation in the pathogenesis of CVD but also demonstrated that patients with autoimmune inflammatory diseases are vulnerable to developing CVD early.
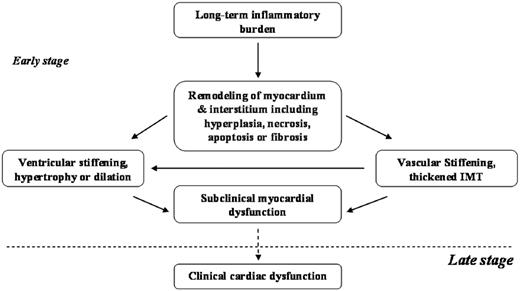
Cardiovascular remodelling, stiffening and dysfunction in patients with PsA.
Here, the possible relationship between inflammatory burden and cardiovascular remodelling, stiffening and dysfunction in patients with PsA is shown. In the early stage of cardiovascular involvement, long-term inflammatory burden may contribute to increased cardiovascular stiffness and remodelling, which subsequently results in subclinical myocardial dysfunction.
Risk factors of increased LV diastolic stiffness
| Parameter | Logistic regression analysis | |
|---|---|---|
| Univariate | Multivariate | |
| OR (95% CI) | OR (95% CI) | |
| Age, years | 1.03 (0.99, 1.08) | – |
| Female gender | 3.43 (1.20, 9.80) | 3.12 (1.01, 9.57) |
| HT | 3.34 (1.19, 9.36) | – |
| LV remodelling | 1.18 (0.55, 2.52) | – |
| PsA duration | 1.12 (1.03, 1.22) | 1.12 (1.02, 1.22) |
| PsA duration > 10 years | 6.65 (2.24, 19.74) | 6.55 (2.11, 20.32) |
PsA with long disease duration is characterized by a remitting and relapsing disease course, that is to say, long disease duration can be considered as a surrogate of long-term inflammatory burden. This was borne out in our current study as disease duration positively correlated with ventricular and arterial elastance and negatively with total arterial compliance. Also, disease duration was an independent factor of LV diastolic stiffening after adjusting for gender, hypertension and LV remodelling. In addition, patients with long disease duration (>10 years) had a higher risk of LV stiffening. This is similar to results from the study by Costa et al. [29], where a positive relationship was found between arterial stiffness and PsA duration after adjusting for age, weight, height, heart rate and central mean pressure. Although there was no correlation between stiffness and classic inflammatory markers, such as ESR and high-sensitive CRP in either Costa et al. [29] or our studies, the potential relationship between ventricular stiffening and inflammatory burden remains highly likely. Laboratory results just report the inflammatory status at one time point, which could not reflect the totality of the inflammatory burden since the onset of the disease. Fig. 2 summarized a possible relationship between inflammatory burden and cardiovascular remodelling, stiffening and dysfunction in patients with PsA. Finally, although there was a significant difference in the duration of psoriasis between patients with normal and increased LV diastolic stiffness, it was not included into the multi-regression analysis because psoriasis and PsA disease duration belong to the same category, with both indirectly reflecting long-term inflammatory burdens.
In this current study, female gender was the other independent risk factor for LV diastolic stiffness. A community-based study that investigated >2000 subjects also reported that female gender was associated with increases in vascular and ventricular systolic and diastolic stiffness even in the absence of CVD [14]. The cause of gender differences in ventricular and arterial stiffening is unclear, although several studies suggested the effects of body size and vasculature length on arterial stiffness [43, 44].
The obvious limitation of this study is the relatively the small sample size and no intervention to improve those with increased cardiovascular stiffness, but the results seem clear even with this sample size. In conclusion, this is the first case–control study to assess ventricular and arterial stiffness in PsA, and an increase in cardiovascular stiffness was found in patients with PsA, even in those without hypertension and LVH; disease duration as a long-term inflammatory surrogate may be an independent risk factor.
Disclosure statement: The authors have declared no conflicts of interest.

Comments