

Abstract
Objective. Cardiovascular (CV) risk estimation calculators for the general population do not perform well in patients with rheumatoid arthritis (RA). An RA-specific risk calculator has been developed, but did not perform better than a risk calculator for the general population when validated in a heterogeneous multinational cohort.
Methods. In a cohort of patients with new-onset RA from northern Sweden (n = 665), the risk of CV disease was estimated by the Expanded Cardiovascular Risk Prediction Score for Rheumatoid Arthritis (ERS-RA) and the American College of Cardiology/American Heart Association algorithm (ACC/AHA). The ACC/AHA estimation was analyzed, both as crude data and when adjusted according to the recommendations by the European League Against Rheumatism (ACC/AHA × 1.5). ERS-RA was calculated using 2 variants: 1 from patient and physician reports of hypertension (HTN) and hyperlipidemia [ERS-RA (reported)] and 1 from assessments of blood pressure (BP) and blood lipids [ERS-RA (measured)]. The estimations were compared with observed CV events.
Results. All variants of risk calculators underestimated the CV risk. Discrimination was good for all risk calculators studied. Performance of all risk calculators was poorer in patients with a high grade of inflammation, whereas ACC/AHA × 1.5 performed best in the high-inflammatory patients. In those patients with an estimated risk of 5–15%, no risk calculator performed well.
Conclusion. ERS-RA underestimated the risk of a CV event in our cohort of patients, especially when risk estimations were based on patient or physician reports of HTN and hyperlipidemia instead of assessment of BP and blood lipids. The performance of ERS-RA was no better than that of ACC/AHA × 1.5, and neither performed well in high-inflammatory patients.
The risk of cardiovascular disease (CVD) is increased in patients with rheumatoid arthritis (RA)1,2 and the case fatality following a stroke or myocardial infarction (MI) is increased3,4. Considering this fact, identification of patients with RA having a high risk of CV events is important, to allow preventive actions. Several calculators have been developed for estimating the risk of a CV event in the general population, but in patients with RA, risk calculators developed for the general population do not perform accurate risk estimations5,6,7. In an attempt to overcome this, an adapted and recalibrated version of the European Systematic Coronary Risk Evaluation algorithm (SCORE)8 was developed from a population of patients with RA in the Netherlands9. This new SCORE included inflammatory disease activity and recalibration of the traditional risk factors, but only performed marginally better than the original version of SCORE in patients with RA. The Trans-Atlantic Cardiovascular Risk Consortium for Rheumatoid Arthritis recently developed a risk calculator, but it was not superior to risk calculators used for the general population10. Another RA-specific risk calculator, the Expanded Risk Score for cardiovascular disease in RA (ERS-RA), was introduced in 201511. Likewise, when ERS-RA was validated externally, it did not perform better than risk calculators for the general population7, but that test was done in a heterogeneous cohort of patients. The cohort included patients with varying disease duration from 7 different countries. No validation of ERS-RA has previously been made in a cohort of patients with RA who are homogeneous in disease duration and geographical origin, to our knowledge.
The primary aim of our present study was to assess the predictive accuracy of ERS-RA in a cohort of patients with new-onset RA from northern Sweden, and to compare it with a risk calculator without RA-specific risk factors but otherwise as similar as possible.
MATERIALS AND METHODS
Study design
This is a prospective, longitudinal study of estimated CV risk and observed CV events in an inception cohort of patients with new-onset RA. The estimated 10-year risk of a CV event was, for every individual patient, calculated according to risk score algorithms. The calculation was based on data from the time of inclusion in the cohort (i.e., a diagnosis of RA). The estimated risk was compared to the observed CV events during the first 10 years after inclusion in the cohort. The end date of the study was December 31, 2013. If an individual patient’s duration of followup was < 10 years, the estimated 10-year risk was adjusted proportionally to that duration6.
The study was performed in line with the Helsinki declaration and approval was obtained from the regional Board of Ethics at Umeå University (approval number 2012-208-31M). All participants gave their written informed consent.
Patients and data collection
In northern Sweden, all patients with new-onset RA (i.e., symptomatic for < 1 year) and fulfilling the American College of Rheumatology 1987 criteria12 are registered in a prospective study of the progress of RA and comorbidities. The first patients were included in December 1995. Patients taking part until October 2009 were included in the present study. The criteria for inclusion of patients and data collection have previously been described in full13. Briefly, patient records were examined according to an established protocol, and the patients completed a self-reported questionnaire on comorbidities, CV risk factors, and pharmacological treatment. Up to November 2012, 950 patients had been included. The resulting database contains information on swollen and tender joint counts, patient’s visual analog scales (VAS) on global assessment, the physician’s assessment of disease activity, Health Assessment Questionnaire (HAQ)14, corticosteroid treatment, blood pressure (BP), erythrocyte sedimentation rate (ESR), blood lipid levels, antihypertensive medication, lipid-lowering treatment, diagnosis of dyslipidemia and/or hypertension (HTN), smoking, diabetes, age, and sex. Lipid levels at inclusion were analyzed at the local clinical chemistry laboratories using the standard protocols available at the time of inclusion. Patients with a history of CVD prior to the diagnosis of RA, or without any registered values of disease activity at inclusion, were excluded from our present study.
Outcome
Consistent with the risk calculators studied, outcome was defined as fatal and nonfatal MI, coronary heart death, and fatal and nonfatal stroke. These codes from the International Classification of Diseases, 10th edition (ICD-10), were included: ICD-10 codes I21–I23, I24.8–I24.9, I60–I61, I62.1, I62.9, and I63–I64. Corresponding codes in ICD-9 were used. Data on outcomes were retrieved from the National Inpatient register and the Cause of Death Register at the National Board of Health and Welfare15. Events until December 31, 2013, were included.
Risk calculators
In ERS-RA, the 10-year risk of a CV event is calculated from traditional CV risk factors (age, sex, diabetes, HTN, hyperlipidemia, tobacco use) and RA-specific factors [Clinical Disease Activity Index (CDAI) > 10, modified HAQ > 0.5, use of prednisone, and an RA duration > 10 yrs]. CDAI includes a VAS on the physician’s assessment of global health (PGA), but in the cohort database a 5-level scale of disease activity (none, modest, medium, high, maximal) is registered. For calculation of CDAI, these levels were interpreted as the PGA values 0, 2.5, 5, 7.5, and 10, respectively. Use of tobacco was interpreted as current smoking. HTN and hyperlipidemia are dichotomous variables in ERS-RA and based on physician’s report. In our population of patients, measurements of lipid levels and BP were performed in most patients at inclusion, making it possible to calculate ERS-RA from 2 sets of variables. In the first set [ERS-RA (reported)], HTN and hyperlipidemia were defined when diagnoses were reported by physician or patient, or when antihypertensive medication or lipid-lowering agents were prescribed. In the second set [ERS-RA (measured)], both reports and actual measurements were used for the definition of HTN and hyperlipidemia. HTN was defined as BP > 140/90 mmHg. Hyperlipidemia was defined as lipid levels above normal or optimal levels [i.e., total cholesterol > 5.17 mmol/l (200 mg/dl), triglycerides > 1.69 mmol/l (150 mg/dl), or non–high-density lipoprotein (HDL) > 4.14 mmol/l (160 mg/dl)]16. The definition of hyperlipidemia is from the Third Report of the National Cholesterol Education Program (NCEP) Expert Panel on Detection, Evaluation, and Treatment of High Blood Cholesterol in Adults (adult treatment panel III) Final Report, because the ERS-RA was developed in a United States cohort of patients with RA started in 2001, making it plausible that the patients in that cohort were classified according to these definitions.
The 2013 American College of Cardiology/American Heart Association algorithm (ACC/AHA) risk calculator17 was used as a comparator. The calculation in ACC/AHA is based on age, sex, use of antihypertensive treatment, BP, total cholesterol, HDL cholesterol, diabetes, smoking, and race (African American or other). The outcomes in ACC/AHA and ERS-RA are equal and both are developed from populations in the US. The only major difference is the age span; ERS-RA calculates 10-year risk in individuals 20–79 years old, but ACC/AHA calculates 10-year risk in individuals 40–79 years old. In this study, calculations were performed with the assumption that no patient was African American, although no information on geographic background or ethnicity is included in the database. The European League Against Rheumatism (EULAR) 2016 recommendations for management of CV risk state that the estimated risk should be multiplied by 1.5 for patients with RA18. Therefore, we analyzed the “crude” risk estimated by the ACC/AHA algorithm, as well as the risk multiplied by 1.5 (hereafter designated ACC/AHA × 1.5).
Statistics
Every patient’s individual 10-year risk for a CV event was calculated from the baseline data using both the ERS-RA and ACC/AHA. Multiple imputation was used to impute missing values for the risk factors using 5 repetitions. When the duration of followup was < 10 years, the risk was adjusted proportionally to the time of followup. The accuracy of estimations was assessed in terms of calibration (comparing observed and estimated events) and discrimination (the ability to correctly rank individuals from low to high risk).
Calibration was assessed using deciles of estimated risk, comparing observed events and estimated risk. The Hosmer-Lemeshow (HL) test was used to assess the fit of the estimations. HL produces a p value — the higher it is, the better the fit. Discrimination was assessed by calculation of the area under the curve (AUC) of receiver-operating characteristics (ROC) curves. In their 2013 guideline, the ACC and the AHA state that a 10-year risk of 7.5% or higher should be regarded as an elevated risk17. The number of observed events and those events estimated from the risk calculators were compared according to this level. Statistical analysis was performed using SPSS version 21 (IBM SPSS Inc.).
RESULTS
Overall, 950 individuals with new-onset RA were included in the patient cohort. After exclusion of patients with a previous CVD, or without any laboratory-derived values indicative of inflammatory activity at inclusion, 810 patients remained. Patients aged younger than 40 years were not included in the analysis, because ACC/AHA is not applicable in that age group. Of the remaining patients, 665 (458 female, 207 male) were between 40 and 80 years old at inclusion and therefore within the age span for ERS-RA. Further, 662 patients (455 female, 207 male) were aged 40–79 years old, and therefore appropriate for ACC/AHA. The mean followup period was 8.5 years (SD 0.2). Baseline variables are presented in Table 1. During the followup, 73 patients (11.0%) developed a CV event (9 cases of death due to CVD, 25 cases of MI, 39 cases of stroke). Of the female patients, 38 (8.3%) had an event, compared with 35 (16.9%) of the male patients. One event occurred in a patient aged 80 years old at inclusion, making the number of observed events 72 when ACC/AHA data were analyzed.
Characteristics of the 665 patients with RA (aged 40–80 years) included in the study.
Calibration
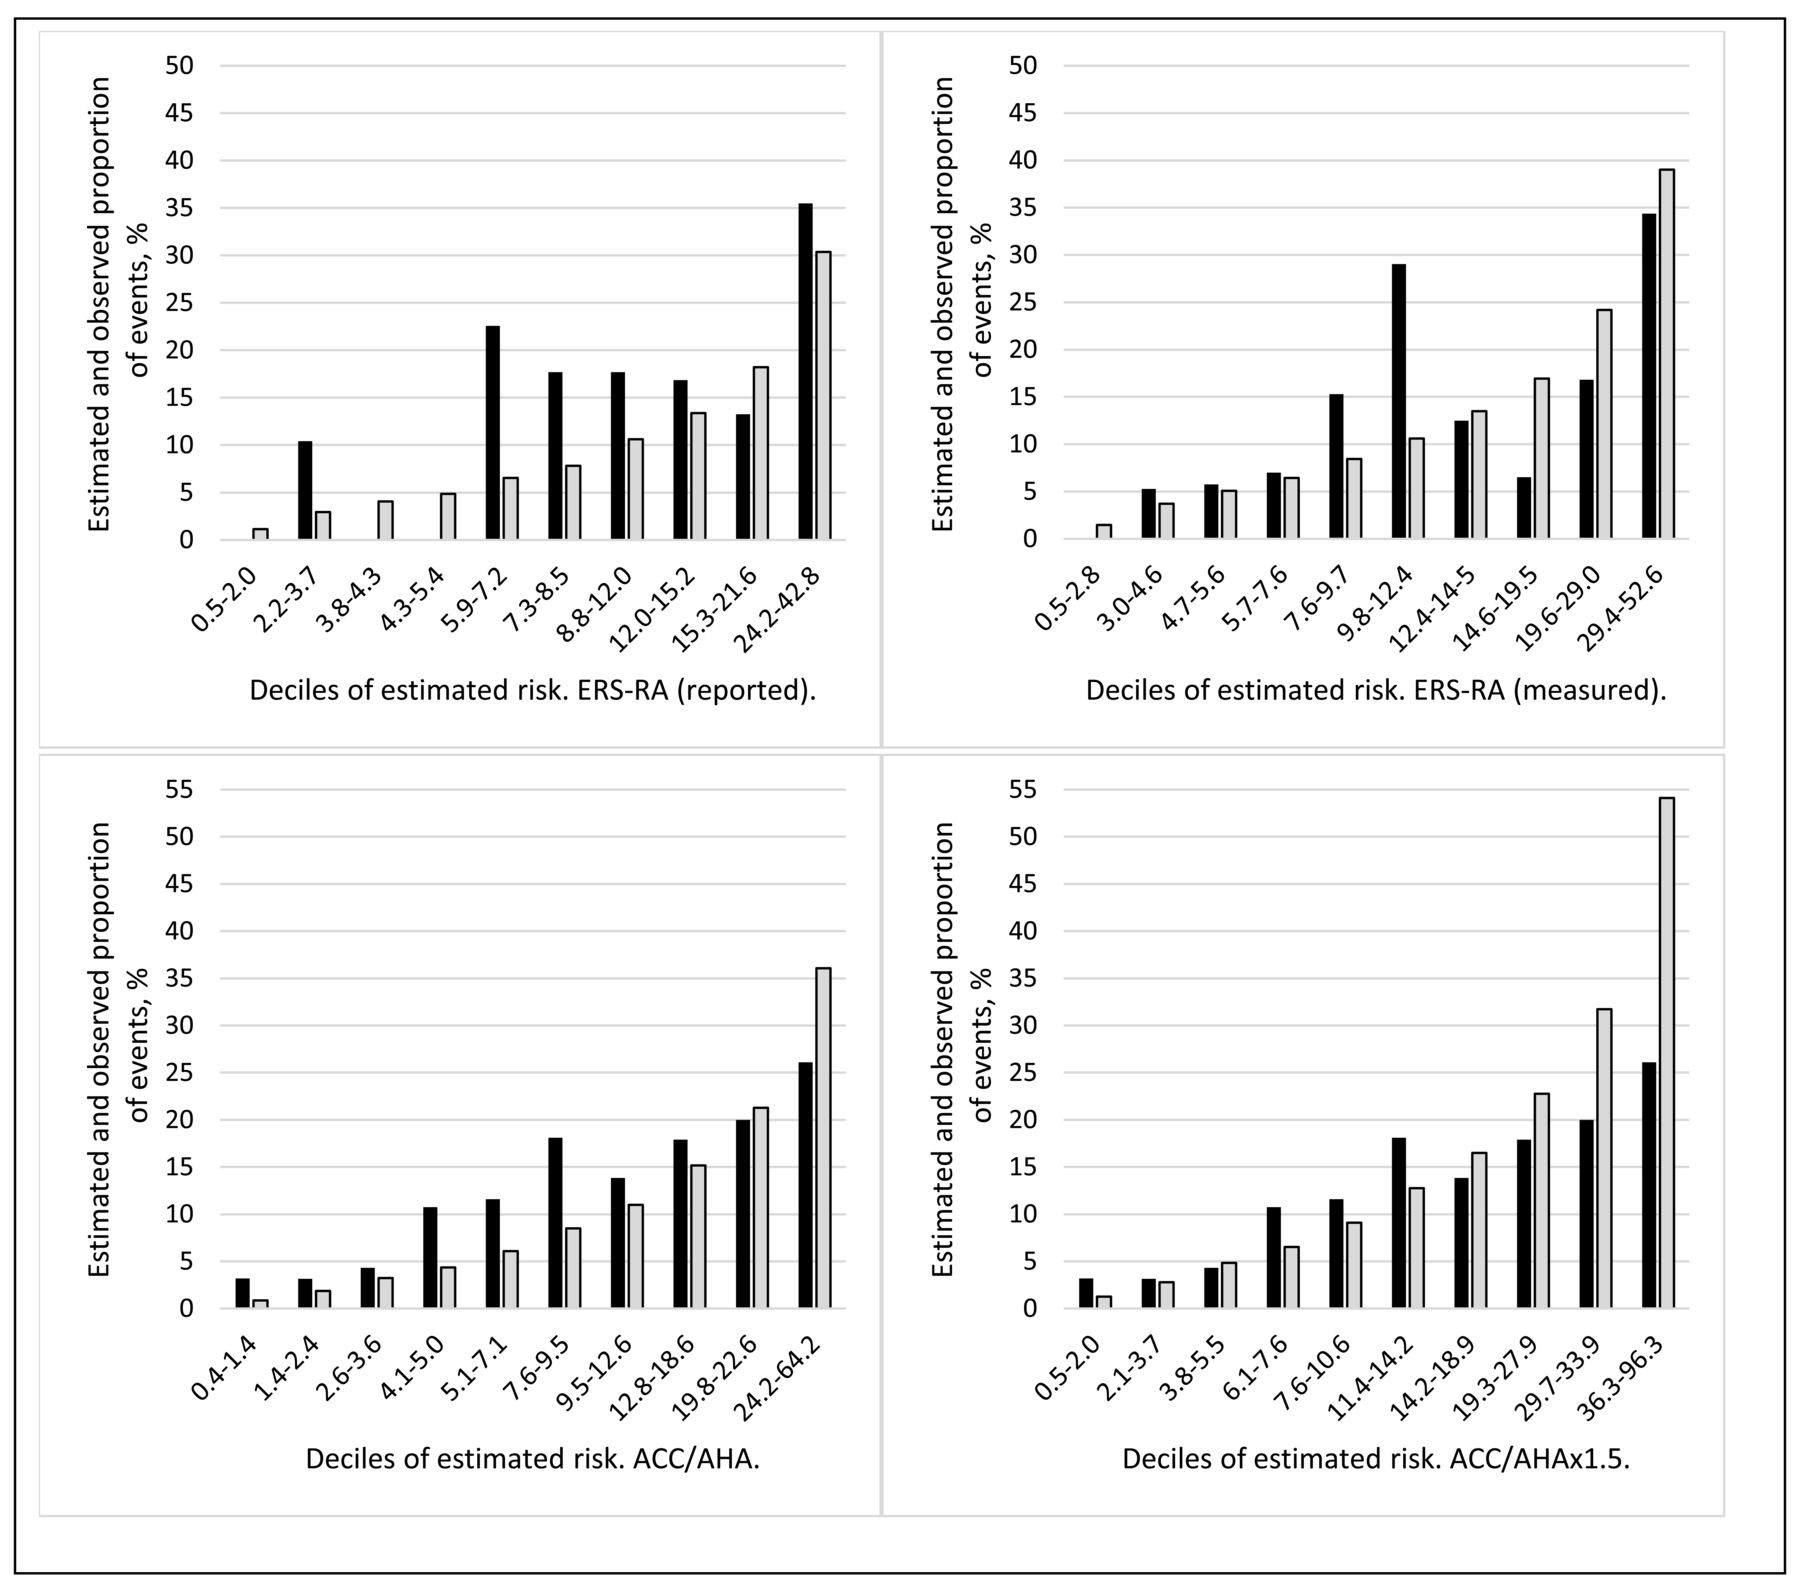
The estimated median 10-year risk for ERS-RA (reported) and ERS-RA (measured) was 6.3% and 8.3%, respectively. As stated above, the observed proportion of patients having an event was 11.0%. Further data on risk estimations are presented in Table 2. Figure 1 illustrates the observed and estimated events according to deciles of estimated risk. The ratio between observed and predicted events differed between deciles for all risk calculators, the most pronounced being for ERS-RA (reported) and ERS-RA (measured). Corresponding to this, the model fit assessed with HL was poor (i.e., low p values). The p value for ERS-RA (reported) was 0.005 and that for ERS-RA (measured) was 0.018. The ACC/AHA variants exhibited a slightly better model fit, with p values of 0.091 for ACC/AHA and 0.091 for ACC/AHA × 1.5.

Observed and predicted proportion of events in deciles of estimated risk from ERS-RA (reported; upper left), ERS-RA (measured; upper right), ACC/AHA (lower left), and ACC/AHA × 1.5 (lower right). Black bars are observed proportion of events, grey bars estimated proportion of events. Numbers on x-axis denote the range of estimated risk for every decile. ERS-RA: Expanded Cardiovascular Risk Prediction Score for Rheumatoid Arthritis; ACC/AHA: American College of Cardiology/American Heart Association.
Cardiovascular risk estimations from the risk scores, calculated for the patients with RA included in the study.
A subgroup analysis was undertaken to investigate the performance of the risk calculators in patients with 5–15% estimated risk. Table 3 summarizes the observed events and estimated risk in that subset of patients. ERS-RA (reported) largely underestimated the risk in this subset of patients (8.3% estimated events vs 14.0% observed events).
Estimated risk, proportion of patients with observed events, and area under the curve (AUC) of the ROC curves in RA patients with estimated cardiovascular risk of 5–15 %.
Discrimination
Discrimination was good for both variants of ERS-RA and both variants of ACC-AHA. The AUC of the ROC curves were for ERS-RA (reported) 0.77 (95% CI 0.72–0.82), for ERS-RA (measured) 0.76 (95% CI 0.71–0.81), and for both variants of ACC-AHA 0.77 (95% CI 0.72–0.83). However, the values of AUC for male patients were lower [i.e., 0.70 (95% CI 0.61–0.79) for both ERS-RA variants and 0.71 (95% CI 0.62–0.80) for both variants of ACC/AHA]. In patients with an estimated risk of 5–15%, the discrimination was poor (Table 3). ERS-RA (reported) had an AUC of only 0.52 (0.43–0.61), meaning that it hardly discriminates at all. The other risk calculators had AUC of 0.59–0.60.
Reclassification and predictive values
In the Supplementary Data (available with the online version of this article), tables are presented in which the risk calculators are compared to each other regarding the classification of patients as having an elevated risk (10-yr risk ≥ 7.5%) or a low risk (10-year risk < 7.5%). Each table presents how the patients are classified by 2 risk calculators and in what risk categories the patients with future events are classified. Reclassification of patients with future events from the low-risk category to the high-risk category means that the patients could be subject to primary preventive actions. Both ACC/AHA and ERS-RA (measured) reclassified patients that were incorrectly classified as having a low risk by ERS-RA (reported). The predictive values of risk classification and the proportion of events occurring in patients classified as low risk are presented in Table 4. ERS-RA (measured) had both the highest positive and negative predictive values, but the differences between the risk calculators were small.
Predictive values and distribution of events.
High-inflammatory patients
The calibration of all risk calculators was poor in patients with an ESR in the highest quartile (ESR ≥ 40 mm/h). The observed proportion of events in this subset of patients was 12.1%, the estimated proportion 7.2–11.4% as presented in Table 2. ACC/AHA adjusted according to EULAR recommendations (ACC/AHA × 1.5) produced higher risk estimations than both variants of ERS-RA. The ratio of observed:estimated events varied largely across deciles in this subset of patients (Figure 2). Discrimination was poorer for all risk calculators in this subset of patients. The AUC was for ERS-RA (reported) 0.70 (95% CI 0.60–0.80), for ERS-RA (measured) 0.78 (95% CI 0.68–0.79), and for both variants of ACC/AHA 0.68 (95% CI 0.57–0.78).
Observed and predicted proportion of events in deciles of estimated risk in patients with ESR ≥ 40 mm/h. ERS-RA (reported) is upper left, ERS-RA (measured) upper right, ACC/AHA lower left, and ACC/AHA × 1.5 lower right. Black bars are observed proportion of events, grey bars estimated proportion of events. Numbers on x-axis denote the range of estimated risk for every decile. ERS-RA: Expanded Cardiovascular Risk Prediction Score for Rheumatoid Arthritis; ACC/AHA: American College of Cardiology/American Heart Association.
DISCUSSION
The present external validation of ERS-RA showed that this risk prediction calculator underestimated the risk of a CV event in a cohort of Swedish patients with new-onset RA. Underestimation was most pronounced when the risk estimation was based on physician’s or patient’s reports of hyperlipidemia and HTN (risk model ERS-RA reported). These diagnoses are underreported in our cohort of patients with RA, similar to results from previous studies in other cohorts19. When measured values of blood lipids and BP were used to identify patients with hyperlipidemia and HTN (ERS-RA measured), the median estimated 10-year risk increased from 6.3% to 8.3%. Although an improvement, this number should be compared with the observed 11.0% of patients having a CV event during the followup period. Also, the ACC/AHA risk calculators underestimated the risk of CV events. Previous studies by our group have shown that patients with RA in northern Sweden have an increased risk of both stroke3 and MI4 compared with the general population. White females in general have a low CV risk before they reach old age, but in patients with RA this does not hold true. Considering this, underestimation was expected for ACC/AHA. However, the model fit for ACC/AHA was better with the underestimation more evenly distributed between the deciles of estimated risk. When the ACC/AHA estimation was amended according to the EULAR recommendations18, the resulting risk estimation (ACC/AHA × 1.5) was the least underestimating of the risk calculators tested (Table 2). ACC/AHA × 1.5 overestimated the risk in the highest deciles, but that is of little clinical importance, because the patients in those deciles still had a risk far beyond any threshold of prevention.
Discrimination was good for all risk calculators, with area under the ROC curves of 0.76–0.77. Previous studies of risk estimation in patients with RA have shown acceptable, or good, overall discrimination, but poor calibration. Even though the patient cohort in the present study is homogeneous in disease duration, geographic origin, and ethnicity, our results are similar to the previous studies5,6,7.
The ERS-RA (reported) risk calculator is inferior to ERS-RA (measured) and to both variants of ACC/AHA in accurately classifying patients as having a low (< 7.5%) or elevated (≥ 7.5%) 10-year risk. Negative predictive values do not differ much, but nevertheless as many as 24.7% of the events were in patients classified as low risk by ERS-RA (reported). ERS-RA (measured) reclassified half of these patients with future events to the group with an elevated risk. This implies that measuring BP and blood lipids, and strictly following definitions, is crucial when using ERS-RA. The median estimated risk was almost equal for ERS-RA (reported) and ACC/AHA (Table 2), but risk classification was more accurate for ACC/AHA (Table 4), reflecting the better discrimination in patients with 5–15% risk. Multiplying ACC/AHA according to EULAR recommendations did not improve the risk classification.
In a previous study by Crowson, et al6, both Framingham and Reynolds risk score underestimated the risk in patients with persistently elevated ESR. In our present study, both calibration and discrimination were poorer in those patients in the highest quartile of ESR (≥ 40 mm/h; Figure 2) for all risk calculators. Bearing in mind that high-inflammatory patients with RA have a higher risk of CV events20,21 and lowered blood lipids because of inflammation22, an underestimation in this subset of patients could be expected for ACC/AHA, because it includes only traditional CV risk factors. The ERS-RA risk calculator, on the other hand, does include variables reflecting inflammatory activity, but nevertheless did not perform better than ACC/AHA in patients with high inflammatory activity. ACC/AHA × 1.5 was in our study the best risk calculator in high-inflammatory patients, despite the lack of inflammatory variables in the algorithm. A possible explanation of the inability of ERS-RA to outperform ACC/AHA in high-inflammatory patients could be that variables reflecting inflammatory activity in ERS-RA are dichotomous, with low cutoffs (CDAI > 10 and HAQ > 0.5). If inflammatory activity were included as continuous or stratified variables, it would possibly improve the risk estimations made with ERS-RA.
The most important patients to classify correctly are those with an expected risk around the threshold to an elevated risk, to undertake primary preventive action(s) for the right individuals. In our present study, discrimination of patients with an estimated risk of 5–15% was poor for all risk calculators. ERS-RA (reported) had the poorest discrimination, with an AUC of 0.52 (95% CI 0.43–0.61), indicating that it was not much better than chance. Calibration in patients with an estimated risk of 5–15% was acceptable for ERS-RA (measured) and ACC/AHA × 1.5, but ERS-RA (reported) and ACC/AHA underestimated the risk in this subset of patients (Table 3). These results indicate that without measurement of BP and blood lipids, the risk estimation of ERS-RA is inaccurate in the subset of patients for whom accuracy is needed most.
In the 2013 ACC/AHA guidelines, attaining a 10-year risk of 7.5% did not equate to statin treatment. There had to be a clinician-patient discussion to make that decision. Additional risk factors that could be considered in that discussion included family history of premature CV disease, high coronary artery calcium score, elevated high-sensitivity CRP, or ankle-brachial index < 0.923. Also, RA should be included as a risk factor in that discussion. Our results suggest that multiplying the estimated risk by 1.5, as proposed by EULAR18, would be helpful for the risk discussion in patients with RA.
This study has several strengths. The patient cohort essentially comprises all patients diagnosed with RA who are resident in the northernmost region of Sweden, because all patients considered to have new-onset RA in Sweden are referred to a rheumatologist. Thus, no selection of patients has been made and a low number of physicians are involved in the assessment of the patients. Another overall strength are the events studied. They are “hard” events (MI, stroke, death due to CV disease), decreasing the risk of false diagnoses or missed events. The cohort of patients is not only a strength but also a limitation. The patients in our present study are white and living in a defined region, which may limit the ability to generalize our results to other, more diverse, populations. Another confounder is that ERS-RA is developed from a US population and may not be well fitted for Swedish patients with RA, but this possible bias is partly abrogated by comparing it to the US-developed ACC/AHA. Our cohort is not very large, making the number of events relatively small.
ERS-RA underestimated CV events in Swedish patients with new-onset RA, especially when diagnoses of HTN and hyperlipidemia were based on the patient’s or physician’s report, without assessment of BP or blood lipids. Unfortunately, ERS-RA had its shortcomings in patients with a moderate risk, for whom a correct risk estimation is most needed. Although ERS-RA includes inflammatory variables, it did not outperform ACC/AHA multiplied by 1.5 (as recommended by EULAR) in high-inflammatory patients.
ONLINE SUPPLEMENT
Supplementary material accompanies the online version of this article.
Acknowledgment
The authors thank statisticians Hans Stenlund, Department of Public Health and Clinical Medicine/Epidemiology and Global Health, Umeå University, and Fredrik Jonsson, Department of Public Health and Clinical Medicine, Umeå University, for valuable discussions.
Footnotes
Supported by grants from County Council of Västerbotten, Swedish Rheumatism Association, Medical Faculty of Umeå University, and the King Gustav V’s 80-Year Fund.
- Accepted for publication July 3, 2018.


