
Abstract
Objective. In rheumatoid arthritis, composite outcomes constructed from a combination of outcome measures are widely used to enhance responsiveness (sensitivity to change) and comprehensively summarize response. Western Ontario and McMaster Universities Osteoarthritis Index (WOMAC) pain is the primary outcome measure in many osteoarthritis (OA) trials. Information from other outcomes, such as rescue medication use and other WOMAC subscales, could be added to create composite outcomes, but the sensitivity of such a composite has not been tested.
Methods. We used data from a completed trial of tanezumab for knee OA (NCT00733902). The WOMAC questionnaire and rescue medication use were measured at several timepoints, up to 16 weeks. Pain and rescue medication outcomes were standardized and combined into 3 composite outcomes through principal components analysis to produce 1 score (composite outcome) and their responsiveness was compared to WOMAC pain, the standard. We pooled all treatment doses of tanezumab into 1 treatment group, for simplicity, and compared this to the control group (placebo).
Results. The composite outcomes showed modestly, but not statistically significantly greater responsiveness when compared to WOMAC pain alone. Adding information on rescue medication to the composite improved responsiveness. While improvements in sensitivity were modest, the required sample sizes for trials using composites was 20–40% less than trials using WOMAC pain alone.
Conclusion. Combining information from related but distinct outcomes considered relevant to a particular treatment improved responsiveness, could reduce sample size requirements in OA trials, and might offer a way to better detect treatment efficacy in OA trials.
- OSTEOARTHRITIS
- OUTCOMES
- PAIN
- SENSITIVITY TO CHANGE
- RESPONSIVENESS
Clinical trialists have a tendency to measure many outcomes. Several of these outcomes (often deliberately) cover overlapping “domains,” attempting to ensure that the “signal” of a true change in an outcome following an intervention is identified. Pain is a good example; researchers will often use a variety of similar pain-related outcomes in interventional trials.
Pain is a complex, multidimensional measure1,2, and generating just 1 scale or item that adequately records most, if not all, aspects of pain is challenging. Further, because pain is strongly related to functional limitation3, the most appropriate pain outcome might cover aspects of both pain and function. The optimal clinical trial pain outcome(s) should additionally be sensitive to change following an intervention, by which we mean the outcome’s ability to detect a change, often also termed an outcome’s responsiveness4, discriminating well between a true signal (treatment effect) and noise (random variation).
Composite outcomes are a way of combining (often related) indices or scores to form 1 overall outcome. This approach, which has been used in many disease areas including osteoarthritis (OA)5, rheumatoid arthritis6,7,8, and asthma9, may improve the identification of a domain more completely because it takes account of more information than 1 outcome alone. Pain measurement appears particularly suited to this approach, given its complexity. Combining information from several different domains may improve a composite’s ability to detect a change when one truly occurs, and therefore responsiveness may also be improved.
There are several methods for combining outcomes into composites. Some of these facilitate domain coverage; others increase responsiveness. Ideally, the method used should improve both. The simplest method of combining 2 or more outcomes is through summing or averaging them5. This method assumes that the constituent outcomes have equal weighting in the composite, and that units from the constituent outcomes are comparable and exchangeable.
A second method of combining multiple outcomes is through the use of weights to assign the “importance” of constituent outcomes. The composite is produced by multiplying each constituent outcome by its weight, and then summing these scores. An example of this is the 28-joint count Disease Activity Score (DAS28)6,7. Weights can be derived from a variety of sources, including statistical modeling (as with the DAS), but also from group consultation, for example through a Delphi exercise10,11,12,13,14.
Another data-driven approach uses principal components analysis (PCA), a data-reduction method that inherently concentrates as much variance from constituent outcomes into as few factors as possible. This method may produce a composite outcome that more completely identifies the variance from an underlying multidimensional process, such as pain.
Theoretically, combining several outcomes purporting to measure aspects of pain and its consequences, such as function loss and rescue medication use, should increase domain coverage (because each outcome contributes some information about the pain signal) and therefore responsiveness. Because all of the contributing outcomes should measure that same latent factor (pain), the analysis model used should assume a priori a 1-factor solution, rather than generating multiple outcomes. In this way, we can combine all outcomes related to pain into 1 composite outcome, which it is hoped will show maximal responsiveness in pain.
This study sought to combine several pain outcomes using PCA, taken from a large completed clinical trial of a treatment that reduced pain, and compare the relative responsiveness of these composites to the uncombined WOMAC pain subscale score alone, to establish whether the inclusion of additional pain information improves responsiveness following administration of an intervention.
Assessment of responsiveness is optimal in certain trial designs. The ideal trial should contain a treatment arm with an intervention that is known to truly change the construct of interest (pain, for example); a control arm that is known to not truly change the construct of interest; and at least 2 (ideally more) timepoints in both arms, over which the change in each outcome is assessed. The trial we selected had these features. If the outcome of interest is not changed during the study, then it is not possible to assess responsiveness.
MATERIALS AND METHODS
The data used in this study were from a large completed clinical trial of tanezumab in participants with knee OA (NCT00733902). This trial was a 32-week 4-arm parallel-group phase III trial, comparing 3 doses of tanezumab (2.5 mg, 5 mg, or 10 mg) against placebo. Participants were observed at baseline and 2, 4, 8, 12, 16, 24, and 32 weeks; we used data from the 2-week visit to the 16-week visit, because data for rescue medication use were collected only at these visits. For simplicity, we pooled all tanezumab doses (2.5 mg, 5 mg, and 10 mg) into 1 treatment group and compared this to the placebo group. Further details regarding the trial’s design as well as data on unstandardized outcome scores have been published previously15. Our study is a reanalysis of completed clinical trial data, and is exempt from ethical review under the UK National Health Service Health Research Authority Guidelines.
Single outcomes definition
We used the following pain-related outcomes featured in NCT00733902: Western Ontario and McMaster Universities Osteoarthritis Index (WOMAC) pain, stiffness, and function subscales; and number of rescue medication pills taken per week.
Composite outcomes definition
Including information from at least 2 and up to 4 outcomes in each composite gives 11 possible combinations available from which composites could be generated. We generated a total of 3 composite outcomes that were considered the most meaningful and pragmatic of the 11 possible combinations. Composite 1 consisted of the WOMAC pain subscale plus rescue medication. Composite 2 consisted of all 3 WOMAC subscales (pain, stiffness, and function). Composite 3 consisted of all 3 WOMAC subscales, plus the rescue medication outcome. Composite outcomes were derived by including the selected combination of variables in the PCA, which assumed a 1-factor solution. We opted for PCA, given its propensity to maximize the amount of variance identified in the first (and in this case, only) derived component. We assumed that all included outcomes measured different aspects of 1 latent (multidimensional) pain variable, and forcing a 1-component solution therefore ensured that this variable was derived. Angst, et al found that unrestricted factor analysis of individual WOMAC items established new factors that drew from both the pain and function subscales and merged them16, supporting this idea. It also simplifies the analysis, because it creates only 1 composite outcome rather than allowing many composite factors to be generated in each PCA model. We constructed 3 PCA models, each generating 1 of 3 composite outcomes. Rotation of the factor solution (of any type: varimax, promax, or other) was not indicated in our approach, because a 1-factor solution has only 1 possible orientation.
We pooled data from all study visits in the analysis models (rather than using data from baseline only, for example), assuming that it was best to include the maximum available number of observations in the PCA models.
Analysis approach
All composite outcome measures were compared to the WOMAC pain, assuming this as the standard.
All of the single outcomes (WOMAC pain subscale score, WOMAC function subscale score, WOMAC stiffness subscale score, and number of rescue medication pills taken) were standardized prior to inclusion in the factor analysis models, and the composites (composites 1, 2, and 3 detailed above) were also standardized. Having all variables standardized (as Z scores) allows direct comparison of outcomes with different units.
We used a random-effects panel linear regression (using SAS’s PROC MIXED) to assess change in the standardized outcome score over time, with outcome type, study visit, and treatment group (either tanezumab or placebo) and all possible interactions as predictor variables. Constructing the data in long format, and using outcome type as a categorical dummy-coded variable, allow direct testing for differences in responsiveness between all outcomes in 1 statistical model (Appendix 1). SAS’s PROC MIXED command uses a likelihood-based approach, treating missing observations as missing at random.
We used linear combinations of coefficients from the regression model (using SAS PROC ESTIMATE) to produce the difference in standardized change between the WOMAC pain subscale and each composite outcome, at each study timepoint. This formally tests whether the outcomes differed from the WOMAC pain subscale regarding responsiveness at each of the 5 timepoints in the study.
Statistical analysis used SAS software version 9.3 (SAS Institute Inc.). A nominal alpha level of 0.05 was used for all CI.
RESULTS
Study sample demographics
At baseline, the placebo group (n = 172) comprised of 119 women (69.2%), with a mean age of 62.2 years, Kellgren-Lawrence grades 2, 3, and 4 of 39.5%, 47.7%, and 12.8%, respectively, mean WOMAC pain subscale score (0–10) of 7.1, and mean WOMAC function subscale score (0–10) of 6.6. The pooled tanezumab group (n = 518) at baseline had 301 women (58.1%), with a mean age of 61.4 years, Kellgren-Lawrence grades 2, 3, and 4 of 38.4%, 46.3%, and 14.5%, respectively, mean WOMAC pain subscale score (0–10) of 7.1, and mean WOMAC function subscale score (0–10) of 6.8.
Ten participants had missing observations for all outcomes at the timepoints of interest, giving a total sample size for this analysis of 680, compared with the original trial sample size of 690, with 509 in the pooled tanezumab group and 171 in the placebo group. Data for the 680 included patients could have been collected on 7 outcomes, at 5 timepoints, giving a total of 23,800 possible observations. Of these, 20,597 were actual observed data points, with 3203 observations missing (13.5%).
PCA results
The PCA process generated composites with component loadings shown in Table 1. WOMAC pain and stiffness subscales consistently had the greatest, and indeed equal, loading, closely followed by the WOMAC function subscale. When all 3 WOMAC subscale variables were included in the PCA model (in composite 3), the rescue medication’s loading dropped considerably.
Pain outcome combinations used to create composites, with component loadings.
Composite outcome performance
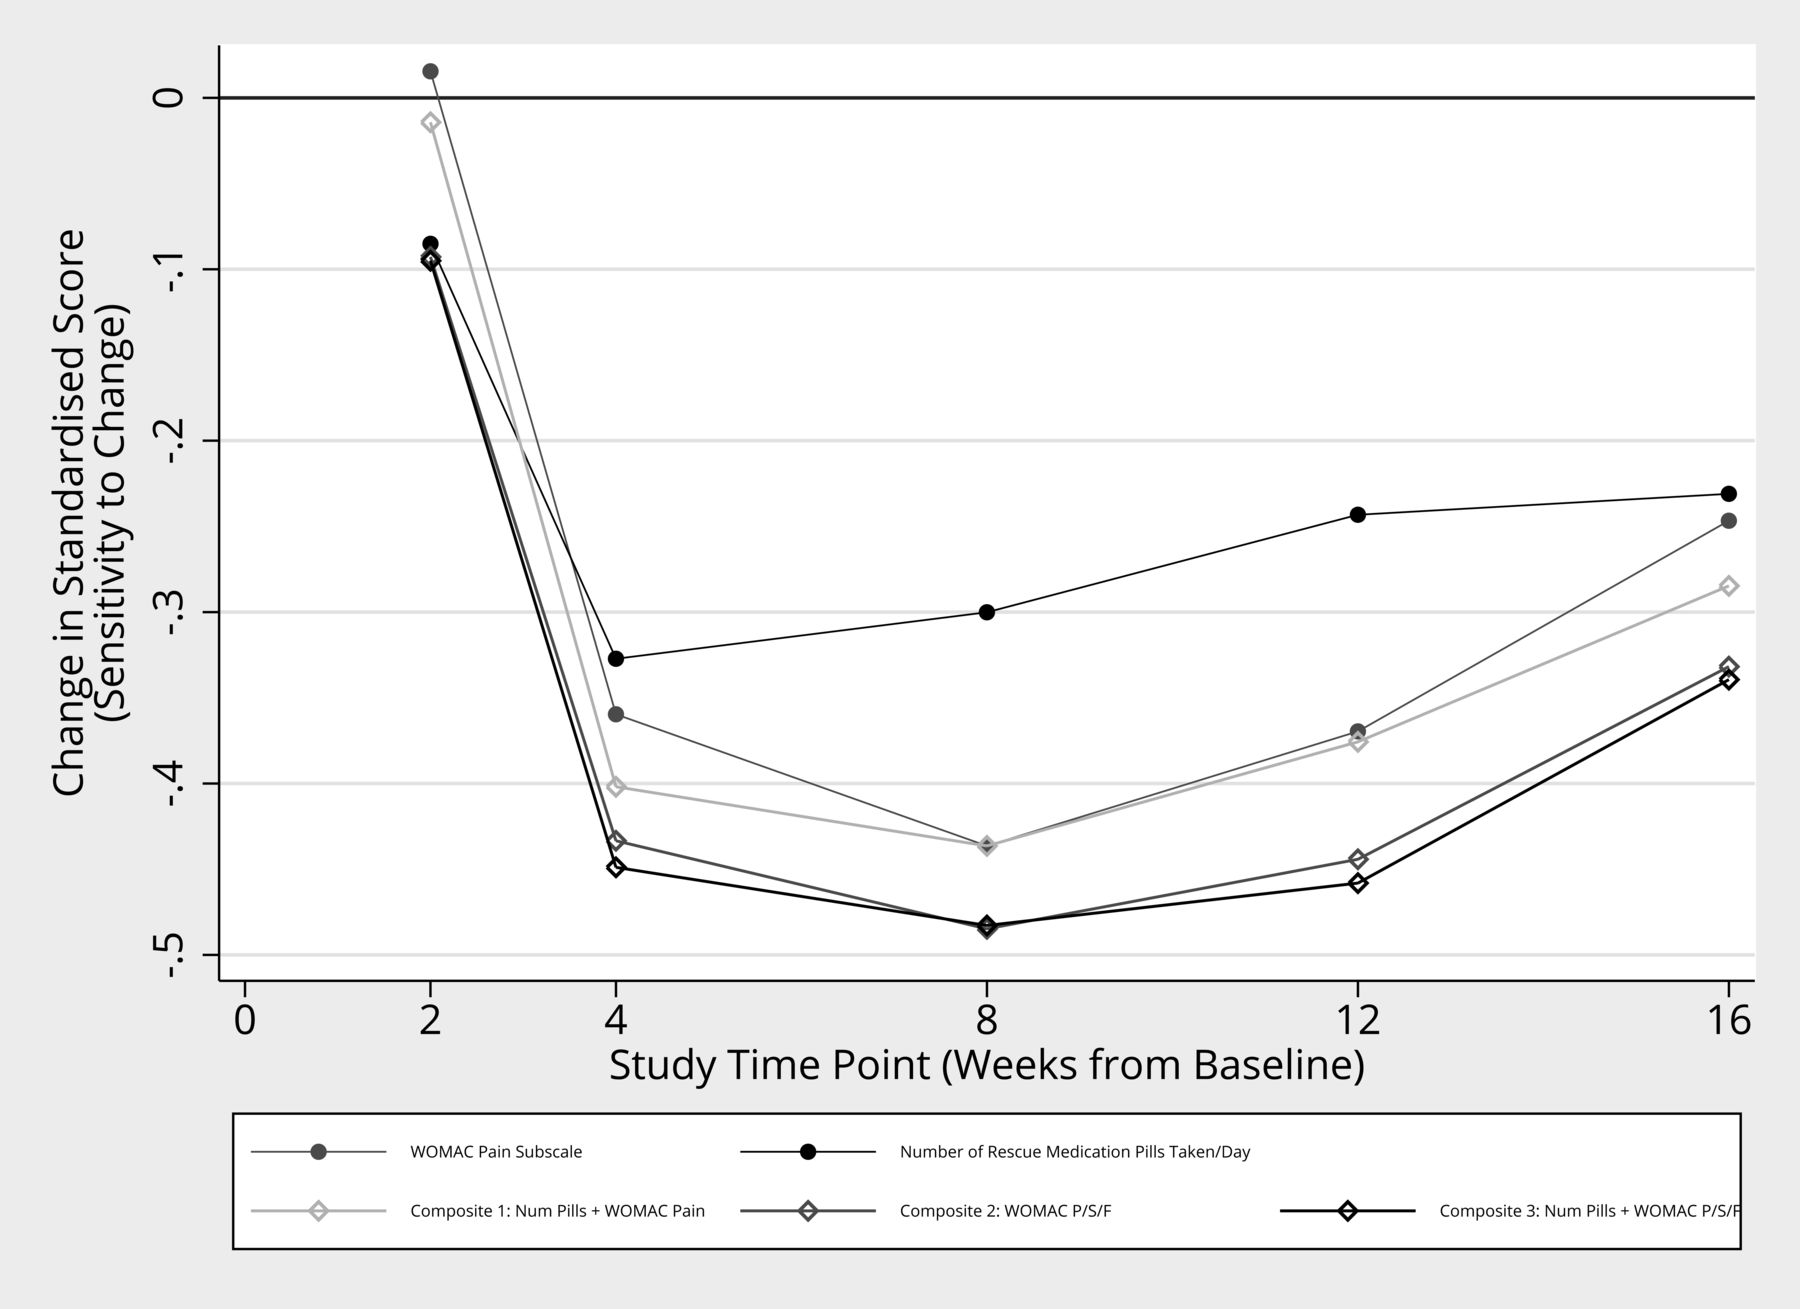
All composites showed responsiveness greater than at least some of their constituent outcomes on their own, and this difference was consistent across many timepoints (Figure 1). Composite 1 showed consistently greater responsiveness than the WOMAC pain subscale alone. The remaining 2 composites displayed responsiveness greater than all other constituent outcomes, except the WOMAC stiffness subscale. None of the single or composite outcomes showed consistently statistically significantly better responsiveness than that observed in the WOMAC pain subscale at the chosen alpha level (Table 2).
Sensitivity to change of single pain-related outcomes from the tanezumab trial. Values plotted are the control-treatment differences in standard score, at different study timepoints. More negative values indicate increased sensitivity to change. WOMAC: Western Ontario and McMaster Universities Osteoarthritis Index; P/S/F: WOMAC subscales pain, stiffness, and function.
The difference in standard score between the control group and the treatment group (responsiveness), in the variables of interest and WOMAC pain subscale, at different timepoints in the study. Values are mean (95% CI) and p value.
We next examined the effect of the observed differences in responsiveness on sample size requirements for a hypothetical new trial featuring the same design (Table 3). For example, the WOMAC pain subscale between-groups standardized change at 4 weeks was a difference of −0.37. A hypothetical new trial of identical design observing this between-group difference for the WOMAC pain outcome would require 236 participants (118 per group) to achieve 80% power with a 2-sided 5% type I error rate. In contrast, using composite 1 (i.e., including information on rescue medication as well as the WOMAC pain subscale score) as the primary outcome, which had an observed difference at 4 weeks of −0.41, the same trial would need 190 participants (95 per group) to achieve 80% power with this difference — a saving of 46 participants. When the observed differences between treatments are smaller, the reduction in sample size was more extreme: the WOMAC pain difference at 16 weeks (−0.26) would require 476 participants for 80% power in a hypothetical new trial, compared to only 364 participants when using composite 1 (using the observed difference of −0.29), a saving of 112 participants.
Observed responsiveness (standardized placebo/tanezumab difference) for featured pain outcomes at trial timepoints, and required sample sizes for a hypothetical new trial of the same design, using these observed effect sizes.
DISCUSSION
We found that composite outcomes generally had moderately greater responsiveness in a large OA trial than WOMAC pain — the usual standard outcome of these trials. That suggests that if 1 of these composite outcomes were used as the primary outcome in an OA trial, fewer subjects would be needed to demonstrate treatment efficacy.
The improvements in responsiveness did not meet the criteria for a statistically significant difference, but perhaps a more salient measure of their import was to determine what effect using these outcomes had on the sample size needed to be likely to show statistically significant effects of treatment versus placebo. We found that the reduction in sample size was substantial, ranging from roughly 20% to 40%. Thus, composites could substantially diminish the sample sizes needed in an OA trial whose main outcome is pain.
Eigenvalues from the 3 composite models all were much greater than the 1.0 cutoff typically used to select retained factors in a PCA model17, and a large proportion of the variance in the outcomes was identified by the first component in the PCA model, as anticipated (Table 1). The second factor listed in the model output (which was not extracted in this analysis) in all cases had an eigenvalue much less than 1, lending support to the idea that the selected correlated outcomes are well measured in 1 “pain” component.
Rescue medication use, while contributing to the “pain” component the least (Table 1), appeared to still improve responsiveness: composites including this outcome — composites 1 (WOMAC pain plus rescue medication use) and 3 (WOMAC pain, stiffness, and function, plus rescue medication) — showed slight improvements in responsiveness compared with composite 2, which excluded rescue medication.
Aside from the methods used to combine outcomes, the method chosen to assess responsiveness is also important18,19. Several methods are commonly cited to quantify responsiveness: the standardized response mean20, the effect size18 (either Glass’s Δ21 or Cohen d22, depending on the SD used), or Guyatt’s responsiveness index23. All of these methods have 2 important limitations. First, all methods calculate responsiveness over 2 timepoints, and cannot easily be generalized to a study that has 3 or more timepoints. This prevents assessment of how responsiveness may fluctuate over time, and limits the definition of responsiveness only to the magnitude of change relative to its variance, rather than the speed of response. Second, these methods do not directly assess statistical inference; differences in responsiveness coefficients are assessed descriptively only. Methods have been proposed (modified jackknife procedure5,24,25, bootstrapping26) to address this issue, but other methods that directly perform statistical inference as part of the method generating the coefficient are desirable.
Our approach made use of Z scores (standard scores)27. Converting each outcome’s absolute score to a Z score allows direct comparison of change in an outcome at different timepoints, thereby allowing direct assessment of change over time, and direct comparison between different outcomes. This methodology has been used previously to compare noncomposite outcomes28.
The PCA approach assumes that an intervention will alter several related aspects of a common construct, therefore combining all the multidimensional aspects of pain to form 1 outcome should increase responsiveness. However, if 1 aspect of pain is changed alone, then the inclusion of other aspects of pain that do not change may decrease the sensitivity of the composite. Our finding that the WOMAC stiffness subscale was the most sensitive outcome may fit this explanation: It may be, at least in this trial, that the WOMAC stiffness subscale was the closest correlate to the actual latent pain factor altered by the treatment, hence the greatest responsiveness, and inclusion of other subscales or rescue medication eroded it. Our finding may be limited to tanezumab alone, because the agent’s anti-nerve growth factor may have a greater effect on the stiffness sensation than other pain subscales15,29.
Freemantle, et al provide a comprehensive discussion on the use of composite outcomes in clinical trials30, highlighting how composite outcomes can obfuscate changes in constituent outcomes. This is particularly problematic when outcomes are unrelated (for example, a composite that combines cardiovascular events and mortality), although they note the statistical advantages (increased power and sensitivity) that arise through the construction of composites30,31. This discussion highlights how both the outcomes used in the composite, and the method by which they are combined, are important. Our present study combined the 3 WOMAC subscales (pain, stiffness, and function) into 1 composite outcome. We assumed that these 3 subscales were all aspects of the same construct (pain). The PCA (Table 1) produced extremely high factor loading in all 3 subscales, supporting this notion — at least in this trial. In contrast, if pain and function were discrete constructs, then the PCA should fail, with either pain or function alone loading on the latent factor. Both Angst, et al and Ryser, et al found close association between pain and function WOMAC subscales, partly supporting this finding16,32. In addition, an item overlap analysis on the WOMAC pain and function subscales by Stratford and Kennedy33 found significant item redundancy between the pain and function subscales, and a further factor analysis on the WOMAC items found clustering of items not by subscale, but by activity34, suggesting that the WOMAC subscales are not distinct.
We surmised that responsiveness in the outcomes may differ over time, as well as in magnitude. In our study, all outcomes appeared to have responded at the same timepoint, and retained their relative positions consistently over time (none of the outcome’s trajectories crossed over each other over time; Figure 1).
There are limitations to this analysis. We observed only very few statistically significant differences between outcomes. The trial was designed to observe a difference in the primary outcome between treatment groups (a relatively large difference), and was not designed to compare treatment differences between outcomes (much smaller differences). Therefore, even the large sample size in the trial provides relatively low power to detect differences between outcomes. Ideally, in the future this analysis would be designed into the trial prior to commencement, with appropriate sample size and power. We also allowed many interaction effects, which increased model-to-data fit at the expense of statistical power. We have assumed in this analysis that the covariate structure of the pain outcomes, and the relationship between the outcomes and the latent (unobserved) pain outcome are consistent between studies, and therefore generalizable across other studies. This is a relatively strong assumption, requiring validation in other datasets to allow wider generalization to other trials with confidence.
While the aim of this approach was to include additional information on pain from rescue medication data, this outcome may not be optimal. Rescue medication is a challenging variable to collect data on accurately, and therefore the likelihood is that measurement error of this variable is high. This may provide an explanation for why the improvement in sensitivity of composites including rescue medication is small.
Even though the between-outcome differences were not statistically significant, even a small improvement in responsiveness can affect sample size calculations (Table 2). This produces gains in efficiency without collecting any novel data simply by reanalyzing the data, using a method that produces a more sensitive, and therefore efficient, outcome. We could have included further assessment of other composites made from different combinations of the 11 possible from the 4 single outcomes used, for example one using WOMAC pain plus WOMAC stiffness. We opted to create the 3 composites that would have the most pragmatic effect on outcome inclusion/exclusion when designing a trial. The alternative, generating all 11 possible combinations and comparing them head to head, would further reduce the statistical power to discern differences between composite outcomes.
The PCA approach to generating a composite outcome by its nature produces a unitless score. While the generated score may have increased responsiveness compared to one of the constituent outcomes, it is more difficult to ascertain the clinical importance of the observed effect, in comparison to another outcome with meaningful units and an agreed minimally clinical importance difference (MCID). A downside of PCA composites is the absence of known values of MCID, but this could be established if a specific composite were widely used.
The choice of primary and secondary outcomes in this trial limited the choice of outcomes available to combine into a composite. Ideally, we would have preferred to use a trial featuring a wider range of pain outcomes, particularly the more recent Knee Injury and Osteoarthritis Outcome Score35 and Measure of Intermittent and Constant Osteoarthritis Pain36 questionnaires; however, a dataset using these outcomes, among others, and featuring the other requirements was not available.
Our present findings are similar to our previous paper, which used data from 2 other completed clinical trials of non-drug interventions28. In both of these trials, the WOMAC stiffness subscale also showed an increased but not statistically significant degree of responsiveness compared to the other 2 WOMAC subscales. Angst, et al, in contrast, found the WOMAC pain subscale to be the most sensitive outcome to change5,24, however these studies did not examine rescue medication, and used only a 2-timepoint approach. Further, the 2 studies previously analyzed were both prospective cohort studies lacking a control group. Thus, optimizing the detection of treatment effect over placebo was not possible in the 2 Angst, et al analyses.
We investigated whether collapsing several measures of a multidimensional construct into 1 composite outcome through the use of the PCA could help improve responsiveness following an intervention. Adding rescue medication alongside other elements of the WOMAC showed improved responsiveness, greater than the constituent outcomes.
Acknowledgment
We acknowledge the contributions of Pfizer in allowing our team access to the completed trial datasets, and their help and support in using their trial analysis platform; we specifically thank Pamela Singletary, Daireen Garcia, Glenn Pixton, and Michael Smith. We also acknowledge the contributions of the Research in Osteoarthritis Manchester (ROAM) team to this project. The ROAM group is supported by the Manchester Academic Health Sciences Centre. The authors acknowledge the assistance given by Séamus Byers, Contracts, IT Services, and the use of the Computational Shared Facility at The University of Manchester.
APPENDIX 1. Analysis model terms
The full model used was:
 where yitj = standardized score; Xitj1 = treatment group; Xitj2 = outcome type (the categorical data outlined above, which was coded in the form of dummy variables); Xitj3 = study visit (either 2, 4, 8, 12, or 16 weeks, coded as dummy variables) ; Xitj4 = treatment group × outcome interaction; Xitj5 = treatment group × study visit interaction; Xitj6 = outcome type × study visit interaction; Xitj7 = treatment group × outcome type × study visit interaction; μ = model intercept, ui = subject-level random effect, and Wit = error. This model included a total of 4 types of interaction effects (3 two-way interactions, and one 3-way interaction), which allows the greatest number of degrees of freedom regarding modeling the different outcomes over time, and therefore makes no prior assumptions about treatment trajectories, at the cost of power to detect differences.
Footnotes
MJP, MJC, ML, and DTF receive salary support from the UK National Institute for Health Research (NIHR), as part of the Manchester Musculoskeletal NIHR Biomedical Research Unit Grant. LT is an employee of Pfizer Inc. and owns stock or stock options in it. Arthritis Research UK also continues to support the Centre for Epidemiology (grant number 20380). This report includes independent research supported by (or funded by) the NIHR Biomedical Research Unit Funding Scheme. The views expressed in this publication are those of the author(s) and not necessarily those of the NHS, the NIHR, or the UK Department of Health. Prof. Felson is supported by NIH grant AR4778.
- Accepted for publication January 19, 2018.
REFERENCES
- 1.
- 2.
- 3.
- 4.
- 5.
- 6.
- 7.
- 8.
- 9.
- 10.
- 11.
- 12.
- 13.
- 14.
- 15.
- 16.
- 17.
- 18.
- 19.
- 20.
- 21.
- 22.
- 23.
- 24.
- 25.
- 26.
- 27.
- 28.
- 29.
- 30.
- 31.
- 32.
- 33.
- 34.
- 35.
- 36.