
Abstract
Objective. To explain the clinical effect of serum uric acid (SUA) levels as a risk factor for mortality, considering exclusion of kidney function.
Methods. Participants aged over 40 years who underwent health checkups were recruited. Individuals with estimated glomerular filtrations rates < 60 ml/min/1.73 m2 and who received laboratory study and colonoscopy on the same day were excluded.
Results. SUA levels were higher in men than in women (5.7 ± 1.2 mg/dl for men and 4.2 ± 0.9 mg/dl for women, p < 0.001). During 12.3 ± 3.6 years of followup, 1402 deaths occurred among 27,490 participants. About 6.9% of men and 3.1% of women died. The overall mortality rate had a U-shaped association with SUA levels, a U-shaped association in men, and no association in women. There was a significant interaction of sex for the SUA-mortality association (p for interaction = 0.049); therefore, survival analysis was conducted by sex. In men, the lower SUA group had a higher mortality rate after adjustment (SUA ≤ 4.0 mg/dl, adjusted HR 1.413, 95% CI 1.158–1.724, p = 0.001) compared with the reference group (SUA 4.1–6.0 mg/dl). A higher SUA contributed to an insignificant increased mortality in men (> 8.0 mg/dl, adjusted HR 1.140, 95% CI 0.794–1.636, p = 0.479). Women failed to show any significant association between SUA and mortality.
Conclusion. This study provided novel evidence that SUA-mortality association differed by sex. We demonstrated that a lower SUA was an independent risk factor for all-cause mortality in men with normal kidney function.
- URIC ACID
- MORTALITY
- SEX
Hyperuricemia is a risk factor for hypertension (HTN)1,2, diabetes mellitus (DM)2,3, kidney disease4,5,6,7, and all-cause mortality8,9,10. Serum uric acid (SUA) levels are mainly determined by a composite of purine metabolism rate and renal clearance because two-thirds of uric acid is eliminated by the kidneys11. Owing to inclusion of some populations with decreased renal function, previous studies could not determine whether higher SUA was a causal factor or confounder/mediator for mortality12. If we could rule out the kidney effect, the association between SUA and mortality would be explained more clearly.
Recently, a new U- or J-shaped relationship was suggested between SUA levels and cardiovascular (CV) mortality13,14 in patients with endstage renal disease15. In addition, hypouricemia is an emerging risk factor for exercise-induced acute kidney injury (AKI)16, new-onset chronic kidney disease (CKD)5, and renal function decline7 in the general population. Namely, both patients with minimal and normal kidney function who exhibited hypouricemia were associated with adverse outcomes. The reasons suggested for this phenomenon were as follows: first, uric acid is the most abundant antioxidant in humans17. Second, uric acid is a nutritional marker18; therefore, hypouricemia is regarded as a reflection of malnutrition status. Despite these hypotheses, studies regarding the effect of hypouricemia on mortality have been lacking until recently.
Meanwhile, SUA levels are higher in men than in women, and SUA levels tend to increase in women above age of 50 years19,20,21. The distribution of SUA levels according to sex and its increase in postmenopausal women have been attributed to the influence of sexual hormones22. These sex differences have led to the different effect of SUA on metabolic syndrome23, cancer, CV disease, and all-cause mortality24.
Accordingly, to explain the clinical effect of higher or lower SUA levels as a risk factor for mortality, considering the exclusion of the association between SUA and kidney function, we analyzed the association between SUA levels and mortality in the general population with normal kidney function considering the difference in SUA levels according to sex.
MATERIALS AND METHODS
Study population
This study population recruited adults undergoing voluntary routine health checkups at Seoul National University Hospital between 1995 and 2006. The total number of participants was 42,887, and individuals were excluded if they were less than 40 years of age or had missing baseline variables. We excluded individuals with CKD whose estimated glomerular filtration rate (eGFR) was < 60 ml/min/1.73 m2 as calculated by the CKD-Epidemiology Collaboration equation and individuals who underwent blood tests and colonoscopy on the same day because of possible electrolyte imbalance due to bowel preparation. If individuals had multiple visits, we used only the first visit data. Finally, we analyzed a total of 27,490 participants (Figure 1).

Flow diagram of subject classification. eGFR: estimated glomerular filtration rate; CFS: colonofiberscopy.
Ethics
The study protocol was in accordance with the principles of the Declaration of Helsinki and was approved by the Institutional Review Board at Seoul National University Hospital (H-1604-041-753).
Variable measurements
Blood samples were obtained from all participants after a 12-h overnight fast. We collected data on demographics, comorbidities, smoking, average alcohol intake, and exercise through a self-reported questionnaire. We calculated the body mass index (BMI) by measuring height and body weight [weight (kg)/height (m2)]. Also measured were SUA, blood urea nitrogen (BUN), serum creatinine, serum albumin, hemoglobin (Hb), aspartate aminotransferase (AST), alanine aminotransferase (ALT), bilirubin, γ-glutamyl transpeptidase (GGT), fasting serum glucose, glycosylated Hb (HbA1c), and lipid profiles including total cholesterol, higher high-density lipoprotein (HDL) cholesterol, low-density lipoprotein (LDL) cholesterol, and triglycerides (TG).
HTN was defined as a diagnosis of HTN or a medication history of antihypertensive drugs, and DM was defined as a diagnosis of DM or a medication history of insulin or oral hypoglycemic agents. Binge drinking was defined as 5 or more drinks (≥ 50 g of alcohol) per episode for men and as 4 or more drinks per episode (≥ 40 g of alcohol) for women25. Smoking status was categorized as current smoker, ex-smoker, or never smoker. We defined individuals who smoked at least 1 cigarette per day at the time of the health screening as current smokers. Participants who did not smoke at the time of screening but had previously smoked were classified as ex-smokers. Exercise was defined as exercising > 30 min at least 3 times per week. We determined whether uric acid-lowering agents, antiuricosuric agents, or uricosuric agents had been prescribed within 1 year before or after the health checkups for each patient by searching electronic medical records. Uric acid-lowering agents included allopurinol, benzbromarone, and febuxostat. Uricosuric agents included losartan, calcium channel blockers, and sevelamer. Antiuricosuric agents included angiotensin receptor-converting enzyme inhibitors and angiotensin receptor blockers except losartan and aspirin.
Outcome measurement
The primary outcome was all-cause mortality. We obtained mortality and cause of death data from Statistics Korea using a unique identifier. Mortality data were obtained until December 2013. The underlying cause of death was investigated according to the International Classification of Diseases, 10th ed (Supplementary Table 1, available with the online version of this article).
Statistical analysis
When we analyzed crude mortality and the nonlinearity curve of mortality, an SUA level of about 4.1–6.0 mg/dl was the reference group of all-cause mortality. Patients were stratified into 4 groups according to SUA level (SUA ≤ 4.0 mg/dl, 4.1–6.0 mg/dl, 6.1–8.0 mg/dl, and > 8.0 mg/dl). In addition, we analyzed all results separately by sex because SUA levels were distributed differently according to sex.
Continuous variables are presented as mean ± SD. Categorical variables of DM, HTN, smoking history, and exercise are presented by proportion and frequency. We used 1-way ANOVA for comparisons of continuous variables and the chi-square test for categorical variables among the SUA groups. Cox proportional hazard regression models were carried out to reveal the relationship between SUA level and all-cause mortality. Covariables included age, BMI, DM, HTN, serum creatinine, serum albumin, Hb, high-sensitivity C-reactive protein (hsCRP), fasting serum glucose, mean arterial pressure, LDL cholesterol, HDL cholesterol, TG, smoking, alcohol consumption, and exercise. Total cholesterol levels were removed from the analysis because of multicollinearity. Participants who did not answer the question regarding alcohol consumption were removed in multivariate Cox analysis. A statistically significant difference was defined as a p value of < 0.05. Statistical analyses were carried out using the SPSS, version 22.0 (IBM) and Stata, version 12.0 (StataCorp LP).
RESULTS
Baseline characteristics of overall study participants
The followup period was 12.3 ± 3.6 years. The baseline characteristics of the participants are shown in Table 1. The participants’ mean age was 56.4 ± 9.4 years, and 14,468 (52.6%) were men. The mean SUA level was 5.0 ± 1.3 mg/dl. Individuals with DM and HTN consisted of 9.4% and 38.1% of the study population, respectively. The number of participants diagnosed with gout was 138 (0.5%), and 96.4% of them were men. We collected the prescription history of 8514 patients (70.5%), and uric acid-lowering agents were prescribed to 5.1% of them.
Baseline characteristics according to sex. Conversion for units: cholesterol in mg/dl to mmol/l, × 0.02586; glucose in mg/dl to mmol/l, × 0.05551; triglycerides in mg/dl to mmol/l, × 0.01129. Values for continuous variables are presented as mean ± SD.
Individuals with higher SUA levels tended to have higher serum creatinine levels and lower eGFR. As the SUA level increased, so did BMI, systolic and diastolic blood pressures (BP), Hb, and serum glucose. Although participants with lower SUA levels tended to be younger, have healthier lipid profiles (lower serum total cholesterol, TG, and LDL cholesterol and higher HDL cholesterol levels), and were more likely to be underweight, they had a higher incidence of diabetes. The number of participants who were diagnosed with HTN increased as the SUA level increased. The proportion of current smokers was higher in participants with higher SUA levels than in those with lower SUA levels (Supplementary Table 2, available with the online version of this article).
Sex-specific distribution of SUA
SUA levels were higher in men than in women. The overall distribution of SUA levels was shifted to the right in women compared with that in men (Figure 2A). The mean SUA level was higher in men than in women. As age increased, SUA levels in men tended to decline (p for trend < 0.001), but increased in women (p for trend < 0.001; Supplementary Figure 1, available with the online version of this article). Therefore, we compared baseline characteristics according to SUA group by sex.

Distribution of serum uric acid and mortality according to sex. (A) Serum uric acid levels. (B) Serum uric acid levels and mortality.
Comparison of baseline characteristics according to SUA levels by sex
We compared baseline characteristics according to sex in men (Supplementary Table 3, available with the online version of this article) and women (Supplementary Table 4). Most laboratory findings were higher in men than in women, including levels of BUN, serum creatinine, AST, ALT, bilirubin, GGT, glucose, HbA1c, and TG.
In men, individuals in the higher SUA groups tended to be younger and more obese than in the lower SUA groups. In addition, men with higher SUA levels had lower eGFR and HDL cholesterol levels than those with lower SUA levels. Higher SUA levels corresponded with higher fasting glucose, HbA1c, total cholesterol, TG, and hsCRP levels. Although combined HTN was less, DM was more prevalent in men with lower SUA levels than in those with higher SUA levels. Gout prevalence was higher as SUA levels increased.
In women, the overall distribution of demographic and clinical characteristics according to SUA groups was similar to men. However, women with higher SUA levels were older and had much higher fasting glucose, HbA1c, and LDL cholesterol levels. DM was far more prevalent in the women with the highest SUA levels.
SUA and all-cause mortality according to sex
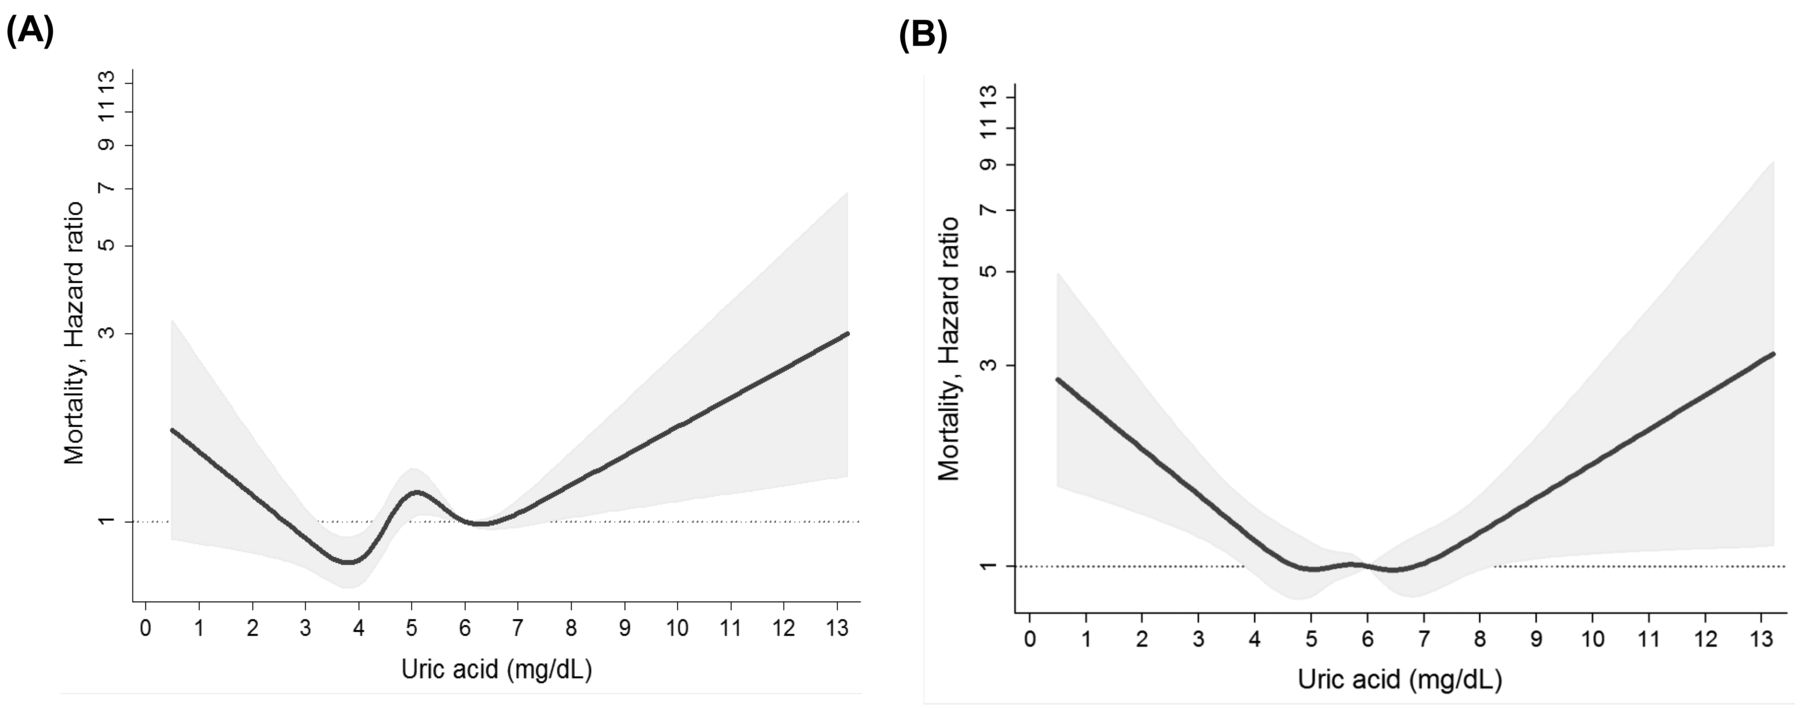
During the observation period, a total of 1402 deaths occurred. The crude mortality rate had a U-shaped association with SUA levels overall. Interestingly, it was different according to sex. Men showed a U-shaped association, whereas women displayed no association with mortality rate. Non-linear spline curves between SUA levels and HR for mortality showed a similar pattern (Figure 2B and Figure 3A). SUA levels < 4 mg/dl and > 8 mg/dl were associated with increased mortality risk. However, SUA levels between 4 mg/dl and 8 mg/dl showed a fluctuating mortality risk (Figure 3A). To elucidate this complexity, we examined the contribution of sex to the SUA-mortality association and found a significant interaction of sex for the SUA-mortality association (p for interaction = 0.049). Therefore, we separated by sex and carried out survival analysis.

Nonlinear association between uric acid and mortality. (A) In all participants. (B). In men after covariate adjustment.
Table 2 summarizes the results of univariate and multivariate Cox regression analysis overall, and in men and women. In univariate analysis overall, the highest SUA group was at greater risk for all-cause mortality. The lowest SUA group appeared to be protected in the univariate analysis (p = 0.012). When we conducted multivariate analysis and considered significant interaction for sex and the SUA groups, the lowest SUA group and the highest SUA group tended to have an increased mortality risk, but failed to predict mortality significantly after adjustment in the overall analysis.
Univariate and multivariate Cox analysis regarding all-cause mortality.
In men, lower SUA levels were associated with a more than 2-fold elevated mortality risk in a dose-responsive manner in the univariate analysis (SUA ≤ 4.0 mg/dl, HR 2.154, 95% CI 1.795–2.584, p < 0.001; SUA 6.1–8.0 mg/dl, HR 0.813, 95% CI 0.703–0.940, p = 0.005; SUA 4.1–6.0 mg/dl, reference). After adjusting for age, BMI, DM, HTN, serum creatinine, serum albumin, Hb, bilirubin, hsCRP, systolic BP, smoking, alcohol consumption, and exercise history, the lowest SUA group (SUA ≤ 4.0 mg/dl) remained as an independent risk factor for all-cause mortality (adjusted HR 1.348, 95% CI 1.102–1.649, p = 0.004). The data of prescribed medication were collected in only 70.5% of all participants, but we conducted extra analysis to exclude the influence of diuretics on SUA levels. After the addition of diuretics as a covariate in multivariate analysis, SUA was still shown to be an independent risk factor for all-cause mortality in men (adjusted HR 1.414, 95% CI 1.159–1.725, p = 0.001, data not shown). Men showed a definite U-shaped association between SUA and mortality risk, and this association remained even after covariate adjustment (Figure 3B). However, unlike men, SUA was not associated with mortality in women (Supplementary Figure 2, available with the online version of this article).
There was no statistical difference in the distribution of death causes overall, and in men and women (Supplementary Table 5, available with the online version of this article). The most common cause of death was malignancy (49.4%) in both sexes. Overall, CV mortality was higher in both the lowest (19.0%) and the highest (18.4%) SUA groups compared with that in the 2 middle SUA groups. To investigate the association between SUA levels and causes of death, we performed further multivariate analysis for CV and malignancy mortality only in men. The HR in the lowest SUA group were highest for both CV and malignancy mortality (Supplementary Table 6, available with the online version of this article). The association between a low SUA and high mortality remained when we analyzed separately according to cause of death in univariate analysis, not in multivariate analysis.
DISCUSSION
We investigated the relationship between SUA levels and all-cause mortality in adults over 40 years of age with normal kidney function. Similar to existing reports, SUA levels were higher in men than in women. We additionally found a significant interaction of sex in the association between SUA and mortality. A U-shaped association between all-cause mortality and SUA levels was suggested in men. The lowest SUA group (≤ 4.0 mg/dl) had a 35% elevation in all-cause mortality after covariate adjustment only in men. Our study also suggested the common notion that hyperuricemia might increase all-cause mortality; however, it failed to reach statistical significance.
The sex difference in SUA levels has been reported in previous studies18,19,20. It was reported that premenopausal women tend to have lower SUA levels than men, probably because of the uricosuric effect of estrogens26. Our data also showed that SUA levels tend to increase in postmenopausal women, although the absolute values of SUA remained below those of men (Supplementary Figure 1, available with the online version of this article). Owing to this phenomenon, many studies have analyzed the association between SUA levels and CV events or CV mortality with consideration of the sex difference of SUA levels. Some studies mentioned that SUA levels are independent risk factors for CV mortality regardless of sex27,28, and others confirmed a definite difference between men and women29,30, so there is disagreement about the association between CV mortality and SUA according to sex. Additionally, there has been no definite conclusion about the sex difference in all-cause mortality. In our study, we found a significant interaction of sex on the association between SUA levels and mortality, and subsequently identified a U-shaped association only in men.
A cohort study of the general population demonstrated that hyperuricemia elevated all-cause mortality to 16% and CV mortality to 39%31. Niskanen, et al reported that SUA levels are a strong predictor of CV mortality in middle-aged men, but no mention was made about the exclusion of patients with CKD32. Many other studies have shown that hyperuricemia is an important factor for CV events in the general population27,29,33 and in patients with decreased kidney function34,35. Kidney function may distort the clinical outcomes as one of the confounders, but no study, to our knowledge, has included only individuals with normal kidney function. Therefore, previous studies have had difficulty explaining the causal relationship between SUA and outcomes. Because we included only participants with normal kidney function (eGFR ≥ 60 ml/min/1.73 m2), it was easier to assume that SUA levels were an independent and causal factor for all-cause mortality.
In terms of the pathophysiologic mechanism of the morbid effect of hypouricemia, uric acid is considered an antioxidant because it increases production of reactive oxygen species36 and prevents acute activation of proinflammatory cells37. It has been thought that uric acid contributes to more than half of the antioxidant capacity of blood36,38. The link between various diseases and lower SUA levels has been demonstrated. SUA provides a primary defense against human cancer by its involvement as a scavenger of oxygen radicals. Therefore, higher SUA levels decrease cancer mortality in men39 and increase colon cancer survival40. One of the most interesting protective roles of uric acid has been analyzed in diabetes41. Infusion of uric acid corrects endothelial dysfunction in patients with Type 1 diabetes42. Accordingly, we hypothesized that hypouricemia may contribute to the elevation of all-cause mortality because of the antioxidant deficits. In addition, SUA was considered as a good nutritional marker in hemodialysis patients, so hypouricemia could be a marker for malnutrition18.
Hypouricemia is described as a risk factor for exercise-induced AKI43. An important pathogenic mechanism of exercise-induced AKI is reduction of circulating SUA, impairing the ability of the kidneys to cope with the increased oxidative stress associated with strenuous exercise44. Moreover, hypouricemia in individuals with normal renal function is an emerging risk factor for eGFR decline7 and incident CKD5. In the study by Hsu, et al15, both the lowest and the highest SUA groups were predictive factors for all-cause mortality in hemodialysis patients. Our study also demonstrated that lower time-averaged SUA levels elevated mortality as much as 72% in chronic dialysis patients45. These findings suggest that hypouricemia may have a harmful effect on kidney function in patients with preserved renal function and on mortality in patients with poor renal function.
Because it is well known that hyperuricemia is a major independent risk factor for gout, CV disease, and mortality, many physicians have tried to decrease SUA levels. Recently, new uric acid-lowering agents such as febuxostat and lesinurad were developed and clinically used for patients with gout or CKD and hyperuricemia. Most physicians have not considered hypouricemia as another risk factor for morbidity and mortality; thus, there is no consensus for lowering SUA levels thus far. Our study proposed a new clinical effect of hypouricemia and suggested that lowering SUA unconditionally is not proper management for hyperuricemia. Further studies regarding the determination of appropriate SUA levels should be undertaken.
Our novel finding of a hypouricemia-mortality association was not demonstrated in women. As shown in Supplementary Figure 2 (available with the online version of this article), women did not show an increased mortality rate even with SUA levels < 2.0 mg/dl. To find a proper explanation through estrogen for this phenomenon, we divided the women into 2 groups: those above and those below the age of 60 years. However, only 1 patient died in the SUA > 8.0 mg/dl group; therefore, we could not conduct further evaluation. Further longterm followup is warranted to confirm the absence of SUA-mortality association in women.
There are several important limitations. First, we depended on a single SUA measurement. Additionally, SUA levels are influenced by many factors such as dietary intake and medications, but we could not check all these factors. In particular, many studies mentioned a U-shaped relationship between alcohol consumption and all-cause mortality mainly in middle-aged men46,47,48. SUA levels increased with increasing alcohol intake, and beer caused a larger increase than liquor49. We tried to collect concrete data about alcohol intake, but some of the participants did not answer this question, and some of the values were missing during data processing, so we had no choice but to gather imperfect data. Moreover, we could not prove the harmful effect of hyperuricemia on mortality, as in previous studies. This might be due to the very small number of participants in the hyperuricemia group for verification of its effect on all-cause mortality. In addition, our study enrolled only individuals of Asian ethnicity; further studies including other ethnicities should be conducted to generalize these findings. We obtained prescription information on uric acid-lowering, antiuricosuric, and uricosuric agents from only 70.5% of participants. Moreover, diuretics might be an important confounding factor. We could not collect prescription data on all participants, and thus medications could not be included in the multivariate analysis. Likewise, we gathered only a limited history of gout because it was collected from electronic medical records.
We identified a novel interaction of sex in the SUA-mortality association. Additionally, we confirmed that lower SUA levels were an independent risk factor for all-cause mortality in men with normal kidney function, but not in women. Further studies are needed to confirm the contributing mechanisms of the sex-specific association between SUA levels and mortality in the general population.
ONLINE SUPPLEMENT
Supplementary material accompanies the online version of this article.
- Accepted for publication November 29, 2016.
REFERENCES
- 1.
- 2.
- 3.
- 4.
- 5.
- 6.
- 7.
- 8.
- 9.
- 10.
- 11.
- 12.
- 13.
- 14.
- 15.
- 16.
- 17.
- 18.
- 19.
- 20.
- 21.
- 22.
- 23.
- 24.
- 25.
- 26.
- 27.
- 28.
- 29.
- 30.
- 31.
- 32.
- 33.
- 34.
- 35.
- 36.
- 37.
- 38.
- 39.
- 40.
- 41.
- 42.
- 43.
- 44.
- 45.
- 46.
- 47.
- 48.
- 49.