
Abstract
Objective. To develop a screening tool for the identification of sacroiliitis on abdominal computed tomography (CT) scan.
Methods. Variables including erosions (number and size), sclerosis (depths of > 0.3 cm or > 0.5 cm), and ankylosis were identified through a training exercise involving 12 CT scans containing the sacroiliac joints. Two blinded readers read 24 CT scans from a derivation cohort to propose a screening tool for identifying discriminating features of sacroiliitis. A test cohort of 68 patients was used to confirm the utility of this tool. Inter- and intraobserver values, sensitivity, specificity, and positive/negative likelihood ratios were calculated for individual as well as combinations of variables. Erosions were evaluated using receiver-operating characteristic curves.
Results. Analysis of the derivation cohort determined that counting the number of erosions on the worst coronal slice in each of 4 articular surfaces was not inferior to analyzing each individual slice in either transverse or coronal view. In the test cohort, interreader reliability for ankylosis and iliac and sacral erosions was very good (κ = 1, ICC = 0.989 and 0.995, respectively) whereas for sclerosis, it was moderate (κ = 0.39–0.96). A total erosion score of ≥ 3 was found to have the highest sensitivity and specificity for sacroiliitis (91% for each). The addition of a > 0.5 cm of iliac sclerosis or a > 0.3 cm of sacral sclerosis marginally increased the sensitivity (94%) but decreased specificity (85%).
Conclusion. The presence of ankylosis or a total erosion score of ≥ 3 on CT is sufficient for identifying patients at high risk of sacroiliitis and may prompt more timely referrals to a rheumatologist.
- RADIOGRAPHIC COMPUTED TOMOGRAPHY
- ANKYLOSING SPONDYLITIS
- SPONDYLOARTHRITIS
Imaging of the sacroiliac (SI) joints is fundamental to the diagnosis of ankylosing spondylitis (AS)1,2,3,4,5,6. Traditionally, this is done with a pelvic radiograph; however, the complex anatomy of the SI joint often leads to subjective differences with poor interobserver reproducibility7. Computed tomography (CT) scans have been reported to be superior to radiographs for the diagnosis of sacroiliitis8,9,10 and purported to be the best technique for evaluating structural abnormalities11,12,13, but radiation exposure has limited its widespread use. Nonetheless, many patients at high risk of developing AS such as those with inflammatory bowel disease (IBD) will commonly have CT scans performed for other clinical indications. These abdominal CT scans afford a unique opportunity to examine the SI joints in such patients.
Previous studies of SI-joint CT scans have highlighted the increased sensitivity of this imaging modality and noted the high prevalence of osseous changes that can be found in asymptomatic individuals14,15. Additionally, reports looking at the prevalence of sacroiliitis with CT scanning were based on adaptations of the modified New York grading system16. A study by Geijer, et al has suggested that such an adaptation is not appropriate4,17. To date, there has not been a validated scoring system for defining sacroiliitis using CT.
The aim of our study was to develop a screening tool for classifying sacroiliitis on CT that can be used by both rheumatologists and radiologists. Such a tool could be the first step to ground future studies on the development of a standardized protocol for CT scan of the SI joints.
MATERIALS AND METHODS
Patients and controls
Patients were identified through the Toronto AS clinic, which consists of a longitudinal observational cohort of patients with both radiographic and nonradiographic axial spondyloarthritis (nr-axSpA). Of the 1041 patients in the cohort, we identified 46 who had a definite diagnosis of AS according to the modified New York criteria4 and who had had an abdominal CT scan that included the SI joints. SI joints were given a grade of 1 when suspicious changes were present. A grade of 2 was given when minimal abnormalities were present such as erosions or sclerosis without alteration of joint width. A grade of 3 was given if there was an unequivocal abnormality with 1 or more of the following: erosions, sclerosis, widening, narrowing, or partial ankylosis. A grade of 4 was given if total ankylosis was present. All 1041 patients within our cohort were classified as having either AS or not according to the modified New York grade based on a blinded central read of their anteroposterior pelvis radiographs by 2 rheumatologists with at least 1 year of SpA subspecialty training. These same rheumatologists read all CT scans blinded to diagnosis and clinical information. Discordant scores were settled by consensus between the 2 readers and persistent discordance was settled by a radiologist.
Included patients with AS were matched 1:1 by age and sex to controls who had received an abdominal CT scan for other clinical indications in the urology and gastroenterology clinics. Charts were reviewed to ensure that control patients did not have a history of back pain, spondylitis, colitis, uveitis, or psoriasis. Additionally, the indication for the CT scan was recorded. Because of the retrospective design of our study, none of the control patients had pelvic radiographs for comparison.
CT features and definitions
A Medline search was conducted using the terms “tomograp hy, X-ray computed,” “sacroiliac joint,” “spondyloarthritis,” “sacroiliitis,” and “spondylitis, ankylosing”. A total of 9 articles were found to be pertinent to our topic8,12,14,15,16,17,18,19,20,21. Based on this review, proposed variables included ankylosis (length), sclerosis (length and depth), and erosions (presence, number, symmetry, and size).
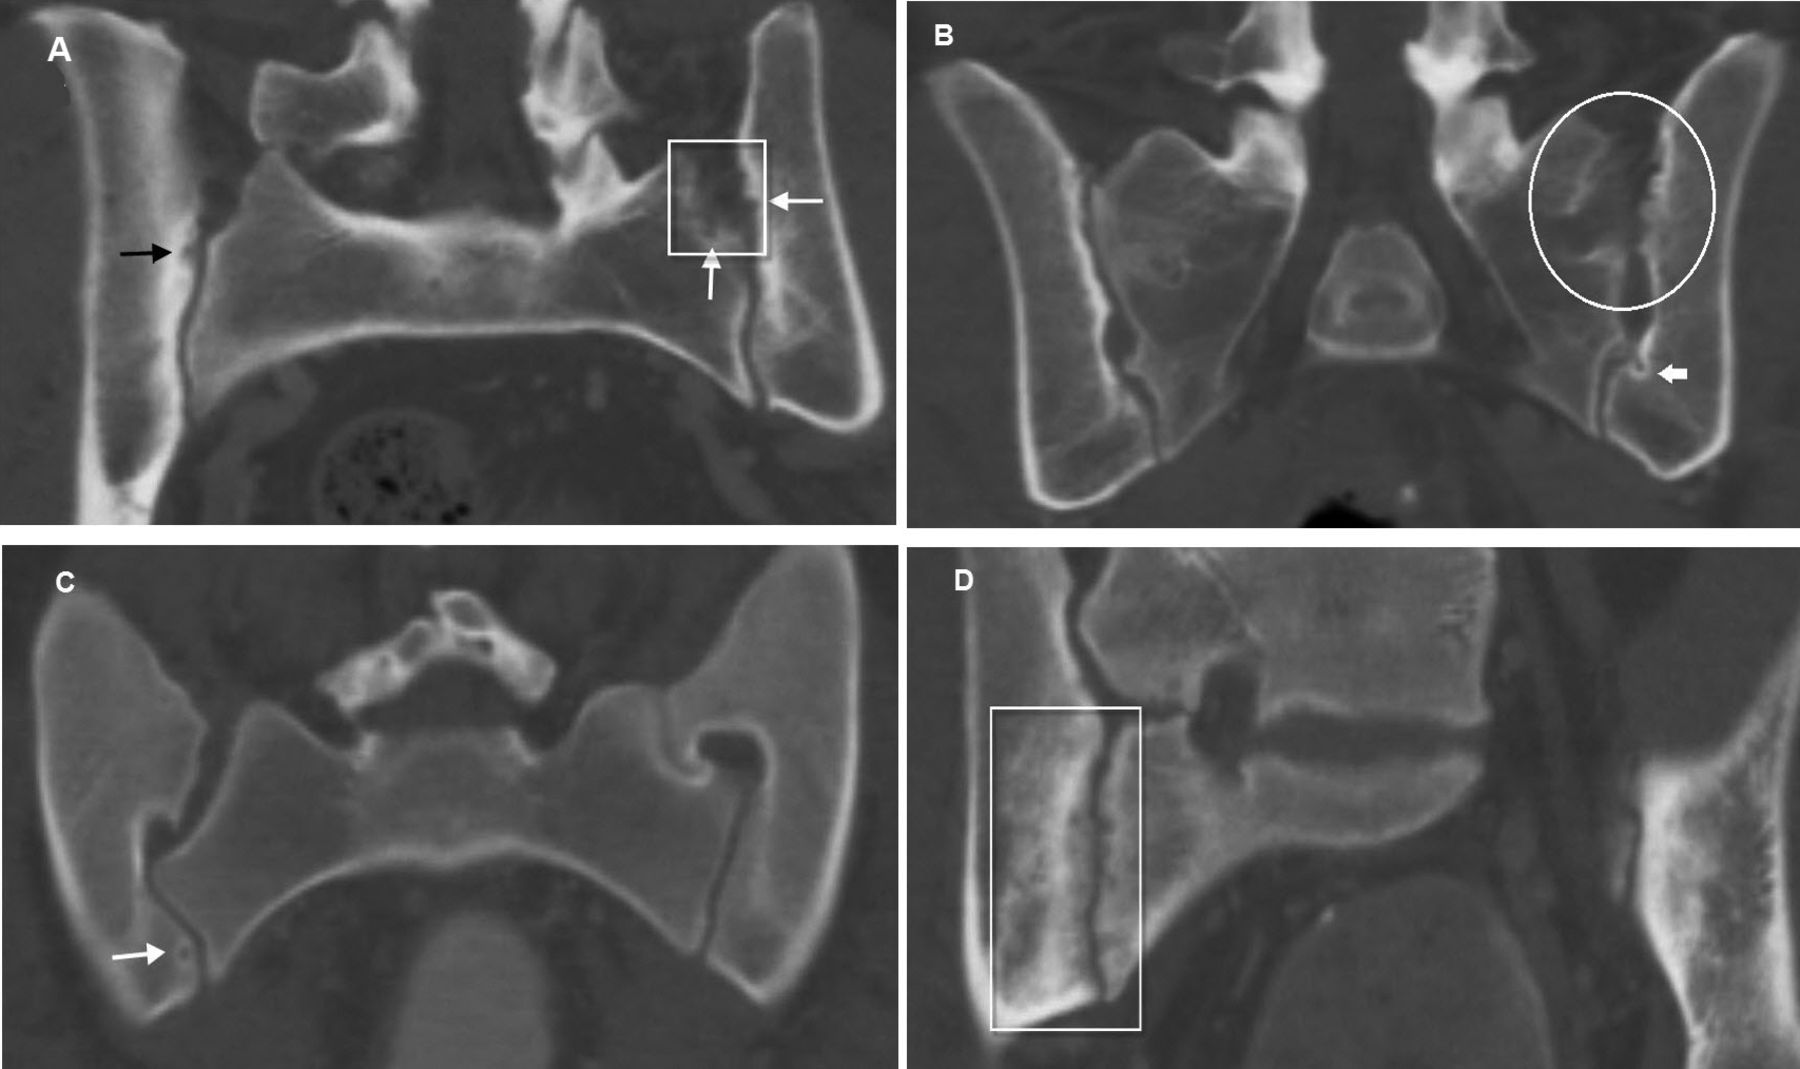
Erosions and sclerosis were recorded only if present along the cartilaginous compartment. Lesions along the fibrous compartment were not counted (Figure 1A and 1B). Erosions had to have a clear break in subchondral bone with a minimum depth of 0.2 cm. Osseous abnormalities located at the transition point from cartilaginous to fibrous compartment (Figure 1B) were not scored as erosions. Subchondral cysts, defined as radiolucent lesions without a clear break in the subchondral bone, and lesions where a break was ambiguous were not included (Figure 1C).

Coronal view computed tomography scans. A. A 53-year-old woman with a history of uterine malignancy and no history of back pain. Black arrow: erosion noted at the superior aspect of the right iliac bone. White box: fibrous portion of the SI joint. White arrows: irregular compact bone in the fibrous portion can be mistaken for erosions. These may represent entheseal changes and were not scored as erosions. B. A 45-year-old man with a history of recurrent kidney stones and no history of back pain. White circle: osseous changes noted in the fibrous portion of the left SI joint. White arrow: osseous change as cartilage transitions into the fibrous compartment. These were not scored as erosions. C. A 20-year-old woman with a history of abdominal pain, but no history of back pain. White arrow: cystic change on the right SI joint was not counted as an erosion because there was no clear subchondral break. D. A 37-year-old man with ankylosing spondylitis. White box: there is high interreader variability in determining the depth of patchy sclerosis. Homogeneous sclerosis had a depth of > 0.5 cm and therefore was scored as positive. Numerous erosions are noted on the right sacral side of the SI joint with suspicious lesions noted on the iliac side. SI: sacroiliac.
While analysis of each slice would give the most detailed information, such a method would not be feasible for clinicians in routine clinical practice. Hence, we assessed whether counting only the worst slice from each articular surface would adequately differentiate patients with AS from controls. Each of the 4 articular surfaces (right iliac, right sacral, left sacral, and left iliac) was independently assessed for the slice with the maximum number of erosions. By adding the number of erosions in all 4 surfaces, a total erosion score was calculated.
As a sensitivity analysis, we collected data on the total number of erosions seen in every slice in both transverse and coronal views. Additionally, we counted the number of large erosions, defined as erosions seen on more than 1 slice.
Sclerosis was only read from the coronal view and defined as an increase in bone density of at least 1 cm in length parallel to the joint line when compared to the midline of the sacrum and scored as present/absent. The depth of sclerosis was evaluated on the slice with the longest visible cartilage length and noted as extending either > 0.3 cm or > 0.5 cm perpendicular to the joint line. Sclerotic segments were only measured in areas of homogeneous density because patchy density was poorly reproducible (Figure 1D). The initial 0.5 cm at the cranial and caudal ends of the joint where there can be a normal increase in density were not scored (Figure 2A).

Coronal view computed tomography scans. A. A 46-year-old man with recurrent kidney stones. White arrows: sclerosis is noted, measuring 0.3 cm on the iliac side of both SI joints. Given the presence of osteophytes at the caudal portion of the SI joints, this patient likely had osteoarthritis. B. A 40-year-old man with ankylosing spondylitis. Black arrow: criteria for erosion and sclerosis were not met. White arrow: contiguous marrow > 1 cm in length was scored as ankylosis. SI: sacroiliac.
Ankylosis was defined as contiguous bone marrow between the ilium and sacrum > 1 cm in length within the cartilage compartment of the joint. If a joint was scored as having ankylosis, neither erosion number nor presence of sclerosis was noted because these changes would be obscured by the ankylosis (Figure 2B).
Pilot cohort
A schematic representation of the cohorts is depicted in Supplementary Figure 1 (available online at jrheum.org). The pilot cohort consisted of 6 randomly selected patients with AS and 6 controls. The reliability and feasibility of measuring the selected variables, using the definitions above, was discussed by all authors and tested in this cohort. CT scans from this cohort were read in conjunction with the radiologist.
Derivation cohort
Having established the feasibility of scoring CT scans for the selected variables and refining the definitions in the pilot cohort, a derivation cohort of 24 patients (12 AS and 12 controls) was used to develop the CT scoring criteria. Combinations of erosions, sclerosis, and ankylosis were analyzed for optimal sensitivity and specificity. Based on this initial exercise, a screening tool for sacroiliitis was established.
Test cohort
A test cohort was formed from the remaining 34 modified New York criteria-positive patients with AS and the 34 corresponding controls. The new CT scoring criteria was validated in this cohort. Approval from the local ethical committee was obtained and the study was conducted in accordance with the Declaration of Helsinki.
CT scanning technique
CT scans and radiographs were read using a DICOM (Digital Imaging and Communications in Medicine) viewer. Because this tool was developed and designed to be used in preexisting scans, radiation exposure was not controlled for and images were not reformatted into a semicoronal view. Because imaging techniques and machines are likely to evolve over time, patients with AS were matched to control patients whose scans were completed contemporaneously (defined as within 2 yrs). Additionally, all scans had similar spatial resolution with 93% of scans having a reformatted slice thickness of 3 mm in coronal view and 5 mm in transverse view. Scans were performed across 2 hospitals using multislice detector systems, and intravenous, oral, and rectal contrasts were used depending on the initial clinical indication.
Statistical analysis
The Student t test and Fisher’s exact test were used to compare groups where appropriate. Receiver-operating characteristic (ROC) curves were created to assess the performance of different scoring criteria in differentiating patients with AS from controls. Inter- and intraobserver variability, sensitivity, specificity, and positive and negative likelihood ratios (LR) were calculated for each variable. The statistical analysis was carried out by using the Statistical Package for Social Science, version 22.0. Inter- and intrarater reliability was assessed using κ for nominal variables (yes/no for > 0.3 cm of sclerosis, > 0.5 cm of sclerosis, or ankylosis) and ICC for continuous variables (total no. erosions, no. large erosions, and no. erosions on the worst slice). Intrareader reliability was assessed using 10 CT scans from the test cohort read 2 weeks apart.
RESULTS
The median age of the patients with AS and controls was 44 years (range 18–83) with a 3.6:1 male:female ratio and a median disease duration of 19 years. The frequencies of extraarticular manifestations in the AS cohort were as follows: psoriasis 8%, uveitis 44%, and IBD 41%. The indications for CT scans in control patients were as follows: kidney stones 30%, malignancy staging 22%, bleeding/hematuria 15%, abdominal pain 11%, infection 7% (predominantly pyelonephritis), and miscellaneous 15%.
Radiographs of patients with AS revealed the entire breadth of sacroiliitis grades with bilateral grade 2 in 6 (13%), grades 3 and 1 in 4 (9%), grades 3 and 2 in 7 (15%), bilateral grade 3 in 10 (22%), grades 3 and 4 in 1 (2%), and bilateral grade 4 joints in 18 (39%).
Reliability
Within the derivation cohort, very good interreader reliability was seen in the scoring of ankylosis (κ = 1) and the number of erosions (ICC = 0.959 for iliac and ICC = 0.933 for sacral). Only moderate to fair interreader reliability was seen in the scoring of sclerosis (κ = 0.491–0.640). The intrareader reliability was very good for ankylosis (κ = 1) and the number of erosions (ICC = 0.990, 0.940). Sclerosis demonstrated very good to moderate reproducibility (κ = 0.530–1). Exact values are summarized in Supplementary Table 1 (available online at jrheum.org).
Utility of individual CT features in differentiating patients with AS from controls
Ankylosis was seen in 42% of patients with AS and 0% of control patients from the derivation cohort. Among patients without ankylosis, at least 1 erosion was seen in 100% of patients with AS and 50% of control patients. However, 100% of the patients with AS and 0% of the control patients were found to have a total erosion score of ≥ 3.
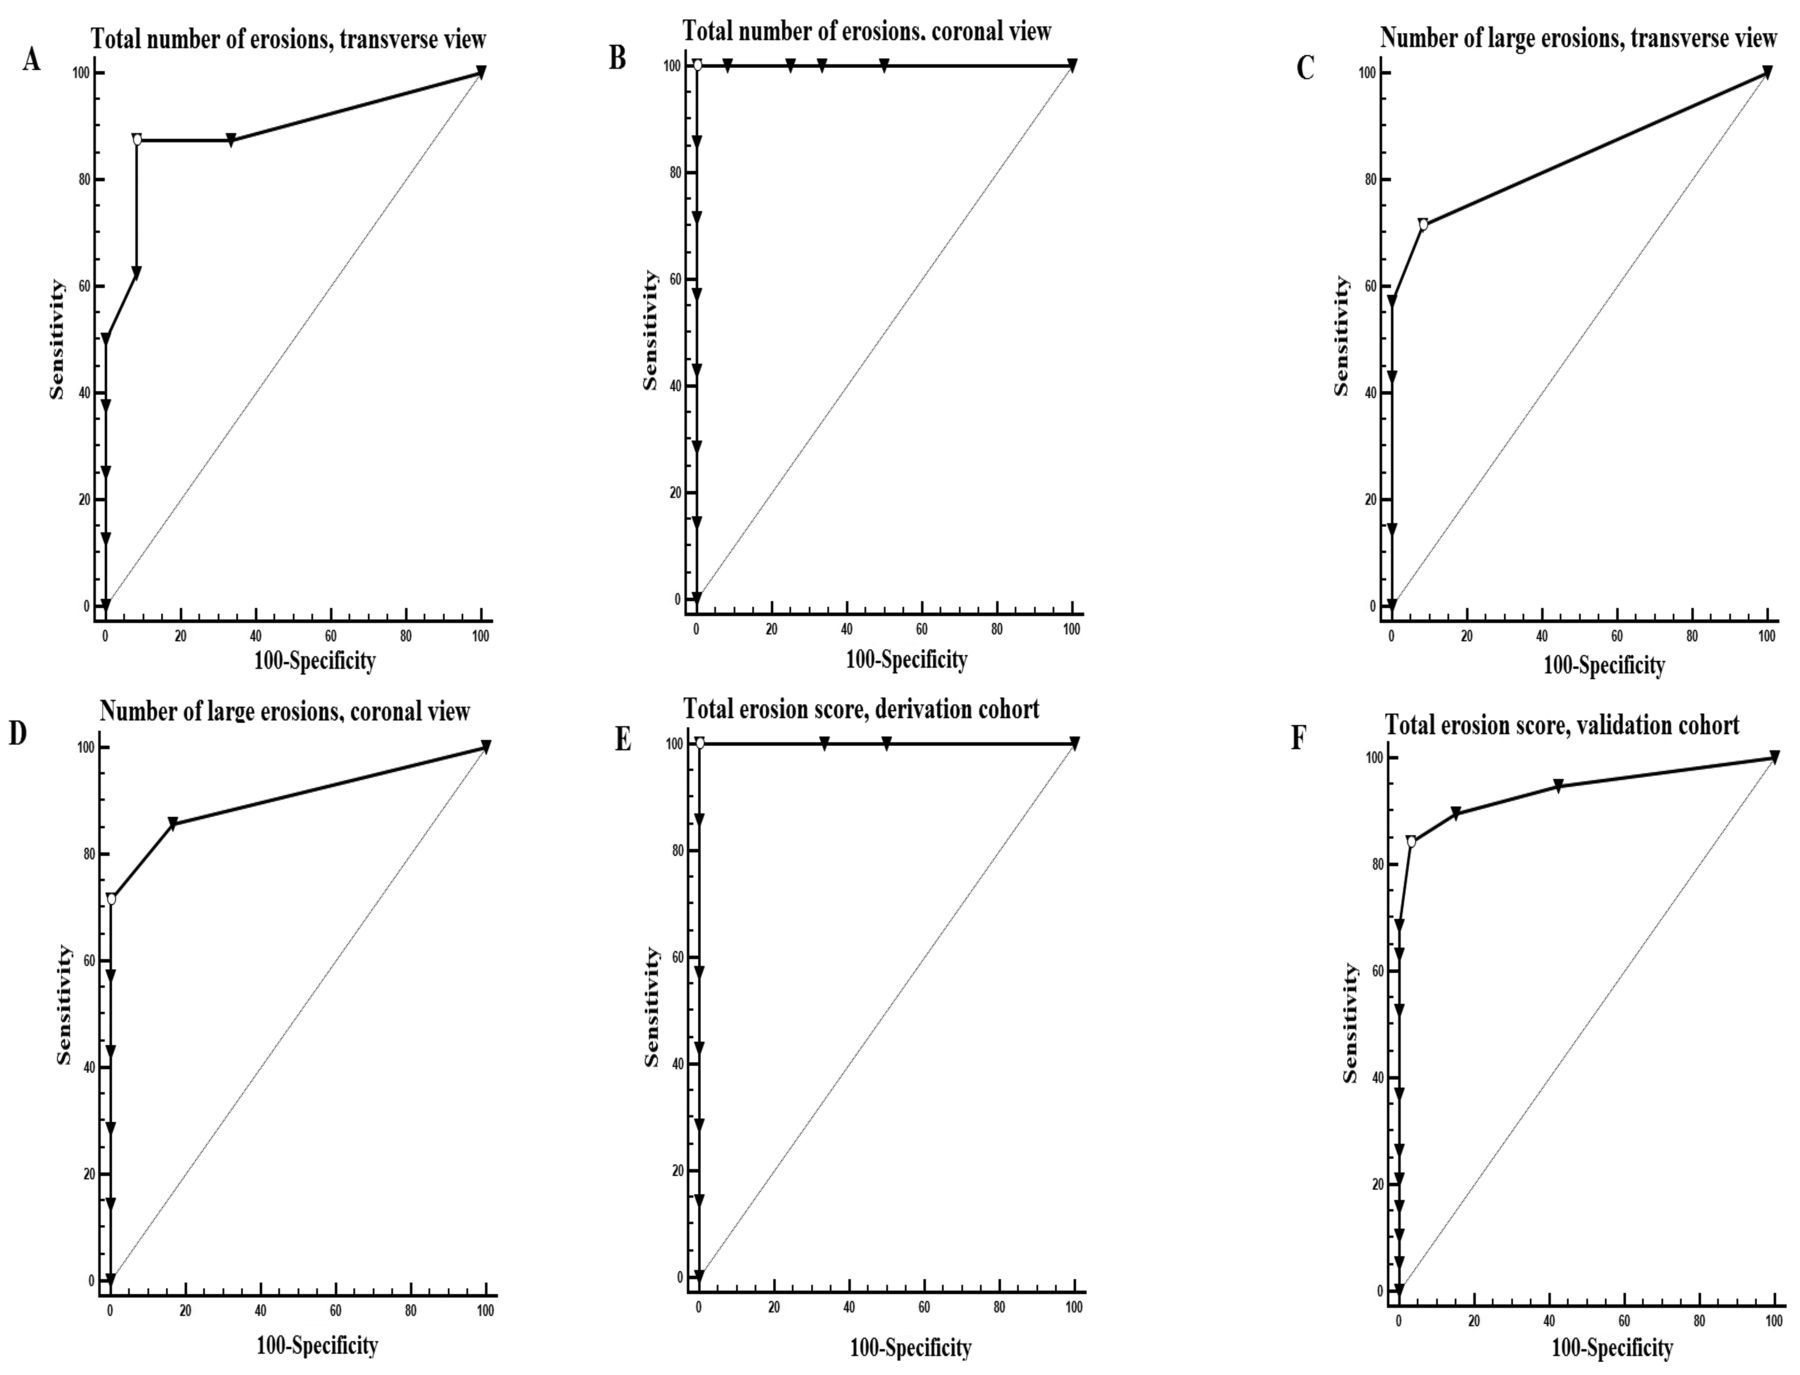
In the sensitivity analysis, different methods of scoring erosions were tested. ROC curves for each of these measurements are demonstrated in Figure 3A to Figure 3E. For differentiating AS from controls, counting the total number of erosions in both coronal and transverse views was not significantly better than calculating a total erosion score. On average, it took 30 min per patient to analyze every slice in both the coronal and transverse views whereas it took < 2 min to determine a total erosion score.

ROC curves of various methods of quantifying erosive burden. Large erosions were defined as erosions seen on more than 1 slice. (A) Total no. erosions seen on transverse view of the SI joints. (B) Total no. erosions seen on coronal view of the SI joints. (C) No. large erosions seen on transverse view of the SI joints. (D) No. large erosions seen on coronal view of the SI joints. (E) Total erosion score of derivation cohort. (F) Total erosion score of test cohort. ROC: receiver-operating characteristic; SI: sacroiliac.
Binary variables within the derivation cohort with optimal LR for AS (LR+, LR−) included ankylosis (∞, 0.6), presence of any iliac erosions (2.4, 0), and presence of any sacral erosions (12, 0). Using a cutoff of ankylosis > 1 cm or a total erosion score of ≥ 3 led to a sensitivity and specificity of 100% in this small cohort. Further details of each candidate variable can be found in Table 1.
Variables analyzed in the derivation cohort for sacroiliitis (12 AS and 12 control patients). Patients with ankylosis were not analyzed for erosive, sclerotic, or degenerative changes.
These same variables were analyzed in the test cohort, as seen in Table 2. Among patients without ankylosis, erosion measurements provided the highest sensitivity and specificity, and using a total erosion score of ≥ 3 once again demonstrated optimal positive and negative LR. Within the test cohort, a score of ≥ 3 led to a sensitivity of 83% and a specificity of 94%. When combining data from both cohorts, the results were 88% and 96%, respectively. Measurements of severe sclerosis provided high positive LR; however, they occurred infrequently. Figure 3F demonstrates the ROC curve for the total erosion score within the test cohort.
Variables analyzed in the test cohort for sacroiliitis (34 AS and 34 control patients). Patients with ankylosis were not analyzed for erosive or sclerotic changes.
Scoring system combining CT features
Different candidate criteria were assessed using various combinations of ankylosis, erosions, and sclerosis. Table 3 summarizes the various sensitivities, specificities, and LR of these criteria. We questioned whether the addition of a sclerosis component could improve the sensitivity or specificity of the tool. Based on the results found in Table 2, we described sclerosis as being present if either iliac sclerosis had a depth of > 0.5 cm or sacral sclerosis had a depth of > 0.3 cm. Thus, according to this criterion, patients would be considered to have AS if any 1 of the following were present: ankylosis, total erosion score of ≥ 3, > 0.5 cm iliac, or > 0.3 cm sacral sclerosis. Using a combination of ankylosis or a total erosion score of ≥ 3 provided a sensitivity of 91% and a specificity of 91%. Addition of sclerosis increased the sensitivity to 94% but lowered the specificity to 85%.
Candidate criteria for detecting sacroiliitis.
Three patients with AS who met the modified New York criteria were not detected by the proposed screening tool. One of these patients had bilateral grade 2 sacroiliitis and was asymptomatic while receiving no medications. The second patient also had bilateral grade 2 sacroiliitis, but was unresponsive to multiple antitumor necrosis factor (anti-TNF) agents. The third patient had a history of IBD and bilateral grade 3 sacroiliitis on radiograph; however, no features of sacroiliitis were found on CT scan and his back pain was unresponsive to multiple anti-TNF agents. In the sensitivity analysis, reading every slice in both the coronal and transverse views revealed no additional erosions in these 3 patients.
Two control patients received CT scans for examination of renal cell carcinoma and recurrent kidney stones, respectively, and were found to have SI joint changes indistinguishable from patients with AS. When contacted by a rheumatologist, neither patient had ever had a history of back pain or clinical features of spondylitis and thus would not meet the modified New York criteria for AS.
When patients from both the derivation and test cohorts were combined, the positive LR for sclerosis were as follows: iliac sclerosis > 0.3 cm = 1.4, iliac sclerosis > 0.5 cm = 3.1, sacral sclerosis > 0.3 cm = 3.8, and sacral sclerosis > 0.5 cm = 3.8. On the other hand, using data from both cohorts, the positive LR for a total erosion score of ≥ 3 was 20 and the negative LR was 0.1.
DISCUSSION
Our observational study systematically analyzed existing CT scans of patients with AS and control patients to develop and validate a screening tool for the classification of sacroiliitis characteristic of patients with AS. We report that the presence of ankylosis or a total erosion score of ≥ 3 has good sensitivity and specificity for sacroiliitis and best differentiated patients with clinically diagnosed AS from controls. The addition of sclerosis incrementally increases the sensitivity, but decreases the specificity of this screening tool. In our small cohort, we did not find that the analysis of all slices improved our precision; it would likely make the tool cumbersome and difficult to implement in practice.
A number of studies have assessed the involvement of CT11,14,15,17,19,20,21 and magnetic resonance imaging (MRI)22,23,24,25 in identifying structural changes of sacroiliitis. Vogler, et al14 demonstrated that CT scans showing erosions, ankylosis, uniform joint space narrowing (JSN) < 2 mm, and sacral sclerosis were suggestive of sacroiliitis, whereas uniform sclerosis, focal JSN, and iliac subchondral sclerosis were commonly seen in asymptomatic individuals. Erosions were reported as the most reliable indicator of sacroiliitis on CT scans by Slobodin, et al21 and Geijer, et al17. Joint space width was not analyzed because of poor interreader reliability, and because Shibata, et al15 had found a high prevalence of JSN in asymptomatic healthy patients using a cutoff of 2 mm.
Previous studies have highlighted the poor inter- and intrareader reliability of radiographs7,26,27,28 as well as the higher reliability of CT scan8,11,12,13,14,15,16,19,20 for diagnosing sacroiliitis. We had very good reliability for detecting ankylosis and the number of erosions, but only moderate to fair reliability for sclerosis. Sclerosis was frequently noted in control patients and our definition of sclerosis may have identified patients with osteitis condensans ilii and osteoarthritis. Qualifying the minimum amount of sacral sclerosis as > 0.3 cm and iliac sclerosis as > 0.5 cm allowed us to improve its specificity; however, the unreliability with assessing sclerosis and the minimal benefit of adding it to the model prompted us to eliminate it from the final criteria. Future work could focus on a more precise definition of sclerosis that is able to differentiate sacroiliitis from potential confounders.
One practical application of the criteria is its implementation in the reading of CT scans of high-risk patients such as those with IBD. Patients with IBD often have CT scans of their abdomen for the evaluation of their IBD. With this tool, radiologists can confidently identify sacroiliitis with as little as 3 erosions. Additionally, where access to MRI is limited, the application of this new tool can help in the evaluation of inflammatory back pain in primary care or rheumatology clinics. It is, however, important to note that the mere presence of sacroiliitis does not equate to SpA. Within our control group, 2 patients had changes suggestive of sacroiliitis that were indistinguishable from patients with AS; however, given the absence of back pain or any associated features of SpA, it is difficult to classify them as having definite axSpA.
Our study is based on real-world data from patients with IBD who were already diagnosed with AS. Although we have confirmed our findings in separate cohorts of patients, further validation needs to be done in patients with IBD not already diagnosed with AS. However, the majority of patients with IBD do not have AS, and it would be unethical to do such a prospective study, exposing patients to significant CT scans associated with radiation in the absence of other clinical indications. Until a low radiation dose CT scan of the SI joints is developed, this will likely continue to be a problem in future studies. Given our study’s retrospective design, there are several limitations, including the relatively low number of patients and the abundance of patients with advanced ankylosis. We assessed only patients with CT scans ordered for other clinical indications such as IBD and malignancy staging. This strategy contributed to the high rate (41%) of concomitant IBD in our patients with AS. For these reasons, we would be cautious about generalizing our findings to the AS population as a whole, particularly in patients with early disease. One would expect our results to have increased specificity and decreased sensitivity for early SpA. Nonetheless, among patients without ankylosis, the proposed cutoffs demonstrated a reasonable sensitivity of 88% and specificity of 96%.
In our study of 92 CT scans, noting discrete erosions or contiguous marrow sufficiently distinguished patients with AS from control patients. However, because erosions become more numerous and conglomerate before evolving into complete ankylosis, it is possible that there is a window of time during which few discrete erosions are noted and marrow has not become truly contiguous. We did not encounter any cases of impending ankylosis without a total erosion score of at least 3, but a larger sample size would be required to determine how frequently patients might be missed.
Given our study’s retrospective design, it is possible that some patients in the control group may have had axSpA that was either undiagnosed or not available in the chart. However, given the rarity of SpA, one would not expect this to significantly distort the results.
Our study was not designed to assess the involvement of CT scan in nr-axSpA. All patients satisfied the modified New York criteria, but 3 patients did not have CT changes. As mentioned, all of these patients had atypical responses to therapy and it is possible that they did not actually have AS. While these patients met the modified New York criteria, the discrepancies highlight the difficulty of scoring pelvic radiographs7,18,26,27,28.
Finally, because of the fact that our study used already available CT scans, patients within our study had received different imaging protocols. Though the ideal control group for our study would be patients with nonspecific low back pain, typical CT scan protocols for this indication do not include the SI joints. Patients with nephrolithiasis were a suitable control population because there are few other common indications to perform CT scans in young individuals. We recognize that contrast was administered to a majority of patients with IBD and that this could lead to degradation in quality of scans in patients with IBD in comparison with scans in patients with nephrolithiasis. Our goal was to develop a scoring system in preexisting images acquired under such circumstances. Patients for whom this screening tool is being developed would likely not have had reformatted images, specialized CT protocols of the SI joints, or images with a bone kernel. This new method of identifying sacroiliitis can help avoid further imaging, especially in circumstances where there is an undue delay in accessing MRI imaging.
It is proposed that future studies would determine an optimal protocol for a low radiation–dose CT with standardized slice thicknesses in a larger cohort. Further, studies could assess sacroiliitis on CT scan in patients with nr-axSpA as well as nonspecific low back pain. In our study, we demonstrated that the presence of ankylosis > 1 cm or a total erosion score of ≥ 3 can be reliably used to screen for the classification of sacroiliitis on abdominal/pelvis CT scans.
ONLINE SUPPLEMENT
Supplementary data for this article are available online at jrheum.org.
Footnotes
Supported by an Assessment of Spondyloarthritis international Society fellowship grant, and in part by Janssen.
- Accepted for publication May 20, 2016.
REFERENCES
- 1.
- 2.
- 3.
- 4.
- 5.
- 6.
- 7.
- 8.
- 9.
- 10.
- 11.
- 12.
- 13.
- 14.
- 15.
- 16.
- 17.
- 18.
- 19.
- 20.
- 21.
- 22.
- 23.
- 24.
- 25.
- 26.
- 27.
- 28.