

Abstract
Objective. Accurate automated segmentation of cartilage should provide rapid reliable outcomes for both epidemiological studies and clinical trials. We aimed to assess the precision and responsiveness of cartilage thickness measured with careful manual segmentation or a novel automated technique.
Methods. Agreement of automated segmentation was assessed against 2 manual segmentation datasets: 379 magnetic resonance images manually segmented in-house (training set), and 582 from the Osteoarthritis Initiative with data available at 0, 1, and 2 years (biomarkers set). Agreement of mean thickness was assessed using Bland-Altman plots, and change with pairwise Student t test in the central medial femur (cMF) and tibia regions (cMT). Repeatability was assessed on a set of 19 knees imaged twice on the same day. Responsiveness was assessed using standardized response means (SRM).
Results. Agreement of manual versus automated methods was excellent with no meaningful systematic bias (training set: cMF bias 0.1 mm, 95% CI ± 0.35; biomarkers set: bias 0.1 mm ± 0.4). The smallest detectable difference for cMF was 0.13 mm (coefficient of variation 3.1%), and for cMT 0.16 mm(2.65%). Reported change using manual segmentations in the cMF region at 1 year was −0.031 mm (95% CI −0.022, −0.039), p < 10−4, SRM −0.31 (−0.23, −0.38); and at 2 years was −0.071 (−0.058, −0.085), p < 10−4, SRM −0.43 (−0.36, −0.49). Reported change using automated segmentations in the cMF at 1 year was −0.059 (−0.047, −0.071), p < 10−4, SRM −0.41 (−0.34, −0.48); and at 2 years was −0.14 (−0.123, −0.157, p < 10−4, SRM −0.67 (−0.6, −0.72).
Conclusion. A novel cartilage segmentation method provides highly accurate and repeatable measures with cartilage thickness measurements comparable to those of careful manual segmentation, but with improved responsiveness.
Cartilage is a key tissue of interest in structure modification trials of osteoarthritis (OA). Although radiographic joint space width, a surrogate for cartilage loss, is the regulatory endpoint in these trials, there is increasing evidence of the benefits of direct measures of cartilage morphology using magnetic resonance imaging (MRI)1.
Techniques using manual segmentation of cartilage have been explored regarding a number of morphological characteristics, including volume and thickness, and extensively validated, including construct validity against radiographic joint space width, predictive and concurrent validity, and clinical outcomes2,3,4,5. MRI cartilage thickness measures are associated with OA progression and joint replacement, and provide more responsive measures of progression than radiographic joint space narrowing (JSN)5,6,7.
However, manual segmentation of cartilage morphology is time-consuming, tedious, and challenging as careful attention must be paid to detecting the eroding outer margin of the cartilage. It therefore takes considerable time (hours) to carefully segment a single MR image, being composed in this case of 160 slices, limiting the utility of the method in analyzing large datasets such as the Osteoarthritis Initiative (OAI), which includes data from over 9000 knees at multiple timepoints. Additionally, the average amount of cartilage lost on each bone in the medial tibiofemoral joint of an OA knee is very small, typically around 50–100 microns per annum. This equates to a change of around one-fifth to one-tenth of a pixel in a typical MR image. To improve the speed of segmentation, some techniques for analysis have incorporated varying degrees of user input into semiautomated cartilage assessment8.
Fully automated segmentation is desirable, but the reliability and responsiveness of any such methods need to be established in a method that does not rely upon any user interaction. Fully automated methods based on active appearance modeling (AAM) have demonstrated good measurement accuracy for a number of MRI-assessed tissues including knee cartilage, bone area, and bone shape9,10. The addition of supervised machine learning to the AAM methodology offers potential enhancement regarding improved voxel classification, resulting in improved accuracy and responsiveness. A previous exercise used a preliminary version of this technology10 but used a training set that had relatively crude manual segmentation, was not widely reflective of an OA population, used different MRI sequences from those in this study (making it impossible to run the older technology on the new dataset), and contained no longitudinal data.
In our study, we examined the performance metrics of a novel extension of AAM technology that incorporated a final refinement stage using supervised machine learning (automatic quantification of cartilage, AQ-CART). We assessed mean cartilage thickness in the anatomical locations that are commonly used in OA studies; we examined the accuracy and reliability of the method, agreement with careful manual segmentation, and relative responsiveness.
MATERIALS AND METHODS
A number of comparisons were used in this study. For convenience, a summary of the datasets used and the analyses performed are provided in Table 1.
Datasets and analysis methods used in this study.
Image selection
A set of 379 patient single-knee MRI images (“training” set) were used as input data for the supervised machine learning step of AQ-CART. These were selected to represent the entire range of radiographic OA structural severity, including medial compartment Kellgren-Lawrence grades 0–4, lateral compartment OA, together with young healthy knees, which tend to have thicker cartilage. Two hundred eighty-seven images were acquired using a 3-D double echo steady state sequence from the OAI (voxel size 0.3 × 0.3 × 0.7 mm) but were not members of the biomarkers set. Ninety-two images were acquired using a Philips 3D T2*–weighted 3-D gradient-echo sequence with water excitation (voxel size 0.3 × 0.3 × 1.5 mm). The AAM training set has been described previously11,12.
Repeatability was performed on the repeatability image set, a group of 19 subjects with and without radiographic OA that had test-retest single knee images acquired as a pilot study for the OAI13.
For agreement and responsiveness, we used patient datasets from the OA Biomarkers Consortium Foundation for the US National Institutes of Health (FNIH) substudy of the OAI (oai.epi-ucsf.org/datarelease/FNIH.asp). Of 600 patients in the study, 582 patient datasets had manual cartilage measurements (biomarkers image set) recorded at baseline, 1, and 2 years, resulting in subgroups of 196 nonprogressors and 386 progressors for either pain or structure or both, according to the FNIH subgroups. All images in these analyses used the DESS MRI sequence: additional variables of the full OAI pulse sequence protocol and sequence variables have been published in detail14.
Ethics approval
The OAI study received ethical approval from the University of California San Francisco OAI Coordinating Center institutional review board (IRB) number 10-00532, reference 210064, Federalwide Assurance #00000068, and the OAI Clinical Sites Single IRB of Record was for study number 2017H0487, Federalwide Assurance #00006378. All patients provided informed consent to the OAI. Some of the training set images were collected under a study approved by the ethics committee of Lund University (LU-535).
Selection of regions for comparison
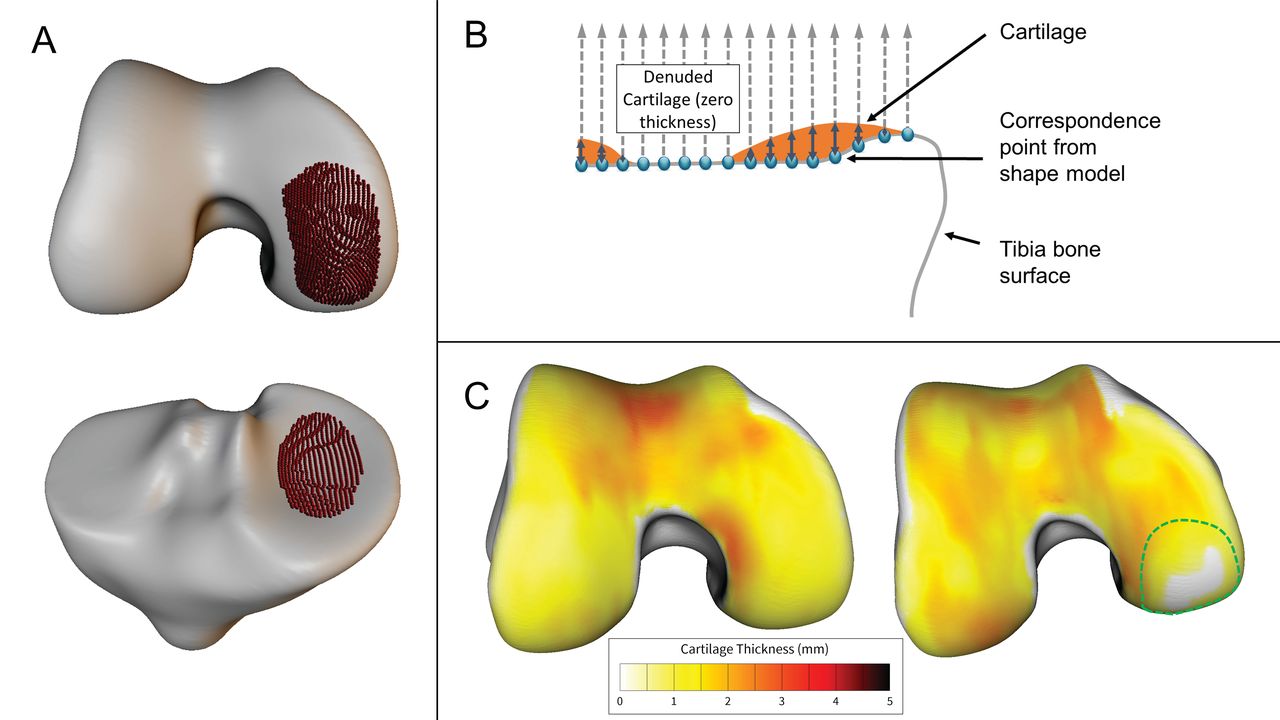
A number of anatomical regions of cartilage were provided on the OAI Website. For convenience we chose the regions usually considered the most responsive, the central medial femur (cMF) and central medial tibia (cMT; oai.epi-ucsf.org/datarelease/SASDocs/kMRI_FNIH_QCart_Chondrometrics_Descrip.pdf)15. The mean thickness measure (ThCtAB) from each region was compared with the mean thickness from the automated segmentation. For automated segmentation, regions were selected on the mean shape model to match the anatomical definition used for the manual method (Figure 1A). For reference, the variable names of the baseline cartilage measures for the manual method were V00BMFMTH (cMF.ThCtAB) and V00CMTMTH (cMT.ThCtAB).

Measurement methodology. A. Selected regions of the central medial femur (cMF, top) and the central medial tibia (cMT, bottom). Each correspondence point within the shape model is shown as a red sphere on the surface of the mean bone shapes; there are 1527 correspondence points in the cMF region, and 828 in the cMT regions. B. Schematic illustration of the method by which cartilage thickness is measured using the anatomically corresponded regional analysis of cartilage method. From each correspondence point, the distance along a line normal to the surface, and the distance from the bone to the outer cartilage surface is recorded (note: normals are shown schematically, all in the same direction; in practice, normal direction varies slightly with the curvature of the bone surface). C. Typical examples of cartilage thickness in the femur of a healthy knee (left), and an OA knee (right). Note that the OA knee is denuded in part of the cMF region (dotted green line). OA: osteoarthritis.
Manual segmentation method — biomarkers dataset
Cartilage thickness was measured in the biomarkers image set, using manual segmentation of the femorotibial cartilage surfaces by experienced segmenters, and reviewed by an expert as has been described previously16,17 (Chondrometrics GmBH).
Manual segmentation and surface building — training dataset
For the supervised learning algorithm training set, cartilage was manually segmented by experienced segmenters, using Imorphics EndPoint software (Imorphics) with the training image set. Three-D surfaces were generated from the cartilage contours in each image slice using a marching cubes algorithm, followed by geometric smoothing.
AQ-CART method
Each image was automatically segmented using 3-D AAM of bone and cartilage using a multistart optimization. Active appearance models are widely used in medical imaging and fit the shape and grey-level variations of a training set to a 3-D image, and are capable of rapid and accurate 3-D segmentation, with subvoxel accuracy18. Initially, this fits low-density, low-resolution deformable models but ends in a robust matching of detailed high-resolution models. Finally, in a novel step, the voxels contained in the cartilage region are assigned with a nonlinear regression function, based on a bootstrap aggregation, chosen using a probably approximately correct learning method.
Cartilage thickness was measured using the anatomically corresponded regional analysis of cartilage (ACRAC)11,19, which is summarized in Figure 1B. From each correspondence point on the 3-D bone surface, which is the result of an AAM bone search, we measured the distance from the bone to the outer cartilage surface, along a line normal to the bone surface. In addition to providing accurate and repeatable measurement, this process fits all examples with a consistent dense set of anatomical landmarks, which can be used to take a measurement at the same point across a population and between timepoints, correcting for both the size and shape of each bone.
Accuracy, reliability, and comparative analyses
Accuracy of AQ-CART was determined using the training image set, using leave-25%-out models. In this method, 4 models are built, each of which leaves out 25% of the training examples. Each image is then searched using the single model that does not contain itself as a training example. This means that each image is searched using an unbiased model.
ACRAC cartilage thickness maps (Figure 1C) were then prepared for both manual and automated segmentations and used to calculate the mean thickness within each region. Correlation and agreement of the mean thickness measure was assessed using least squares linear fits and Bland-Altman plots.
Repeatability of AQ-CART was assessed on the repeatability set, using the smallest detectable difference (SDD) defined as the 95% CI on the Bland-Altman plot, and the coefficient of variation (CoV) using the root mean square method.
Agreement of the mean thickness reported by the manual and automated segmentation methods using the baseline images of the biomarkers image set was assessed using Bland-Altman plots. We then compared change from baseline of both methods using pairwise Student t tests of mean thickness of the cMF and cMT in the 582 knees. Agreement of 2-year change from baseline, as reported by the manual and automated segmentation methods, was assessed using a Bland-Altman plot. Responsiveness was assessed using standardized response means (SRM). Confidence limits for the SRM were calculated using a bootstrap method (MedCalc Software). Results were calculated separately for the 4 FNIH Biomarkers subgroups, which were JSN progressors, pain progressors, combined JSN and pain progressors, and nonprogressors5.
RESULTS
Correlation and agreement mean cartilage thickness using the training set
Correlation of the mean thickness reported by the manual and automated methods was r2 = 0.97 for the cMF region, and 0.84 for the cMT. The equation for the linear least squares fit between the manual and automated methods for the cMF region was y = 0.81x + 0.44; for the cMT region, y = 0.81x + 0.35 (Figure 2, top row). The automated segmentation had a small tendency to under-segment thicker cartilage and over-segment thinner cartilage, when compared with the training set. Systematic bias for the cMF region was 0.098 mm, and 95% limits of agreement were 0.354 mm; for the cMT region bias was −0.026 and 95% limits of agreement were 0.420 (Figure 2, bottom row).

Correlation and agreement of mean thickness in the training set. Top graphs show a scatter plot of mean thickness values, comparing reported mean thickness values for manual and automated segmentations in the training set, using miss-25%-out models, for the central medial femur region (left) and central medial tibia region (right), together with the results of a linear fit, plus the r2 value for the correlation of the datasets. The same data are displayed in the lower graphs using a Bland-Altman plot to assess agreement; bias is shown with a thickly dashed line, and 95% CI are shown using a dotted line.
Repeatability
The SDD in the repeatability image set for the cMF region was 0.13 mm, CoV 3.1%; for the cMT region the SDD was 0.16 mm, CoV 2.65% (Bland-Altman plot not shown).
Agreement between baseline manual segmentations (biomarkers set)
Systematic bias of the mean thickness reported by the manual and automated methods for the cMF region at baseline was +0.09 mm, 95% confidence limits were ± 0.35 mm; for the cMT region bias was −0.2 mm, 95% confidence limits were ± 0.39 mm (Figure 3).
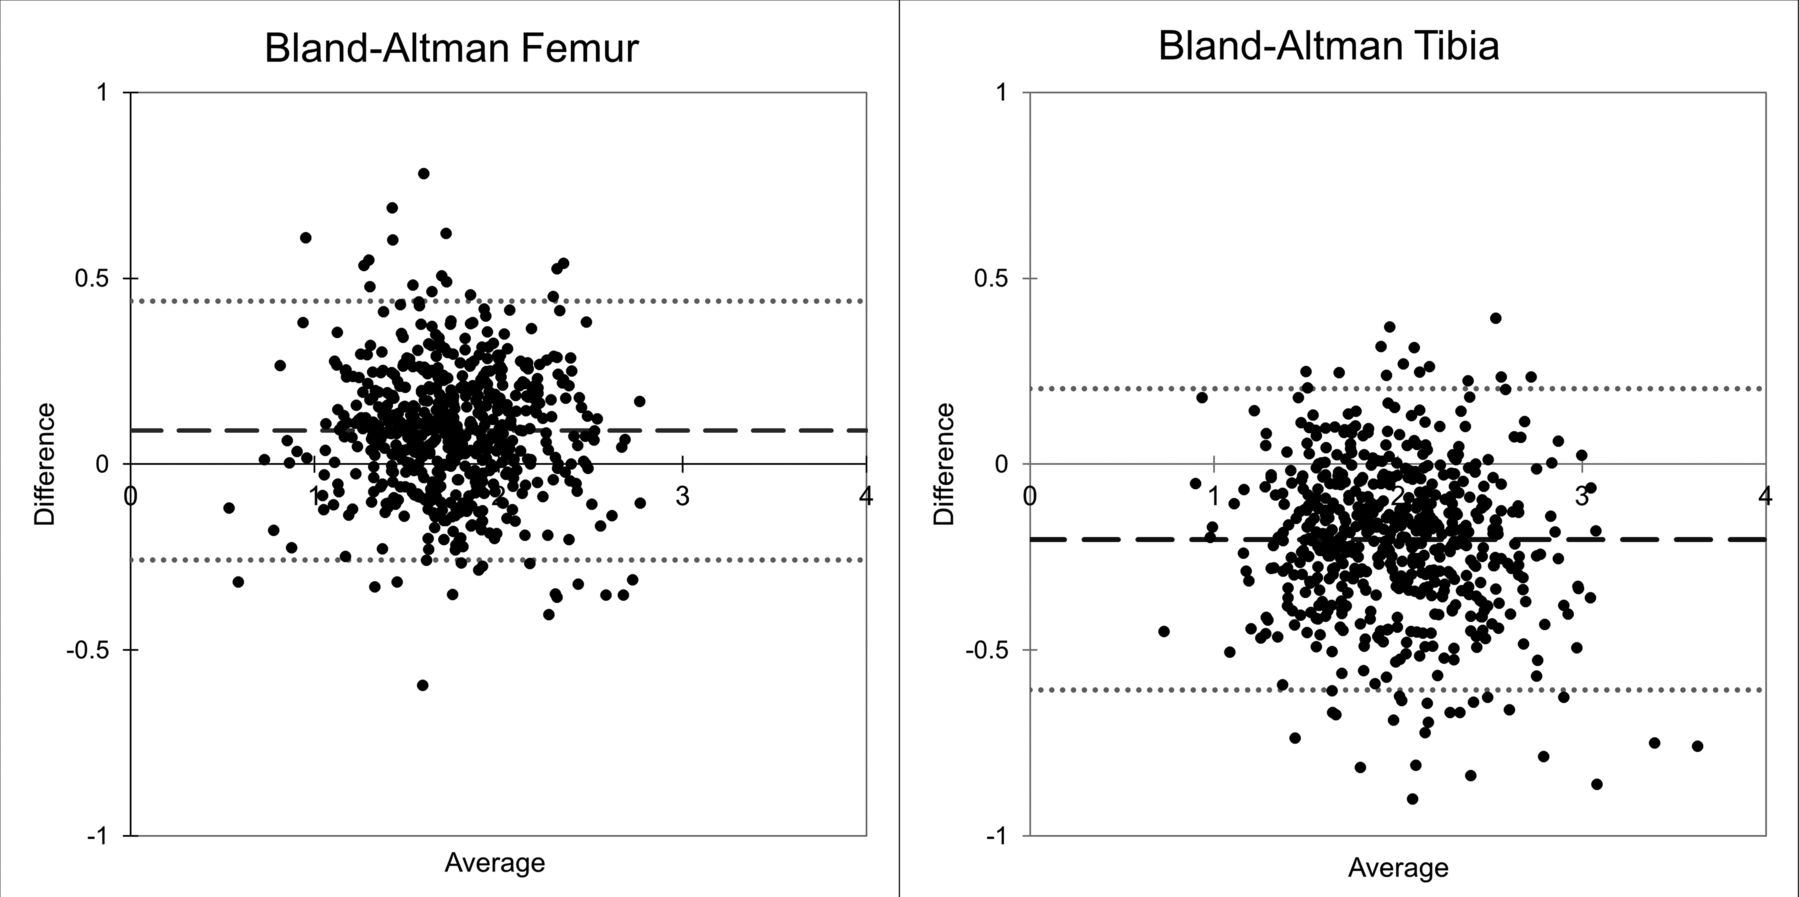
Agreement of mean cartilage thickness in the biomarkers set. Systematic bias is shown with a thickly dashed line, and the 95% CI are shown using a dotted line for the central medial femur (left) and central medial tibia (right).
Agreement of 2-year change (biomarkers set)
In the biomarkers set of 582 knees, the reported change in mean thickness measured with automated segmentation was around twice that reported by that with manual segmentation. SRM values were also higher for the automated method. For example, change in manual cMF at 1 year was −0.031 mm (95% CI −0.022, −0.039, p < 10−4), SRM −0.31 (−0.23, −0.38); at 2 years this was −0.071 (−0.058, −0.085, p < 10−4), SRM −0.43 (−0.36, −0.49). Change in automated cMF at 1 year was −0.059 (−0.047, −0.071, p < 10−4), SRM −0.41 (−0.34, −0.48); 2-year change was −0.14 (−0.123, −0.157, p < 10−4), SRM −0.67 (−0.6, −0.72; Figure 4).
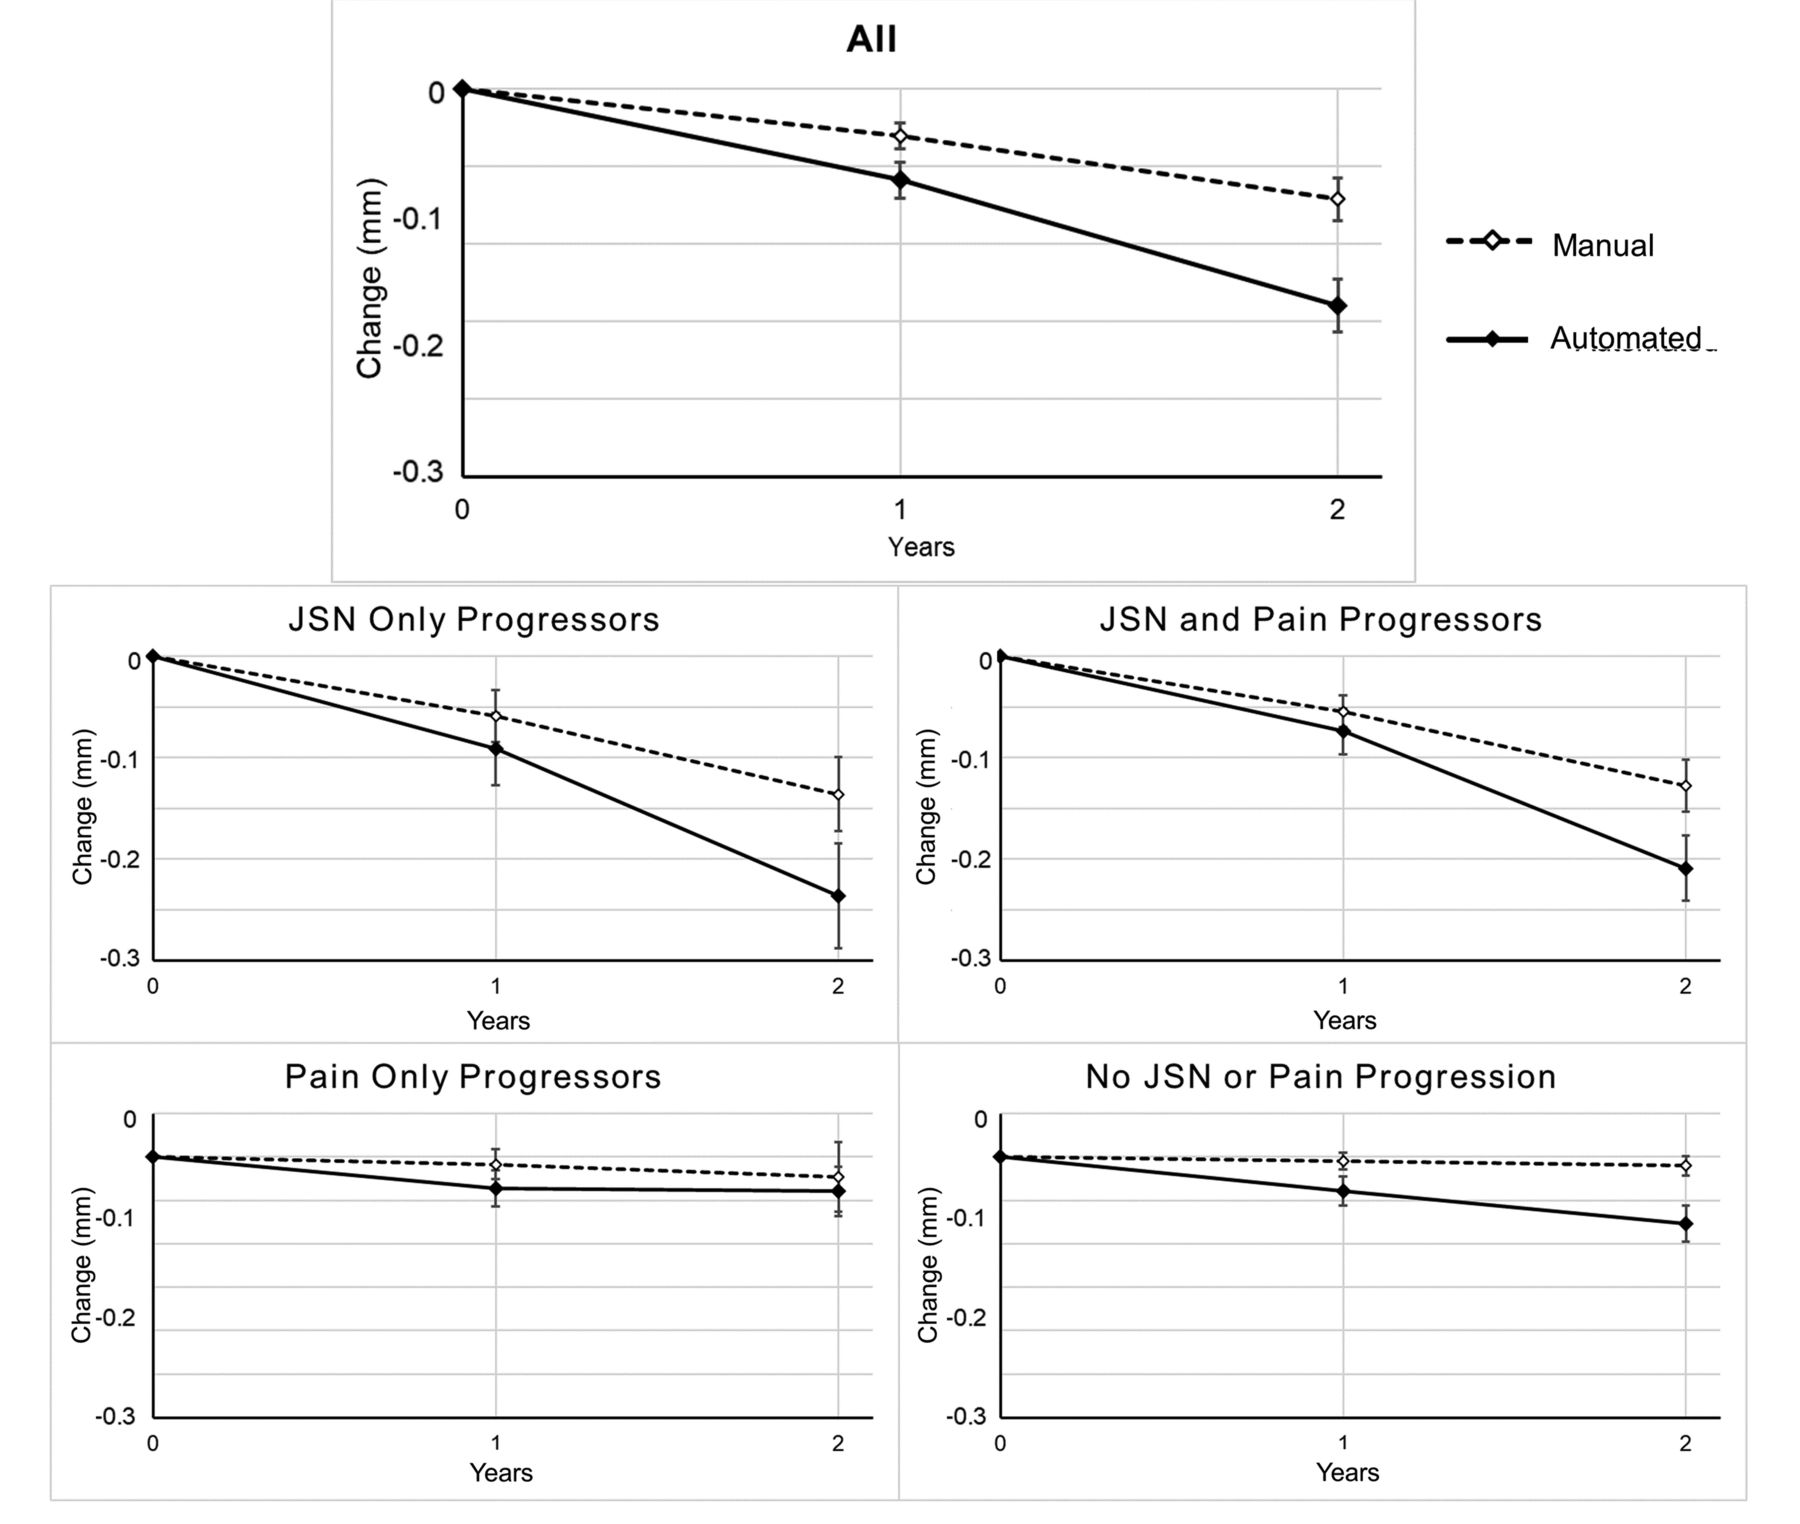
Graphic representation of 2-year change in central medial femur region by US Foundation for the National Institutes of Health Biomarkers subgroup. Results are shown for all 582 knees, together with the 4 subgroups: JSN-only progressors (n = 102), both JSN and pain progressors (n = 183), pain-only progressors (n = 101), and those with no JSN or pain progression (n = 196). Further detail is provided in Table 2, along with results for the central medial tibia. Error bars represent 95% CI. JSN: joint space narrowing.
The detection of greater change with the automated method was consistent in both of the JSN subgroups (Figure 1); additionally, the automated method detected a significant change in cartilage thickness at both timepoints in those who did not progress with either pain or JSN. Neither method showed any change in those who progressed only in their pain score. Detailed results for all subgroups of femur and tibia using manual and automated methods is shown in Table 2.
Comparison of 1-year and 2-year change in cartilage thickness from baseline in the biomarkers set.
Time required for automatic analysis
Automatic segmentation of a single image, using a single central processing unit (CPU) core of a personal computer (PC), took on average 45 s, and calculation of cartilage thickness and volume required a further 7 s.
DISCUSSION
The novel automated segmentation technique reported here demonstrated excellent accuracy and reliability in assessing cartilage thickness in the medial tibiofemoral joint, the most commonly used region assessed in clinical trials. There was also excellent agreement with both cross-sectional measurement and longitudinal change in cartilage thickness when compared with a well-established manual segmentation method.
The agreement of automated segmentation measurements using the training set was excellent with no meaningful systematic bias. The automated segmentation had a small tendency to under-segment the thickest cartilage, and to over-segment denuded cartilage when compared with the training set. In the central medial femur, cartilage with mean thickness of 3 mm (about the 95th percentile of cartilage thickness distribution in the training set) would be under-segmented by 0.25 mm, or about half of the average length of a voxel edge. Completely denuded cartilage (mean thickness of 0 mm) would be over-segmented by 0.44 mm. Repeatability of the automated method (SDD of around 0.14 mm, and CoV of 2.5 and 3.1%) was excellent, and comparable with values reported for manual segmentation methods11,13.
When comparing automated segmentation with the careful manual segmentation method of another group in the biomarkers dataset, the automated method reported a slightly thicker average measure than the manual method of about 0.1 mm. This small difference is not particularly surprising for a few reasons: the 2 measures are calculated in very different ways, the regions to be measured were prepared independently, and the manual segmentation of the automated training set and manual set were also prepared independently. However, despite these differences in methodology, the agreement between the 2 methods was excellent, as illustrated by the Bland-Altman plot.
The correlation of longitudinal change in the femur and tibia for the biomarkers set was excellent, although the correlation of tibia measures was lower (0.87 vs 0.95 for the femur). We cannot be certain why the tibia has a lower correlation; as noted above, the methodologies are different, and both correlation coefficients are acceptable.
We did not perform a correlation of the individual longitudinal changes, because these would not be expected to correlate, given the amount of change found here, and the reported measurement errors of the methods. Given 2 methods, with measurement SD of 0.075 mm (about the SD for the 2 methods), and a test set that contains changes of between 0 and 0.15 mm (the approximate range of annual changes found here), the correlation of the 2 methods will be very low (< 0.02), assuming perfect agreement between the methods. Any single measurement will contain the actual change, plus a normally distributed error ranging from −0.14 mm to +0.14 mm (the 95th percentile, or 1.96 × SD). Most of the differences found are dominated by noise, and do not reflect true change. In a larger group, these differences in noise cancel each other out.
Automated segmentation of tissues that change by small fractional amounts are often insensitive to any such change; such methods are often repeatable because of regression to the mean during the automated search. This causes potential over-segmentation of thin cartilage, and under-segmentation of thick cartilage. However, automated segmentation with AQ-CART was at least as sensitive to change as careful manual segmentation, and this responsiveness was seen across the clinical progression subgroups. Additionally, the “nonprogressor” group demonstrated significant cartilage thickness loss at both 1 and 2 years with the automated method, whereas no change was measured using the manual method.
The improved responsiveness was a consequence of the automated method identifying about twice as much change (in the femur), with similar levels of measurement noise. A typical amount of average cartilage thickness loss is tiny, much less than 1 voxel width in a year. This means that cartilage loss is fundamentally a change in what becomes a partial volume in an MR image sampling voxel at the outer edge of the cartilage. Human measurement is not capable of dealing with these partial volumes and it is likely that a human reader at a standard computer display cannot adequately resolve such differences in partial volume, whereas an algorithm can. All measurement methods contain errors, and there is no “ground truth” in our study, such as an independent measure of cartilage thickness using more accurate methods; it is not possible to be certain that improved responsiveness is caused by cartilage changing by an additional 50 microns per year.
The short time required for analysis of an image (52 s), compared with the preparation of a manual segmentation (typically around 4 h for our in-house segmenters), allows for the segmentation of large numbers of images. In actuality, this time is shorter; 52 s are required for a single CPU core of a PC; however, a typical desktop machine can run 8 threads simultaneously, reducing the average time for a single segmentation to around 10 s per image, with no requirement for user input.
A potential limitation of this work was that the models were trained and tested on 2 particular MRI sequences, and these were obtained using the same manufacturers and models of MRI machines, from an observational study in which image quality was tightly controlled. The accuracy, repeatability, and responsiveness of these models may not provide the same results when using other MR imaging sequences.
Application of a novel AAM-based cartilage segmentation incorporating a supervised machine learning step provided highly accurate and repeatable measurement of cartilage thickness with excellent agreement with careful manual segmentation, but with improved responsiveness.
Footnotes
This study was supported by internal funding. Scientific and financial support for the US Foundation for the National Institutes of Health (FNIH) Osteoarthritis Biomarkers Consortium and the study are made possible through grants and direct contributions provided by AbbVie, Amgen, Arthritis Foundation, Bioiberica S.A., DePuy Mitek, Flexion Therapeutics, GlaxoSmithKline, Merck Serono, Rottapharm Madaus, Sanofi, and Stryker, The Pivotal Osteoarthritis Initiative (OAI) Magnetic Resonance Imaging Analyses (POMA) Study, NIH HHSN2682010000. The OAI is a public–private partnership comprising 5 contracts (N01-AR-2-2258; N01-AR-2-2259; N01-AR-2-2260; N01-AR-2-2261; N01-AR-2-2262) funded by the NIH, a branch of the Department of Health and Human Services, and conducted by the OAI Study Investigators. Funding partners include Merck Research Laboratories, Novartis Pharmaceuticals Corp., GlaxoSmithKline, and Pfizer Inc. Private sector funding for the Consortium and OAI is managed by the FNIH. This manuscript was prepared using an OAI public use dataset and does not necessarily reflect the opinions or views of the OAI investigators, the NIH, or the private funding partners. PGC is supported in part by the NIHR infrastructure at Leeds. The views expressed are those of the author(s) and not necessarily those of the NHS, the NIHR, or the Department of Health.
- Accepted for publication March 26, 2019.


