

Abstract
Objective. The genetic component of ankylosing spondylitis (AS) development is ∼90%. Of the known heritability, ∼20% is explained by HLA-B27, and 113 identified AS-associated single-nucleotide polymorphisms (SNP) account for ∼7.4%. The objectives were to construct a weighted genetic risk score (wGRS) using currently known genome-wide susceptibility SNP, and to evaluate its predictive ability for AS in the Norwegian population-based Nord-Trøndelag Health Study (HUNT).
Methods. AS cases (n = 164) and controls (n = 49,032) were from the second (1995–1997) and third (2006–2008) waves of the HUNT study, to which the entire adult population of the northern region of Trøndelag was invited. A wGRS based on 110 SNP weighted by published OR for AS was constructed, representing each person’s carriage of all risk variants. Logistic regression models including the wGRS alone or in combination with HLA-B27 carrier state and other adjustment variables (sex, age, smoking, body mass index, and hypertension) were developed. Discrimination among models was compared using area under the curve (AUC).
Results. The wGRS was associated with AS (OR 1.7, 95% CI 1.4–2.1), but showed low discrimination (AUC 0.62, 95% CI 0.58–0.67). HLA-B27 was significantly associated with AS (OR 50, 95% CI 32–81), showing high discrimination (AUC 0.88, 95% CI 0.85–0.90). Combining the wGRS and HLA-B27 improved prediction (AUC 0.90, 95% CI 0.87–0.92; p < 0.001 vs wGRS alone, p < 0.01 vs HLA-B27 alone). Further inclusion of adjustment variables gave a small improvement (AUC 0.91, 95% CI 0.89–0.94; p = 0.03).
Conclusion. Prediction in a population-based setting based on all currently known AS susceptibility SNP was better than HLA-B27 carrier state alone, although the improvement was small and of uncertain clinical value.
Spondylarthritis (SpA) refers to a group of immune-mediated inflammatory rheumatic diseases showing common genetic and clinical features. Ankylosing spondylitis (AS) is an axial SpA characterized by structural changes in the sacroiliac joints1 and spine2. AS is associated with disability and reduced quality of life3. The prevalence is estimated to 23.8 per 10,000 persons in Europe4.
The etiology of AS is only partly understood. The genetic component of AS development is estimated from twin studies to be around 90%5, which is higher than in other rheumatic diseases such as rheumatoid arthritis6. About 20% of the known heritability for AS is attributed to HLA-B27 and about 7.4% to 113 single-nucleotide polymorphisms (SNP) found in association studies7. Thus, about 60% of the heritability is probably determined by as-yet-unmapped variants.
A genetic risk score (GRS) is a multilocus profile of genetic risk, which may be used to study complex diseases in population health research8. GRS models could help earlier identification of people at increased risk of developing the disease, potentially permitting prevention or earlier treatment. Such models may also be developed to estimate the probability of the disease outcome on the population level9. The hypothesis for our present study was that despite the current knowledge regarding almost 30% of the heritability for AS, disease prediction on a population level would be imprecise. We further hypothesized that inclusion of nongenetic variables would give a significant improvement of prediction.
The aims of our current study were to construct a genetic risk score based on validated SNP from the most comprehensive association study on AS to date7, and to evaluate its predictive ability for AS in combination with relevant nongenetic variables in a population-based setting with data from the Nord-Trøndelag Health Study (HUNT). Finally, we wanted to evaluate whether addition of validated SNP for AS from other studies could improve prediction.
MATERIALS AND METHODS
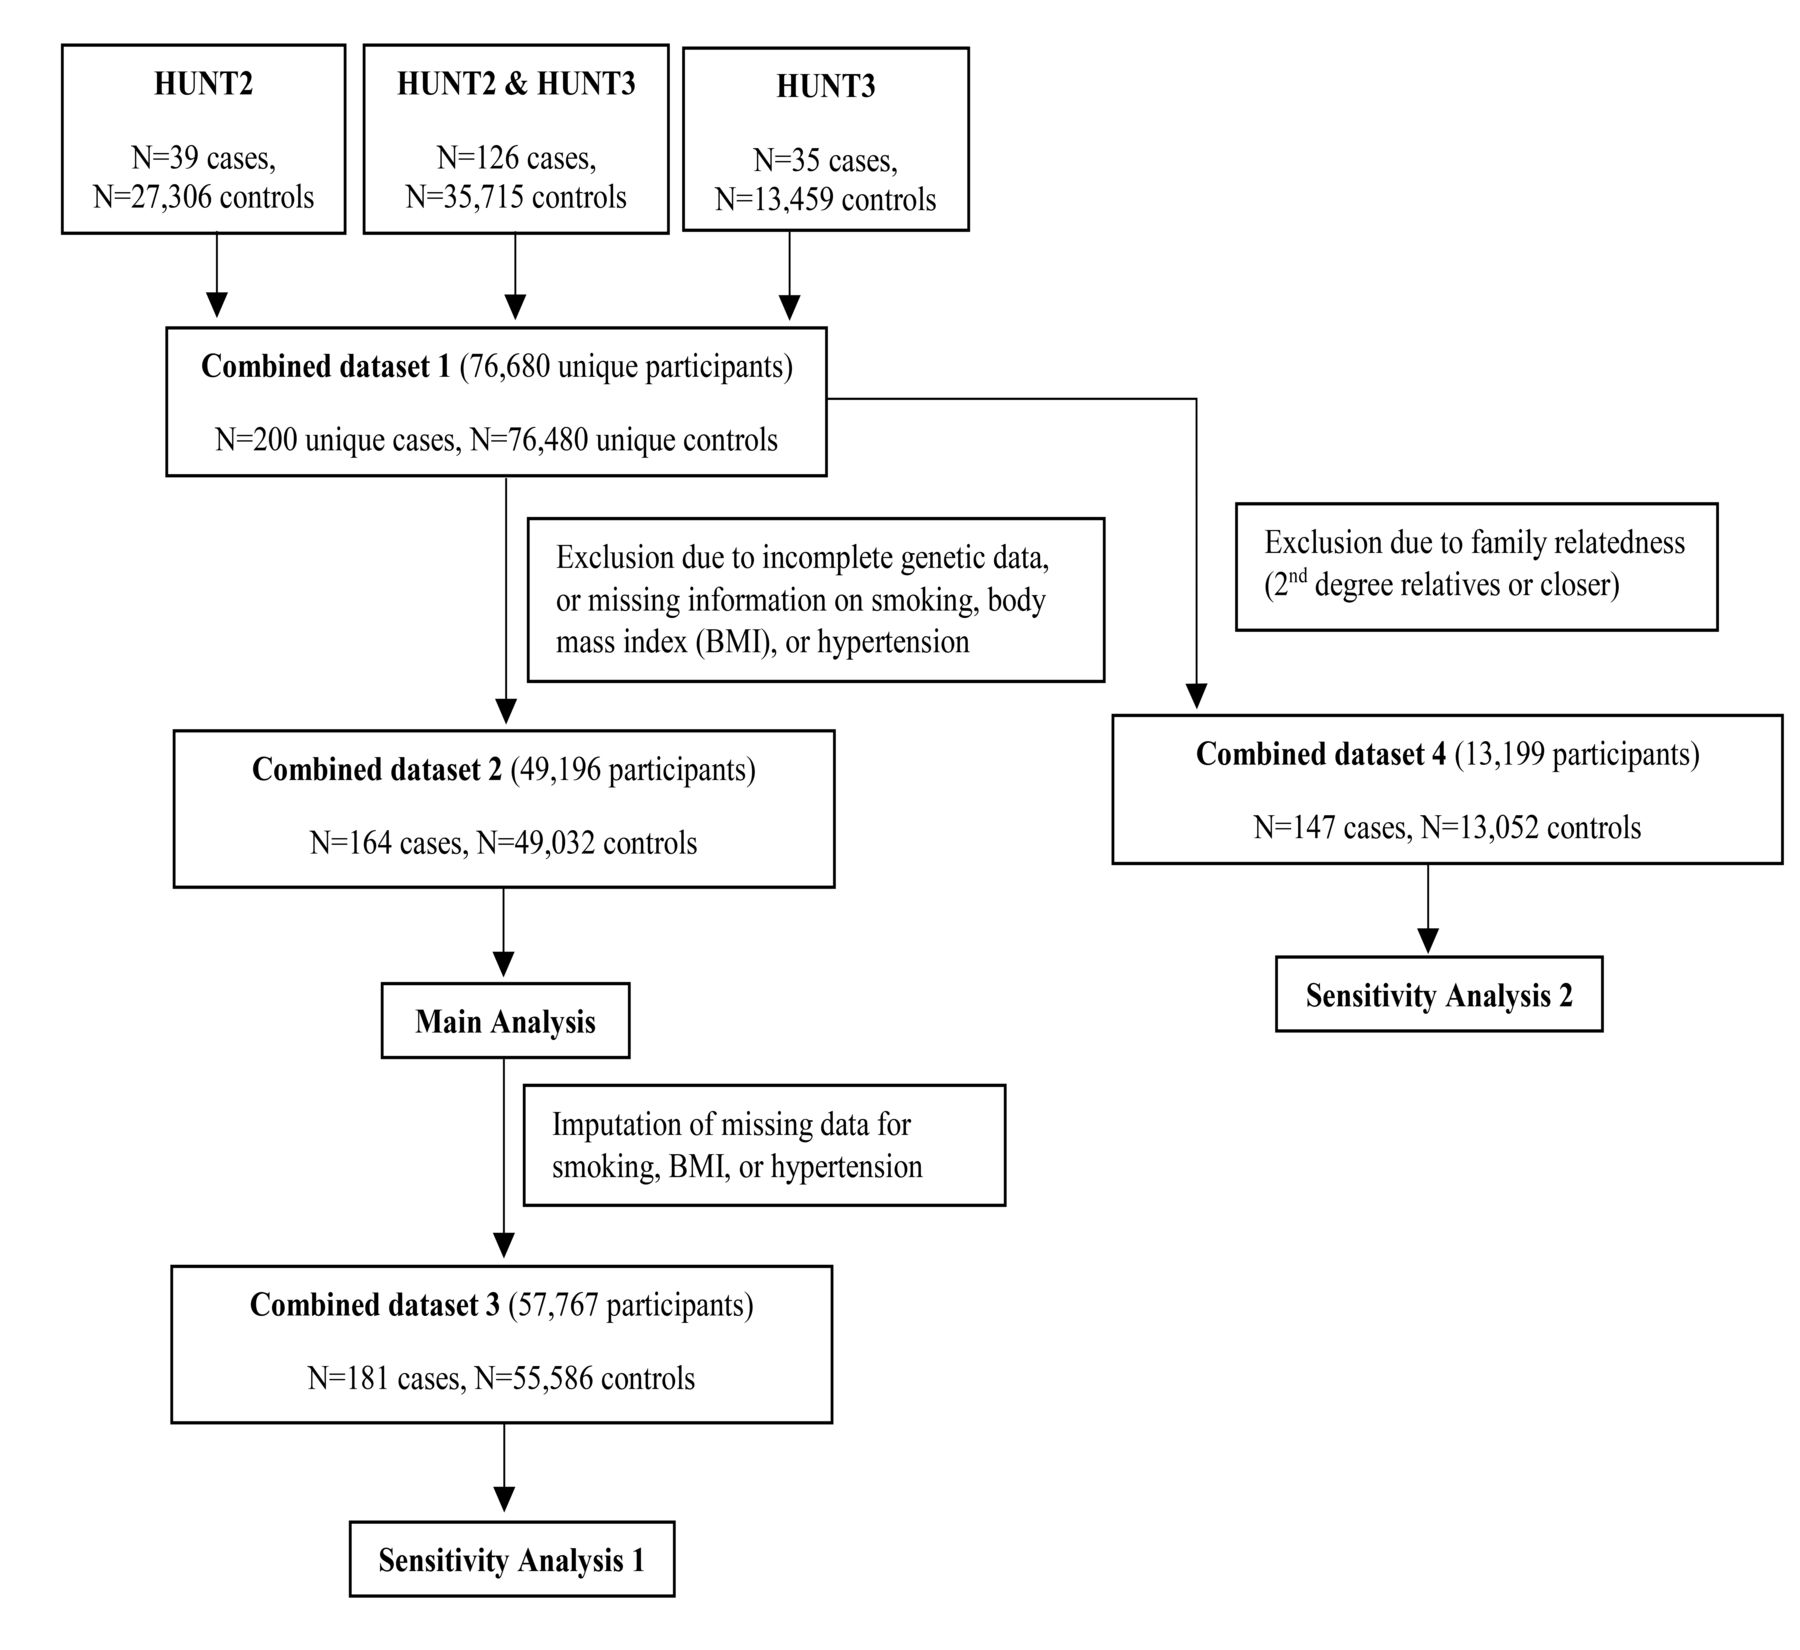
In HUNT, the entire adult population (≥ 20 yrs) of the northern region of Trøndelag (previously, Nord-Trøndelag county) in Norway was invited to participate. Data were collected from participants through questionnaires, interviews, clinical examinations, and blood sampling10. The present study is based on data from the second (HUNT2; 1995–1997) and third (HUNT3; 2006–2008) HUNT surveys10. Figure 1 summarizes the inclusion of participants. AS in HUNT2 and HUNT3 was diagnosed using the modified New York criteria11, as part of the ongoing Hunt Longitudinal Ankylosing spondylitis and Rheumatoid arthritis Study (HuLARS)12. Cases for whom the diagnosis was not reliably established, and those diagnosed with psoriatic arthritis, juvenile inflammatory arthritis, or other inflammatory arthritis were excluded. Some clinical data were not sufficient for an accurate diagnosis of nonradiographic axial SpA, so those cases were excluded, and AS was defined as the phenotype of interest.

Participant inclusion. Inclusion of participants for risk prediction models for ankylosing spondylitis (AS) in the population-based HUNT study in the Nord-Trøndelag area, Norway. HUNT2 and HUNT3 are 2 waves of HUNT, conducted in 1995–1997 and 2006–2008, respectively. HUNT: Nord-Trøndelag Health Study.
The HUNT study was approved by the Regional Committee for Medical and Health Research Ethics (REK), the Norwegian Data Inspectorate, and the National Directorate of Health. All participants gave written informed consent, and the study was performed in accordance with the Helsinki declaration. The HuLARS study was approved by REK (REK Midt 2009/661) and the Norwegian Data Inspectorate.
Genotyping and imputation
SNP analyzed in our study were genotyped using the HumanCoreExome arrays from Illumina Inc. (HumanCoreExome12 v1.0, HumanCoreExome12 v1.1, and UM HUNT Biobank v1.0). Genotyping was performed at the Norwegian University of Science and Technology Genomics core facility in Trondheim. Further details including quality control have been given previously13. Imputation was performed using Minimac3 (v2.0.1, genome.sph.umich.edu/wiki/Minimac3)14. Only samples of recent European ancestry were used, defined as samples falling into an ellipsoid exclusively spanning European populations of the Human Genome Diversity Project reference panel15. A merged reference panel was constructed by combining the Haplotype Reference Consortium panel (release version 1.1)16 and a reference panel from 2202 whole-genome sequenced HUNT study participants.
Risk scores and statistical analysis
Genetic risk variants for AS were identified from English language literature available on PubMed until May 27, 2018, that reported SNP from large case-control studies in whites. Inclusion criteria were that the association to AS was confirmed in a metaanalysis, in several independent studies, or documented both in a discovery and validation cohort. We included the most recent and comprehensive genome-wide association studies (GWAS) metaanalysis for 5 chronic inflammatory diseases including AS7, which used a combination of a subset-based statistical approach to achieve genome-wide significance (p < 5*10−8), and Bonferroni correction for the actual number of linkage disequilibrium–independent markers analyzed. For SNP from other studies, we set the p value for inclusion at p < 5*10−6 and performed a sensitivity analysis using p < 5*10−8. In total, we had access to 148 previously identified susceptibility SNP for AS from 5 studies (Supplementary Data 1, available with the online version of this article). This included 110 SNP from the mentioned GWAS metaanalysis7 (denoted as “GWAS SNP”), and 38 from other studies (denoted as “additional SNP;” Supplementary Data 1). First, the 110 GWAS SNP were used to construct a weighted GRS (wGRS110) by the addition of risk alleles and weighting by the natural logarithm of the published OR, representing each person’s carriage of all risk variants. HLA-B27 carrier state (positive/negative) was not included in the score but was used as a separate variable, based on the genotypes of rs4349859.
Second, an additional wGRS from a reduced set of the additional 38 SNP was constructed (wGRS15; Supplementary Data 1, available with the online version of this article). To this end, linkage disequilibrium was evaluated of those SNP on each chromosome fulfilling the initial p value criterion (p < 5*10−6) using LDlink (analysistools.nci.nih.gov/LDlink). Nineteen SNP closely linked to other SNP (defined as r2 > 0.8) were first removed by the following selection strategy: in case of close linkage of additional SNP with GWAS SNP, the additional SNP were omitted. In case of close linkage among the additional SNP, we kept the nonlinked SNP with the highest OR for the association with AS. The biggest possible SNP set was selected, and finally consisted of 15 SNP that were used to calculate the wGRS15 (Supplementary Data 1, available with the online version of this article). For the sensitivity analysis with a risk score based on genome-wide significance, the same strategy was used and resulted in a selection of 8 SNP that were not closely linked. These were included in the wGRS8. All 3 wGRS were used as continuous variables in logistic regression modeling.
Baseline information on sex, age (age ≤ 30 or > 60 yrs vs age > 30 or ≤ 60 yrs), smoking (current, former, or never smoker), body mass index (BMI), and hypertension was used as adjustment variables in the logistic regression analysis. BMI was calculated as weight (kg)/height (m2). Hypertension was defined as either a “yes” response to the question, “Are you using medication for high blood pressure,” or measurement of systolic blood pressure ≥ 140 mmHg and/or diastolic blood pressure ≥ 90 mmHg. An additional indicator variable denoting whether the individual’s baseline data were recorded at HUNT2 or HUNT3 (i.e., the first of these waves the person participated in) was also included in the models. Linearity of logits was evaluated by plots. The Hosmer-Lemeshow test was used to evaluate model fit, and the area under the receiver-operating characteristics (ROC) curve (AUC) was used to assess discrimination. The Akaike information criterion (AIC) and Bayesian information criterion (BIC) were used to compare the fit of alternative models. For the best model, the point on the ROC curve with the highest sensitivity and specificity was calculated using the Youden index. The sensitivity, specificity, and positive and negative predictive values (PPV and NPV) using this point as a cutoff were then calculated. Data were analyzed using Stata (version 14.1, StataCorp). Data are given as mean ± SD or OR (95% CI) unless otherwise stated. P values < 0.05 were considered statistically significant.
The main analysis was performed on a dataset that was complete for adjustment variables (Figure 1). Several models were constructed: Models 1 and 2 were contained either wGRS110 or HLA-B27 alone, respectively. Model 3 included both wGRS110 and HLA-B27. Models 4 and 5 included wGRS110, HLA-B27, and adjustment variables (sex, age, smoking, BMI, and hypertension), and model 5 further included wGRS15. An alternative model 5 exchanged wGRS15 with wGRS8.
Additionally, 2 sensitivity analyses were performed using a similar modeling approach. The first of these sensitivity analyses was done following multiple imputation of adjustment variables to account for missing data, using chained equations (n = 50 datasets) and assuming missing at random. The second sensitivity analysis was performed after removal of all participants who showed a second degree or closer family relationship (Figure 1) to account for potential relationship bias. In the second sensitivity analysis, kinship coefficients were estimated using the KING method with a cutoff at estimated kinship coefficient 0.0884, which corresponds to the upper bound of second-degree relatives (people.virginia.edu/~wc9c/KING). A set prioritizing AS cases was selected by preferably omitting controls where possible. The final set comprised 147 AS cases and 13,052 controls.
RESULTS
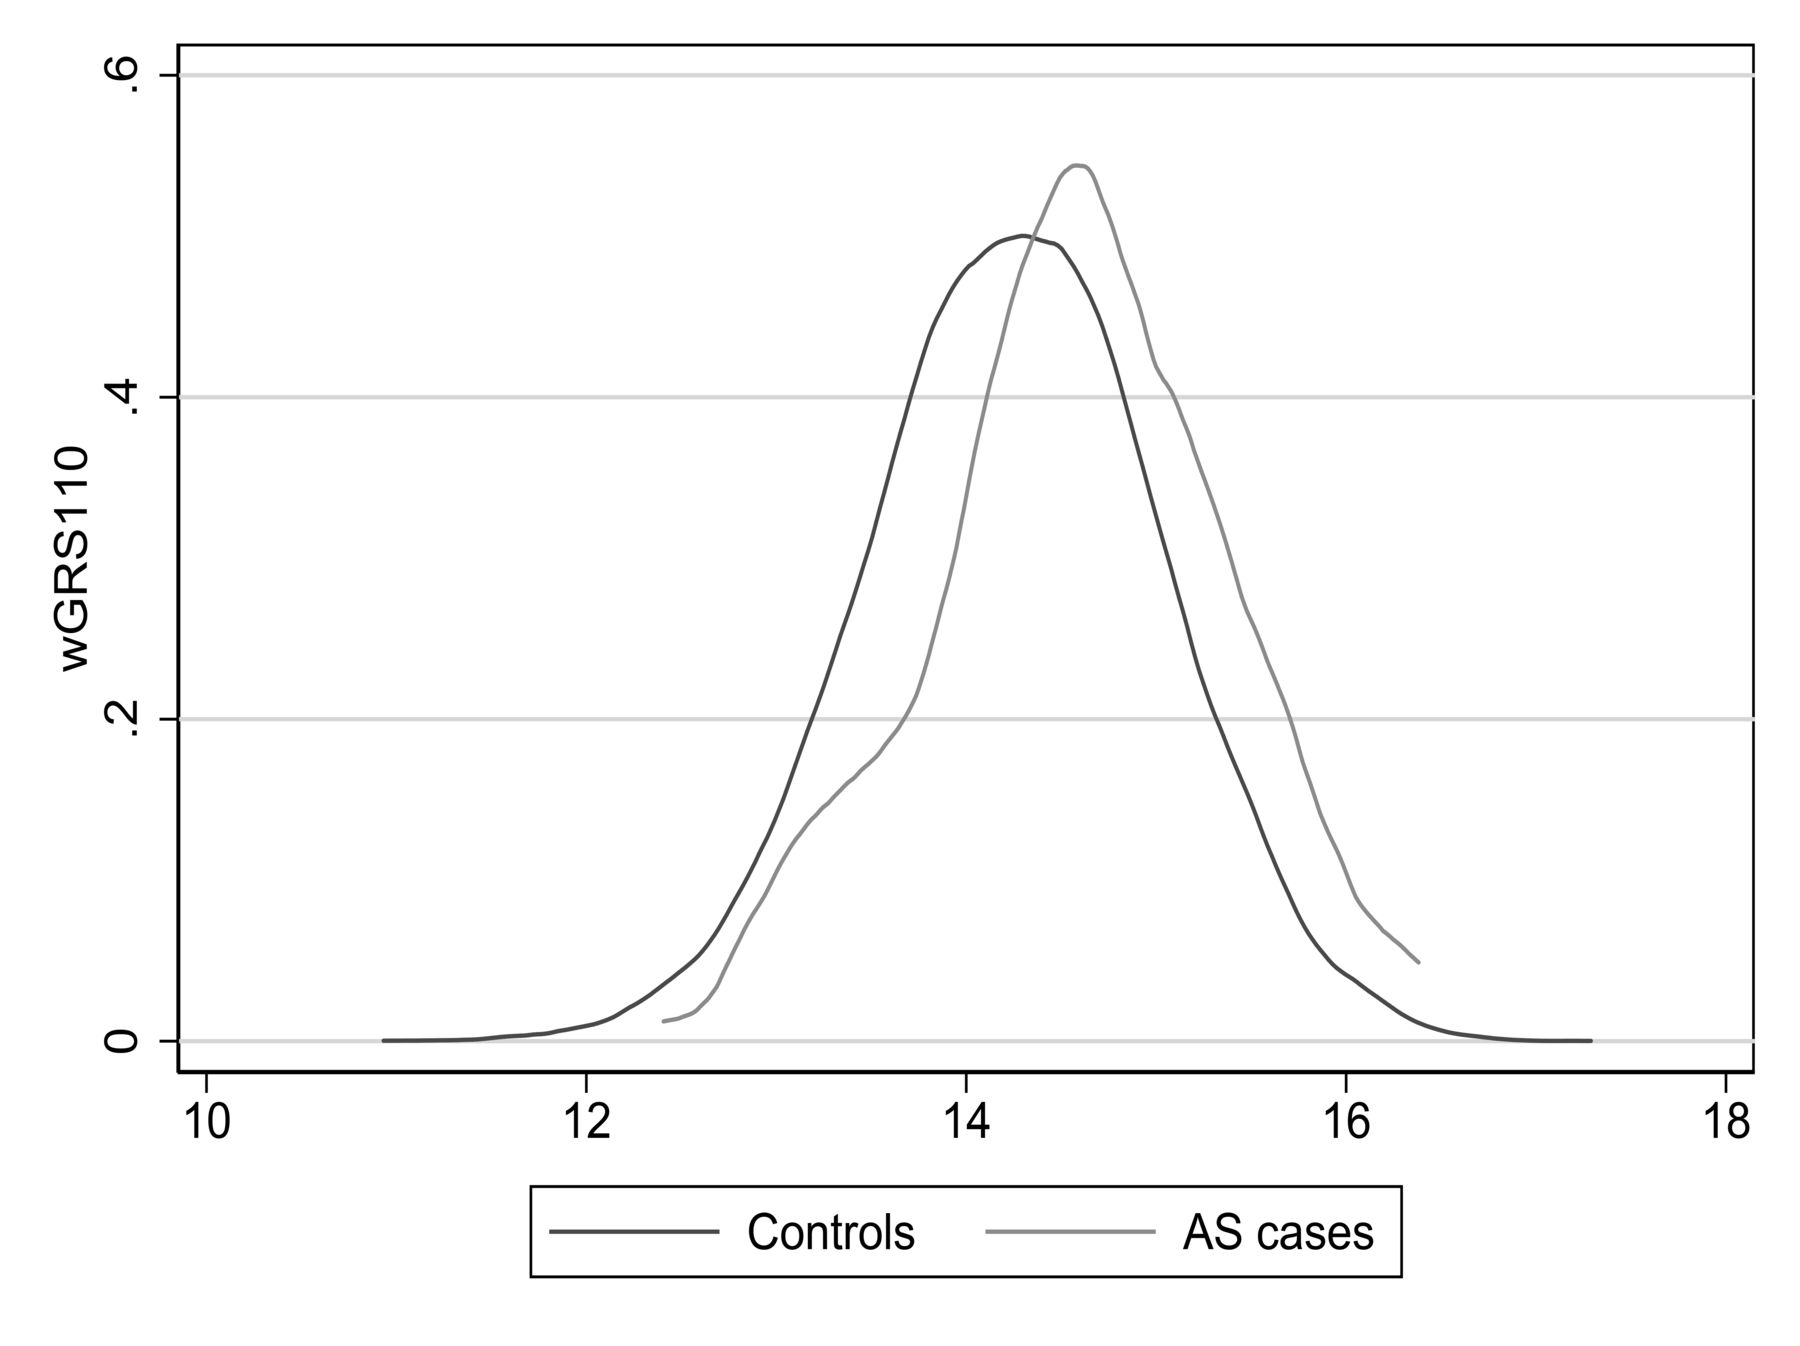
Table 1 summarizes baseline characteristics of the study participants. The wGRS110 ranged from 10.93 to 17.29. The median wGRS110 was 14.60 [interquartile range (IQR) 14.11–15.08] in AS cases and 14.26 (IQR 13.73–14.78) in the controls. There was substantial overlap in the wGRS110 distribution between cases and controls (Figure 2).

Risk score distribution in AS cases and controls. Distributions of weighted genetic risk score based on 110 susceptibility SNP (wGRS110) for AS7. SNP: single-nucleotide polymorphisms; AS: ankylosing spondylitis.
Baseline characteristics of study participants.
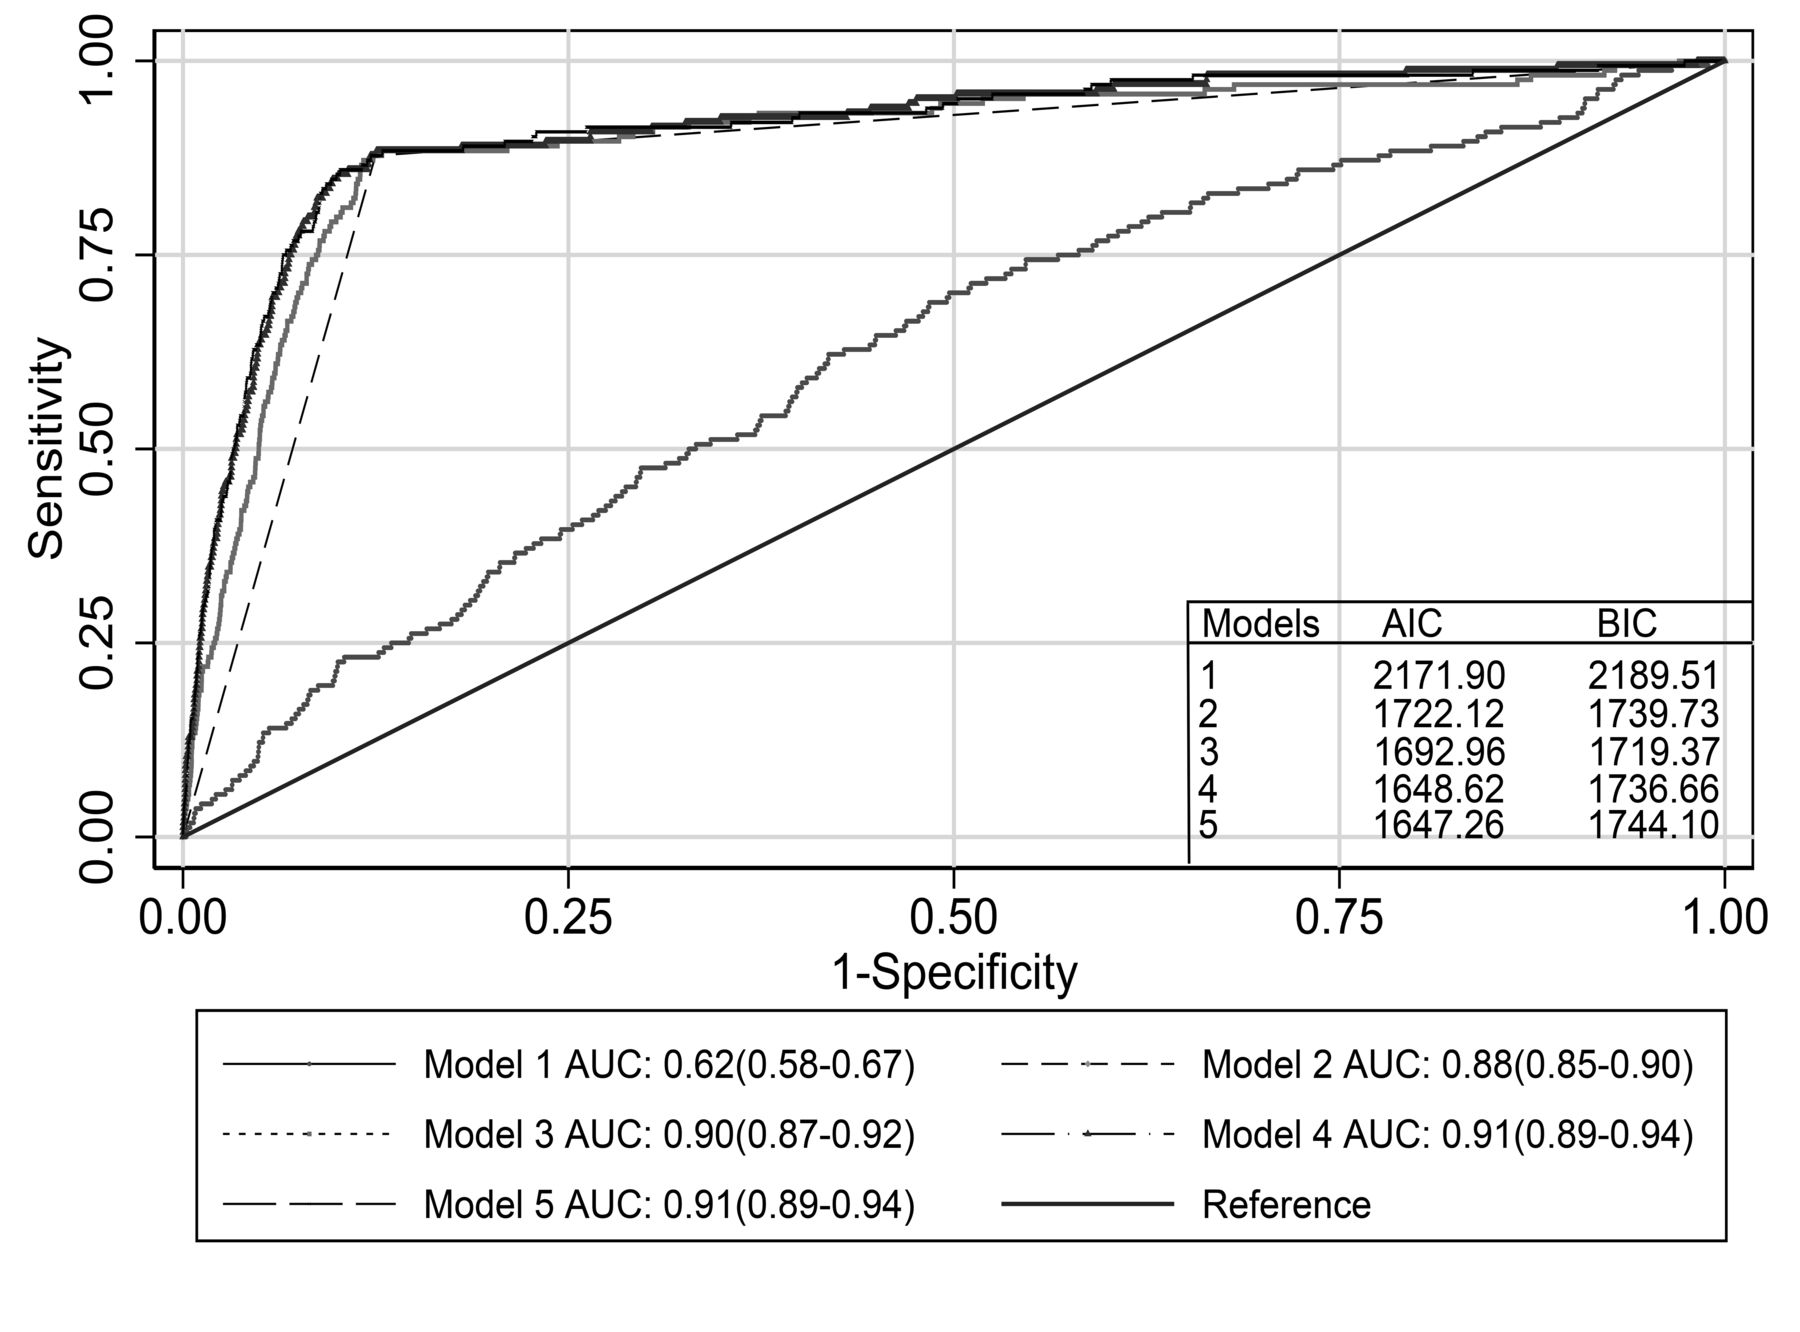
Table 2 summarizes the 5 logistic regression models from the main analysis. The Hosmer-Lemeshow test showed good fit for all models. wGRS110 was significantly associated with AS (model 1, OR 1.7, 95% CI 1.4–2.1 for 1-unit increase, p < 0.001). However, the discriminative ability of this model was low (Figure 3). HLA-B27 showed the highest OR, whether as single explanatory variable (model 2, OR 50, 95% CI 32–81) or with other predictors (models 3–5). All models including HLA-B27 had high discriminatory ability with AUC > 0.88 (Figure 3). The model combining wGRS110 and HLA-B27 (model 3) had a higher AUC compared to the univariate models with either wGRS110 (p < 0.001) or HLA-B27 (p < 0.01). Further inclusion of adjustment variables (age, sex, smoking, BMI, and hypertension) to the model including wGRS110 and HLA-B27 significantly improved the discriminative ability (model 4, p = 0.03 vs model 3). Further addition of wGRS15 to model 4 did not improve the discriminative ability (model 5, p = 0.54 vs model 4; Table 2 and Figure 3). However, wGRS15 was a significant variable when included in models without wGRS110, whether alone (OR 1.64, 95% CI 1.17–2.31) or together with HLA-B27 and the adjustment variables (OR 1.74, 95% CI 1.24–2.46). AIC and BIC values for models 1–5 are summarized in Figure 3. Based on the combined AIC and BIC values, model 4 including wGRS110, HLA-B27, and adjustment variables was the most parsimonious model with best fit. The results were essentially unchanged when wGRS8 (Supplementary Data 1, available with online version of this article) was used instead of wGRS15 (data not shown). When the point on the ROC curve for model 4 with highest sensitivity (88%) and specificity (88%) was used as cutoff for a positive versus negative test for AS, the NPV was 100% and the PPV was 2.3%.

Discrimination by logistic regression models. AUC for 5 models. Model 1: risk score for 110 AS susceptibility SNP (wGRS110) only. Model 2: HLA-B27 (positive/negative) only. Model 3: wGRS110 and HLA-B27. Model 4: wGRS110, HLA-B27, and adjustment variables (age, sex, smoking, body mass index, hypertension). Model 5: wGRS110, HLA-B27, risk score for 15 additional AS susceptibility SNP (wGRS15) and adjustment variables as in model 4. AUC: area under the receiver-operating characteristics curves with 95% CI; AIC: Akaike information criterion; BIC: Bayesian information criterion; SNP: single-nucleotide polymorphisms; AS: ankylosing spondylitis.
Logistic regression models for weighted genetic risk scores (wGRS) for AS*.
After repeating the analyses following imputation of missing data for the adjustment variables in the first sensitivity analysis, most results were very similar (Supplementary Table 1, available with the online version of this article). A notable difference was that wGRS15 was significant when included in model 5 (OR 1.5, 95% CI 1.1–2.1, p = 0.024). Following removal of participants to select a dataset without second degree or closer family relationships in the second sensitivity analysis (n = 13,199), there were very small changes from the original analysis (Supplementary Table 2, available with the online version of this article).
DISCUSSION
In this large population-based study of AS cases and non-AS controls, high discriminatory ability was seen with HLA-B27 and even higher when a wGRS based on most of the currently known risk SNP for AS was also considered. Unsurprisingly, the discriminatory capacity of the wGRS alone was much lower than the HLA-B27 carrier state. Prediction was slightly improved by addition of adjustment variables, reaching an AUC of 0.91 for the multivariable model.
The results are in accordance with the high genetic component of AS development as well as the relative attribution of the known heritability for HLA-B27 and the other previously identified SNP7. In the main analysis, addition of a wGRS based on 15 further validated risk SNP (wGRS15) gave no improvement even if this score was significantly associated with AS as a single predictor. However, in the sensitivity analysis following imputation of missing adjustment variables, wGRS15 gave a significant contribution to overall prediction. This may be due to increased power with inclusion of more AS cases. The study therefore suggests that the large proportion of undetermined genetic risk variants may play a substantial role for prediction. For better prediction, it seems like discovery and inclusion of many more genetic risk variants, or the use of more efficient statistical approaches such as genome-wide risk score development would be necessary. Further, inclusion of information on rare variants, copy number variants, epigenetic factors, other demographic factors, and interaction terms may be required.
A risk score–based predictive model for AS in a South Korean study used HLA-B27, 3 copy number variants, and 1 SNP, and found higher specificity and accuracy compared to the HLA-B27–only model17. The authors reported an AUC of 0.98 and 0.95 for the construction and validation datasets of the final model, respectively. This is higher than for our models. However, the 2 studies have major differences: they are based on populations with different ethnicities (East Asian vs white) with their distinctive genetic compositions, and the studied type of variations differed (copy number variants and SNP). The present study was performed in a population-based setting with a less selected control group, which may reduce bias. We also included a larger number of risk SNP, as well as demographic and clinical data.
A potential source of error in our present study could be kinship among participants. However, there were small changes in the OR after removal of close relatives, demonstrating that kinship had very little effect on the predictive ability of the wGRS. This suggests that even for a disease with substantial heritability, it may not be necessary to account for kinship when testing the predictive ability of a wGRS, and that removal of close relatives may lead to unnecessary loss of cases.
The aim of our study was not to develop a clinical prediction model for AS. Although AUC is a measure of sensitivity and specificity of the disease, the clinical population-level outcome is influenced by the disease prevalence and heritability18. The models in the current study had relatively high AUC of up to 0.91. However, because of the low AS prevalence in Europe4, the current models would not be useful on an individual level because the PPV (i.e., the probability of having AS given a high score) was very low. This is in accordance with a previous study showing that genetic data did not perform better than clinical data in back pain patients with suspected axial SpA19. On the other hand, a negative test based on model 4 had an excellent NPV. Even so, we find that a genetic risk score with a higher PPV should be sought before such a test is included in clinical practice for population screening.
To our knowledge, this is the largest general population-based study yet conducted to test the predictive ability of a genetic risk prediction model for AS in the white population. Several studies have been performed with other aims, among them a prediction of AS radiographic severity20, response to tumor necrosis factor-α blocking therapy in AS21, and prediction of cardiovascular events among those with AS22. The number of AS cases in our cohort was too low to investigate such research questions.
The pathogenesis of AS is still not well elucidated. A previous study from HUNT showed significant associations of present smoking, hypertension, and younger age, but not of BMI, with the incidence of AS23. In our study, inclusion of adjustment variables in addition to HLA-B27 and wGRS110, significantly improved prediction, probably mostly because of statistical adjustment for imbalances in age and sex between cases and controls. The increase in AUC was numerically small, however, again underscoring the importance of the strong genetic component of AS. It would have been interesting to test potential model improvement from inclusion of AS-related variables such as disease activity scores or the patients’ own evaluation. Such variables were not available, and rarely are in a population-based study, especially for controls.
Risk variants found in GWAS are not necessarily causative. Previous research has shown that weighted risk scores are relatively robust to the influence from noncausative SNP, regardless of the strength of linkage disequilibrium they have to causative SNP24. Further, the main aim of risk prediction is to reach a high predictive power, and to increase the validity and robustness of model predictions. This does not necessitate inclusion only of causal associations9.
The study has some limitations. Despite efforts to ascertain the AS diagnoses in HUNT12, there could be false positive or false negative cases, which would reduce predictive accuracy. There is also a potential for selection bias of participants in HUNT. Our models were not validated in another cohort. Further, genetic predictive medicine is in its infancy and has several ethical challenges when used in individuals because of the complicated disease mechanisms. We also cannot exclude that a comparable risk score based on SNP associated with the risk for AS in other populations or ethnicities may perform better owing to different genotype frequencies and phenotypic effect sizes25. The high frequency of women among the new AS cases in HUNT3 may be due to an increased awareness that AS is not only a disease of men, as well as selection bias to HUNT because a relatively lower proportion of the invited young men than young women participated12.
Prediction in a population-based setting based on all currently known AS susceptibility SNP was better than HLA-B27 alone, although the improvement was not major and of uncertain clinical value.
ONLINE SUPPLEMENT
Supplementary material accompanies the online version of this article.
Acknowledgment
The HUNT study is a collaboration between HUNT Research Centre, Faculty of Medicine and Health Sciences, NTNU - Norwegian University of Science and Technology; Nord-Trøndelag County Council; Central Norway Health Authority; and the Norwegian Institute of Public Health. Some results from the present study were presented at the Annual European Congress of Rheumatology — EULAR (June 12–15, 2018; Amsterdam)26.
Footnotes
This study was supported by the Liaison Committee between the Central Norway Regional Health Authority and NTNU (grant 5056/46051000 to VV), and the Research Council of Norway (project 249944 to SR and VV). MAB is supported by a National Health and Medical Research Council Senior Principal Research Fellowship (APP1024879).
- Accepted for publication March 19, 2019.


