

Abstract
Objective. Determinants of radiographic progression in osteoarthritis (OA) are poorly understood. We investigated which features on baseline magnetic resonance imaging (MRI) acted as predictors of change in joint space width (JSW).
Methods. A total of 559 men and women over the age of 50 years with clinical knee OA [Kellgren-Lawrence (KL) grade 2–3] were recruited to the placebo arm of the SEKOIA study (98 centers; 18 countries). Minimal tibiofemoral joint space and KL grade on plain radiograph of the knee were assessed at baseline and at yearly followup up to 3 years. In a subset, serial knee MRI examinations were performed. Individuals with a bone marrow lesion (BML) ≥ grade 2 at the tibiofemoral joint at baseline were classified as BML-positive. Relationships between change in JSW and risk factors were assessed using linear regression.
Results. The mean age of study participants was 62.8 (SD 7.5) years and 73% were female; 38.6% had BML. Mean baseline JSW was 3.65 mm. This reduced by 0.18 (0.30) mm/year in men and 0.13 (0.23) mm/year in women. Those with BML had a significantly higher rate of annualized change in JSW; this relationship remained robust after adjustment for age, sex, and baseline KL grade [β = −0.10 (95% CI −0.18, −0.02) mm/yr]. Age, sex, baseline KL grade, and other MRI findings did not influence the rate of change in JSW.
Conclusion. The rate of change in JSW was similar in men and women. BML on knee MRI predicted the rate of radiographic change in JSW. This relationship was independent of age, sex, and baseline KL grade.
- OSTEOARTHRITIS
- KNEE
- PROGRESSION
- NATURAL HISTORY
- MAGNETIC RESONANCE IMAGING
- RADIOGRAPHIC
- JOINT SPACE NARROWING
Osteoarthritis (OA) is a progressive disease of synovial joints that represents failed repair of damage. It is a substantial public health problem as it is the fifth largest cause of disability in older adults in the US1 and is associated with a huge economic burden. Involvement of large joints of the lower limb, such as the knee, has been shown to significantly affect mobility.
Despite this burden, the natural history of OA is not well understood. Disease progression is a complex process involving the joint structure as a whole, usually occurring slowly and irreversibly over many years. To optimize OA management, it is important to increase our knowledge regarding the predictors of progression, particularly if modifiable. There are few factors conclusively shown to predict progression of knee OA and many studies have provided conflicting results2. The observational literature has suggested the presence of generalized OA is related to faster disease progression3,4. However, body mass index (BMI)3,4,5,6,7, age4,6,7,8,9, and sex3,4,6,7,8,9 have shown inconsistent relationships, although there is evidence the etiology of OA differs in men and women10.
More recently, studies have embarked upon defining the role of magnetic resonance imaging (MRI) both in phenotyping and in predicting progression in OA11, with bone marrow lesions (BML) of particular interest. These are regions of subchondral bone that show ill-defined high signal intensity on fluid-sensitive fat-suppressed spin-echo sequences on MRI12,13, and that histologically correlate with bone marrow edema, fibrosis, necrosis, and trabecular abnormalities14. Studies investigating relationships between BML and clinical symptoms have varied in their conclusions, although some associations between BML and joint pain in knee OA have been identified15,16,17,18,19. Further, longitudinal studies have suggested that their presence may predict progression of cartilage defects20,21,22 and perhaps cartilage loss assessed radiographically. In a study of US veterans with symptomatic knee OA, Felson, et al concluded that bone marrow edema is a potent predictor of radiological progression of knee OA23.
We investigated these possible associations in a second study, which considered determinants of OA progression through assessment of knee joint space width (JSW) at yearly intervals, using the control arm of an international, multi-center, randomized controlled trial of therapy for knee OA.
MATERIALS AND METHODS
Study design and patients
Our study uses data from individuals randomized to the placebo arm of the 3-year SEKOIA trial (n = 559)24. The study was performed in 98 centers in 18 countries, the first patient visit was in early 2006, and recruitment ended in 2008. At inclusion, patients were randomly allocated to 3 treatment groups (strontium ranelate 1 or 2 g/day or placebo), with balanced randomization stratified by center and by sex (block size, 3). Pain score was measured by visual analog scale (VAS); physical activity level was assessed by the question, “Does the patient do regular physical activity?”.
Overall selection criteria included ambulatory white men and women age > 50 years with knee OA as defined by the American College of Rheumatology criteria25; pain on at least half the days in the previous month (intensity ≥ 40 mm on 100-mm VAS); knee Kellgren-Lawrence (KL)26 grade 2 or 3; and JSW between 2.5 and 5 mm with predominant knee OA of the medial tibiofemoral compartment.
Exclusion criteria included recent intraarticular injection (glucocorticoids within last 3 mo or hyaluronic acid within last 6 mo), knee prosthesis, clinical deformities, secondary knee OA, previous treatments acting on cartilage or bone metabolism (e.g., oral or intravenous bisphosphonates within the last year, teriparatide or raloxifene within the last 7 days, and oral glucosamine ≥ 1500 mg/day and chondroitin sulfate within the last 3 mo), and a medical history of or high risk of venous thromboembolism (contraindication for strontium ranelate).
Radiographic measures
Radiographs were obtained at the time of selection and then annually on the target knee, using a standardized technique24. The radiographer recorded a fixed-flexion posteroanterior view (fixed angle 10°), using a SynaFlexerTM positioning frame (Synarc Inc., San Francisco, CA, USA)27. All radiographs were measured centrally (INSERM UMR 1033, Lyon, France) by a single reader blinded to treatment allocation and patient identity. Each blinded post-baseline image was measured in comparison with the inclusion image to optimize reproducibility and sensitivity28,29,30. Minimal JSW (mm) at the medial tibiofemoral compartment was measured using a standardized computer-assisted method31. A second reading was performed by a single reader in another center (Liege, Belgium), independent of the first center, using the same method; interreader reproducibility was excellent [intraclass correlation coefficients (ICC) for joint space width > 0.90]. Intrareader reproducibility was evaluated using ICC at yearly intervals, using 70 knee radiographs unlinked to the study, and was found to be excellent (ICC for joint space width > 0.90)28.
MRI assessment
MRI of the target knee was performed at inclusion at one of 36 validated clinical centers in a subset of patients (n = 176). The MRI scans obtained were read centrally at Synarc, San Francisco, CA, USA, using the whole organ magnetic resonance imaging score32. MRI scans were assessed for the presence of bone marrow edema, cartilage morphology abnormalities, areas of high cartilage signal, cysts, bursae, ligament abnormalities, or osteophytes. Those knees with a BML grade ≥ 2 in any area within the tibiofemoral joint were categorized as BML-positive; this was due in part to the small number of study subjects with a BML grade of 3.
Ethical approval for the study was granted by the ethics committee or institutional review board of every site and all participants gave written informed consent before randomization in accord with the Declaration of Helsinki33.
Statistical analysis
All participants (n = 559) were included in cross-sectional analyses at baseline. Individuals with followup measurements of joint space were included in longitudinal analyses (n = 472). Analyses of BML were limited to the subset of men and women who had undergone MRI scanning. Participants’ continuous characteristics were checked for normality and summarized using means and standard deviations (SD) and counts and percentages were used for binary and categorical characteristics. JSW (mm/year of followup) was calculated for each participant as the difference between last recorded JSW and baseline JSW, divided by the number of years the patient remained within the study. The primary analysis used linear regression to assess the relationship between clinical variables and (1) change in JSW (mm/year of followup) and (2) JSW measurement at baseline. The following risk factors were considered in our analyses: age, sex, BMI, height, weight, smoking status, alcohol use, hand OA, hip OA, and KL grade, as predictors of standardized yearly change in JSW. These analyses were completed in men and women separately and in the cohort as a whole, with and without adjustment for age and sex and mutual adjustment for the other clinical variable (BML or KL grade as appropriate). All analyses were undertaken using Stata 12.
RESULTS
Table 1 shows the descriptive characteristics of the 559 men and women studied. Their mean age was 62.8 (SD 7.5) years and 44% of them were obese; and the median followup duration was 35.5 months (range 0–39.8 mo). Men and women differed significantly in regard to mean age, men being older on average than women; however, men and women had a similar mean BMI at around 29 kg/m2. Physical activity habit, frequency, and hours per week were found not to be significantly associated with progression of OA. Therefore physical activity was not included as a confounder within the analyses.
Demographic population statistics.
Among indices of disease severity, the participants’ mean JSW at baseline was 3.51 (SD 0.83) mm, falling to 3.15 (SD 1.00) mm by the end of the study, with an annualized mean JSW loss of 0.15 (SD 0.26) mm/year. At baseline, women had significantly narrower joint space than men. Of the total study population, 63% were classified with a KL grade 2 and 37% with KL grade 3, with little difference in these proportions between men and women. On MRI, the majority of participants were found to have cartilage morphology and osteophytes; however, no statistical differences were found between MRI characteristics in men or women, as shown in Table 1. Those with MRI scans were found to be taller and slightly older and smoked less; otherwise, demographic characteristics of those within the MRI subpopulation did not differ from those who did not have MRI scans. The baseline BML characteristics of participants are shown in Table 2. Just over one-third (38.6%) of those studied had BML. Age and BMI did not differ significantly by BML status. WOMAC (Western Ontario and McMaster Universities Osteoarthritis Index) scores at baseline were higher in those with BML but, like VAS knee pain scores, did not differ significantly.
Demographic and clinical features of the population by bone marrow lesion (BML) status.
Figure 1 illustrates mean JSW at baseline and each study timepoint according to sex and baseline KL grade. At baseline, men with KL grade 2 had greater JSW (3.98 mm) than women with the same KL grade (JSW 3.11 mm), and the difference was statistically significant. Male JSW remained greater than in women throughout the remaining study timepoints, but the difference was no longer statistically significant by the end of the study. A similar pattern existed in those with KL grade 3: male JSW at baseline (3.72 mm) was greater than that of women with the same KL grade (JSW 2.98 mm) and this pattern continued throughout the study period.

Mean joint space width (mm) and 95% confidence interval over duration of study according to Kellgren and Lawrence grade and sex.
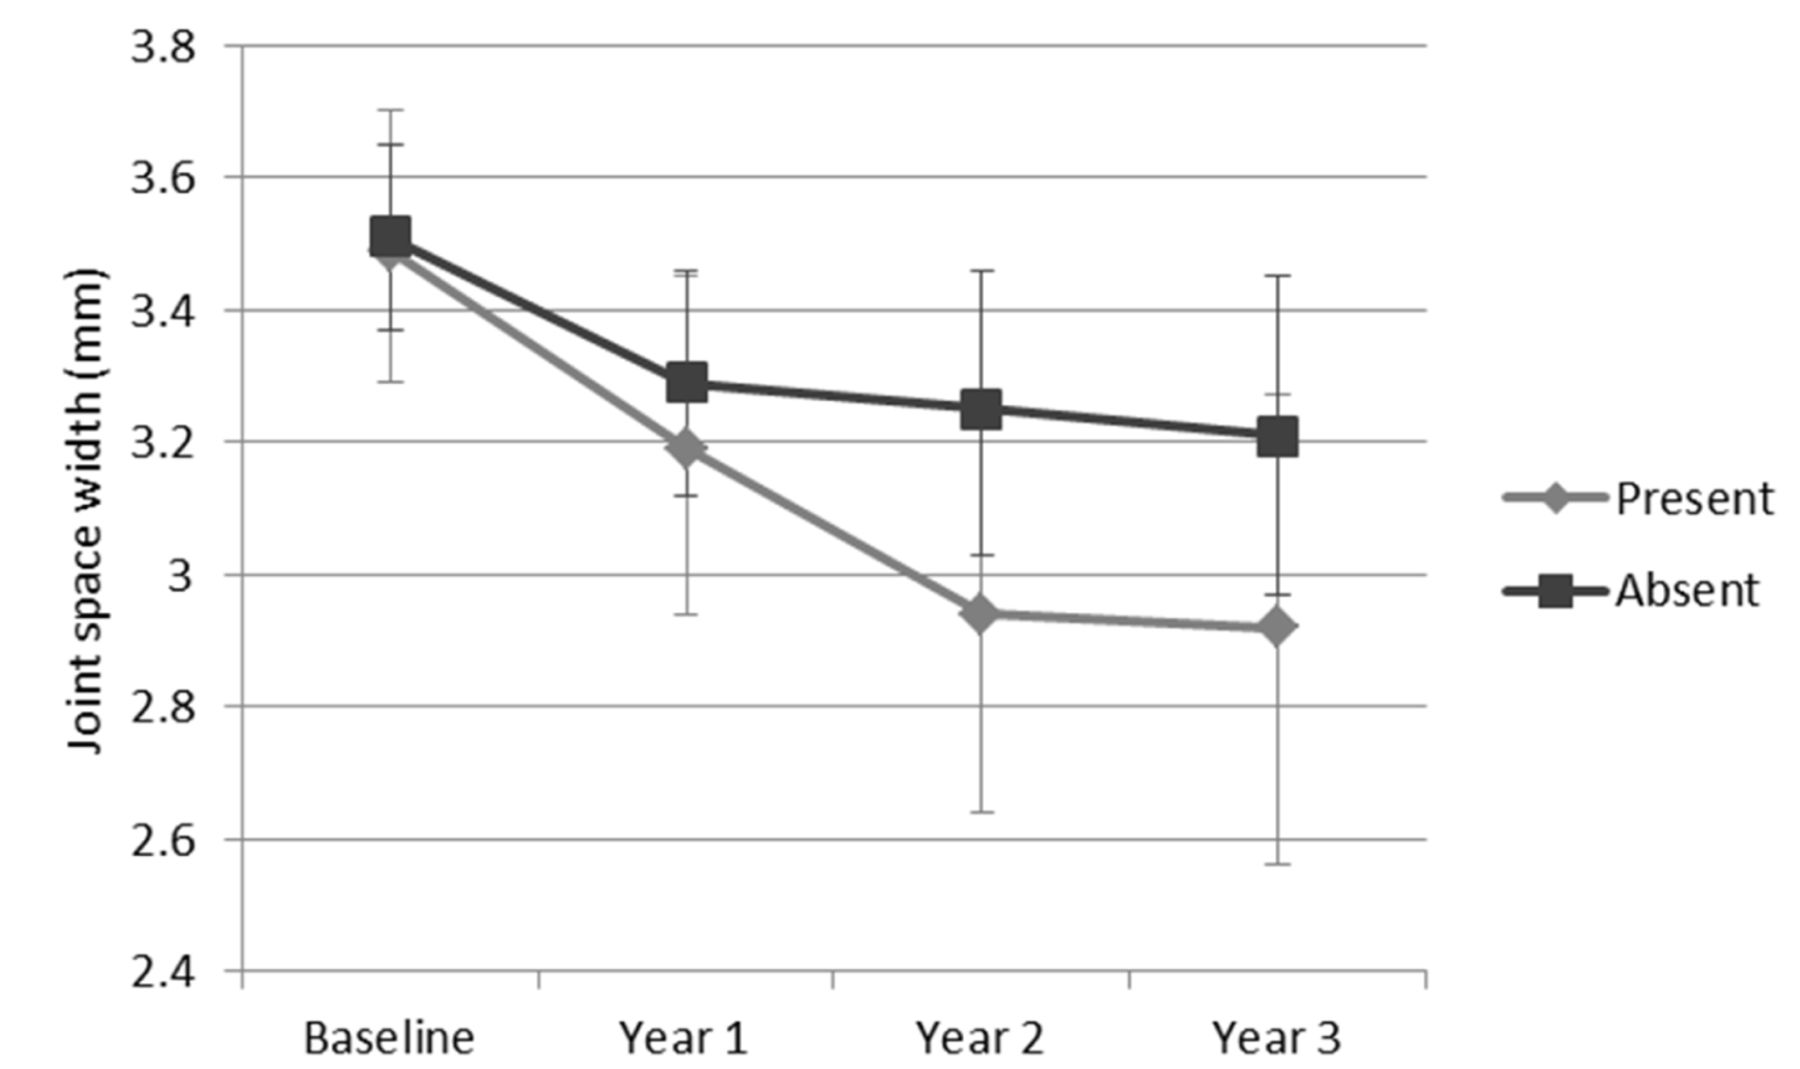
Table 3 presents the results of univariate regression analysis to assess determinants of change in JSW. The only significant determinant of change in JSW per year of followup was the presence of BML at baseline (Figure 2), and no significant relationship between the presence of other MRI findings (cartilage morphology, cartilage signal, cyst bursa, ligament abnormality, or osteophytes) and change in JSW per year of followup was found. Interestingly, when men and women were assessed separately the association was significant only in the men, despite a larger female population in the study sample, suggesting this was not a power issue. No significant association was found between change in JSW per year of followup and baseline age, BMI (including analysis using thresholds > 30 and > 35), KL grade, or baseline VAS pain score. The relationship between change in JSW per year of followup and BML remained statistically significant after adjustment for age, sex, and KL grade [β = −0.10 (95% CI −0.18, −0.02); Table 4]. Therefore those with BML lost on average 0.10 mm per year more JSW than those without BML after other characteristics were accounted for.

Mean joint space width (mm) and 95% confidence interval over duration of the study according to presence of bone marrow lesions.
Univariate associations between joint space variables and clinical features. Values are β (95% CI), with p values.
Associations between joint space variables and clinical features after adjustment for age, sex, and mutual adjustment. Values are β (95% CI), with p values.
DISCUSSION
In this cohort of men and women with symptomatic radiographic OA, the presence of BML, and not other structural abnormalities visible on MRI at baseline, was a predictor of radiographic progression with higher rates of change in JSW. Adjustment for age, sex, and KL grade did not attenuate this finding, but when analyzed separately by sex, this was observed only in men. Conversely, age and BMI did not show predictive value. BML and cartilage abnormalities on MRI were common and prevalence did not differ significantly by sex. It is possible that our positive findings with BML only may reflect the 3-dimensional nature of MRI, in contrast to the 2-dimensional nature of radiographs. While adjustment for multiple testing was undertaken, and raises the possibility of a chance finding, our results are in accord with those in the literature23. The rate of change in JSW was independent of baseline KL score in univariate analyses, with an overall mean rate of change in JSW of 0.15 mm per year. Consequently, JSW remained lower throughout the study in those with the higher KL grade at baseline. Interestingly, JSW was persistently lower in women than men, although this difference reached statistical significance only at baseline in those with a KL score of 2 (Figure 1).
Disease progression in OA can be a slow process. Rate of joint space loss is important in this process and remains a recommended outcome for trials of structure modification34. Over the 3 years of our study, we observed a mean annualized joint space narrowing (JSN) of 0.15 mm. This is in keeping with previous studies of radiographic OA. A review by Emrani and colleagues identified 27 studies that had estimated rates of JSN, all of which were smaller than our current study (between 11 and 312 participants), with comparable mean followup (26 ± 14 mo)35. They found that changes in joint space estimates ranged from an increase of 0.1 mm/year to a decrease of 0.7 mm/year. The mean finding across all studies was 0.13 ± 15 mm/year.
In the Chingford Women’s Study, the natural history of radiographic OA was investigated over 15 years in women aged 44–67 years, although KL grade was used instead of joint space, making comparison with our results more difficult36. On average, 2.3% of women with a baseline KL of 0 or 1 progressed to radiographic OA (KL ≥ 2) per year. Their rates of OA progression were 2.8% per year36. These are similar to results from the Framingham Osteoarthritis Study (4%) and a study by Cooper, et al (3.6%), both of which investigated men and women5,9. Much higher rates were found in a small 12-year Swedish cohort in whom around 8% progressed per year; this equated to all individuals studied progressing during followup37.
Many risk factors for OA progression have been studied, with inconsistent findings. When age was investigated, several studies found no association with rate of progression6,9,38, whereas studies by Miyazaki, et al and Schouten, et al found higher rates of progression in older individuals4,8. Our results are in keeping with the former, providing no evidence for such a relationship.
The findings of studies that investigated sex as a predictor of OA progression are more consistent. Multiple potential OA progression outcomes have been assessed including change in KL grade, JSN, osteophytosis, and sclerosis, with no evidence of a modifying effect of sex3,4,6,7,8,9. We too observed similar patterns of JSN by KL score in men and women (Figure 1). Interestingly, Ledingham and colleagues additionally investigated predictors of change in cyst numbers, and did find the rate was higher in women3. Of note, when we analyzed the relationship between BML and radiographic progression separately by sex, this was significant only in men. The possibility of sexual dimorphism requires replication in other larger samples, but may reflect different pathophysiology in the 2 sexes.
BMI would appear to be a good candidate to promote disease progression in OA. However, results of several studies, including our own, have not borne this out6,8. Cooper, et al5 demonstrated a predictive role for BMI comparing highest and lowest tertiles in a subgroup of individuals with KL ≥ 2, although in those with KL ≥ 1 the relationship was not replicated5. Other investigators have shown associations of borderline significance3,7.
Assessing baseline radiographic severity as a predictor of progression rate, Miyazaki, et al and Pavelka, et al observed no significant association between baseline JSN and OA progression8,39. Further, Bruyere, et al did find a borderline reduction of risk, for JSN of 0.5 mm over 3 years, in those in the lowest quartile for joint space at baseline, but this did not reach statistical significance40. In accord with these findings, our study showed that baseline KL score did not predict rate of JSN in univariate or multivariate analysis (Table 4). We also showed that those with the highest KL scores at baseline maintained the lowest JSW throughout the study (Figure 1). This is commensurate with the work of Wolfe and Lane7, who showed that those with greater baseline disease severity were more likely to progress to the highest severity score of JSN7.
BML, as seen on MRI, provide evidence of bone marrow edema, fibrosis, necrosis, and trabecular abnormalities on histopathologic examination14. We found strong associations between the presence of these lesions and the rate of change of JSW. A similar study to our own by Felson, et al showed analogous results23. Although the age and BMI characteristics of participants were comparable, their study differed in that it included individuals with any KL grade; and progression was defined as an increase in grade of JSN (0–3) in a compartment-specific manner rather than using JSW as a continuous variable for the joint as a whole. Despite these differences of design the findings were very similar, strengthening the likelihood of a true association.
Despite the inconsistent relationship between MRI cartilage morphology and radiographic joint space in OA41, those studies that focused on MRI outcomes rather than radiographic changes have provided useful complementary evidence. A higher baseline BML score has been shown to be associated with greater MRI-defined cartilage loss42,43,44,45, and those in whom the BML progressed were at even higher risk44. Kubota, et al showed that a subgroup with a KL grade of 1 at baseline had larger BML at baseline. However, this was not found in those of KL grade 2 or 346. Further, Kothari, et al47 investigated whether there was localization of both BML and cartilage loss within the same subregions of the joint, as assessed by MRI47. They found that BML predicted greater subregional cartilage loss at the corresponding site after accounting for other co-localized bone lesions, suggesting a direct local effect. The precise mechanism by which BML influence the disease process is not fully understood.
There are limitations to our study. As it was conducted over a large number of centers in many countries, variability may have been introduced. However, a strength of this particular cohort is that it represents the control arm of a randomized controlled trial, with the associated safeguards around methodology and training. Using only the placebo arm of the randomized controlled trial to assess risk factors for progression may have introduced collider bias into the analysis; however, the findings are in keeping with previous literature. The study excluded individuals with KL grade 4 and those receiving drugs that affect cartilage or bone metabolism; this may limit the generalizability of the study results, in particular with regard to the overall descriptive epidemiology of JSN in OA. Individuals without joint pain were also excluded, which might explain the lack of difference in knee pain scores between those with and those without BML at baseline. Further, as with any study of this type, potential causes of radiographic JSN other than cartilage thinning, such as meniscal extrusion, cannot be excluded as causes for the changes that were observed. However, complete meniscal extrusions were noted in only 4 individuals and other MRI findings (cartilage morphology, cartilage signal, cyst bursae, ligament abnormality, and osteophytes) were found not to be univariately associated with JSN. It would have been preferable to use Osteoarthritis Research Society International (OARSI) medial JSN to look at the relationship with (medial) radiographic progression, and to look at results using medial JSN for adjustment rather than KL grade. Unfortunately, OARSI grades were not recorded in this study. Finally, we were unable to consider a large number of determinants of progression in our models; specifically, more detailed information about fat mass and fat distribution would have been interesting to consider, but was unavailable in this cohort.
We observed an average rate of JSN in individuals with symptomatic radiographic OA of 0.15 mm/year, consistent with the literature. Age, sex, and BMI did not significantly influence the disease course, whereas BML, which were common in our cohort, were the only baseline MRI finding associated with more rapid radiographic deterioration. This is commensurate with studies of predictors of MRI-assessed cartilage loss and may highlight an important factor in the pathogenesis of OA disease progression. However, there is insufficient evidence to suggest that a treatment targeting these lesions would ameliorate cartilage loss.
Acknowledgment
We acknowledge the directors and personnel of the 23 investigating centers and all members of the SEKOIA management team.
APPENDIX 1
List of study collaborators. SEKOIA Study Group: Executive Committee: J-Y. Reginster (Chair), C. Cooper (International Coordinator), C. Christiansen, P. Delmas (deceased July 2008), R. Chapurlat (from 2008 onward), H. Genant, J. Zacher, N. Bellamy. Steering Committee: C. Cooper (International Coordination, Chair), National Coordinators (see below), and representatives from the central reading centers. Safety Committee: C. Speirs, G. Bréart, O. Meyer. Central Reading Centre (Lyon): D. Gensburger, M. Arlot, J-P. Roux, R. Chapurlat. Central Reading Centre (Liege): R. Deroisy, O. Bruyère, J-Y. Reginster. National Coordinators: P. Sambrook (Australia), B. Leeb (Austria), A. Verbruggen (Belgium), W. Bensen (Canada), T. Hala (Czech Republic), M. Holm-Bentzen (Denmark), I. Valter (Estonia), X. Chevalier (France), B. Swoboda (Germany), S. Adami (Italy), M. Kloppenburg (The Netherlands), E. Grazuleviciute (Lithuania), J. Badurski (Poland), J. Branco (Portugal), E. Nasonov (Russia), F. Navarro (Spain), T. Spector (UK). Investigators: Australia: L. Barnsley, S. Hall, G. Jones, A. Klestov, L. March, P. Nash, E. Romas, R. Will; Austria: L. Erlacher, F.B. Leeb, H. Resch, F. Rainer, O. Zamani; Belgium: T. Appelboom, J.P. Devogelaer, A. Kvasz, F. Raeman, A. Verbruggen; Canada: A.D. Beaulieu, W.G. Bensen, J. Brown, A.A. Cividino, F. Morin, W.P. Olszynski, J.P. Raynauld, J.C. Thorne; Czech Republic: T. Hala, K. Pavelka; Denmark: P. Alexandersen, H.C. Hoeck, M. Holm-Bentzen, P. Lundqvist; Estonia: I. Valter; France: L. Aim, P. Audouy, P. Beaunier, C.L. Benhamou, F. Berenbaum, E. Chabaud, D. Chalet, X. Chevalier, M. Cohen-Solal, D. Delbecq, L. Euller-Ziegler, P. Fardellone, P. Hilliquin, E. Jacquety, N. Jude, D. Lechevalier, J.C. Mouchet, P. Richette, E. de Sainte Lorette, T. Schaeverbeke, A. Sebbah, E. Vignot; Germany: T. Brabant, G.R. Burmester, J. Grifka, P.E.M. Müller, B. Swoboda, J. Zacher; Italy: S. Adami, G. Bianchi, W. Grassi, L. Di Matteo, V. Modena, O. Di Munno, S. Ortolani, L. Punzi, M. Zangari; Lithuania: E. Grazuleviciute; Netherlands: M. Kloppenburg, L.D. Roorda, P.L.C.M. Van Riel; Poland: J. Badurski, E. Czerwinski, A. Gorecki, W. Tlustochowicz; Portugal: J. Branco, J. Canas Da Silva, J.A. Melo Gomes, L.M. Miranda; Romania: F. Radulescu; Russian Federation: L.I. Alexeeva, A.V. Orlov-Morozov, E.G. Pikhlak, V.G. Pilyaev, N.A. Shostak, E.I. Shmidt, N.V. Zagorodniy; Spain: L. Arboleya Rodríguez, P. Benito Ruiz, E. Chamizo Carmona, E. Collantes Estévez, G. Herrero-Beaumont, E. Martín Mola, A. Moreno, A. Naranjo Hernández, F. Navarro Sarabia, J.M. Padrino, C. Palacios, A. Rodríguez de la Serna, J.A. Román Ivorra, A. Torrijos; United Kingdom: E. Abdulhakim, N. Arden, F. Birrell, H. Donnachie, W. Fraser, R. Keen, R. Sarmiento, M.D. Stone.
Footnotes
C. Parsons and Dr. Edwards are joint first authors of this report.
Supported by the Medical Research Council of Great Britain; Arthritis Research UK; and the International Osteoporosis Foundation; and by the National Institute of Health Research Nutrition Biomedical Research Centre, University of Southampton and the National Institute of Health Research Musculoskeletal Biomedical Research Unit, University of Oxford. Dr. Edwards is supported by an Arthritis Research UK Clinical PhD Studentship.
- Accepted for publication September 11, 2015.


