

Abstract
Objective. To develop a genotype-based ankylosing spondylitis (AS) risk prediction model that is more sensitive and specific than HLA-B27 typing.
Methods. To develop the AS genetic risk scoring (AS-GRS) model, 648 individuals (285 cases and 363 controls) were examined for 5 copy number variants (CNV), 7 single-nucleotide polymorphisms (SNP), and an HLA-B27 marker by TaqMan assays. The AS-GRS model was developed using logistic regression and validated with a larger independent set (576 cases and 680 controls).
Results. Through logistic regression, we built the AS-GRS model consisting of 5 genetic components: HLA-B27, 3 CNV (1q32.2, 13q13.1, and 16p13.3), and 1 SNP (rs10865331). All significant associations of genetic factors in the model were replicated in the independent validation set. The discriminative ability of the AS-GRS model measured by the area under the curve was excellent: 0.976 (95% CI 0.96–0.99) in the model construction set and 0.951 (95% CI 0.94–0.96) in the validation set. The AS-GRS model showed higher specificity and accuracy than the HLA-B27–only model when the sensitivity was set to over 94%. When we categorized the individuals into quartiles based on the AS-GRS scores, OR of the 4 groups (low, intermediate-1, intermediate-2, and high risk) showed an increasing trend with the AS-GRS scores (r2 = 0.950) and the highest risk group showed a 494× higher risk of AS than the lowest risk group (95% CI 237.3–1029.1).
Conclusion. Our AS-GRS could be used to identify individuals at high risk for AS before major symptoms appear, which may improve the prognosis for them through early treatment.
- ANKYLOSING SPONDYLITIS
- COPY NUMBER VARIATION
- SINGLE-NUCLEOTIDE POLYMORPHISM
- HLA-B27
- GENETIC RISK SCORING
Ankylosing spondylitis (AS) is a chronic inflammatory arthritis that chiefly affects the spine and sacroiliac joints. It usually affects young people and at least 30% of patients develop severe spinal restriction1. In spite of its clinical severity, treatment options are still limited. Nonsteroidal antiinflammatory drugs (NSAID) and physiotherapy are effective in controlling symptoms, but about 20%–50% of patients with AS still have active disease despite NSAID treatment2. The advent of tumor necrosis factor-α (TNF-α) inhibitors was a breakthrough for the patients who were resistant to NSAID treatment3. It has been proven that TNF-α inhibitors can successfully slow disease progression and the treatment is more effective if it is started earlier in the course of the disease2,3,4. Rudwaleit, et al demonstrated that early-stage patients showed a higher rate of remission5. All the evidence confirms the importance of early diagnosis and treatment before radiological changes appear. However, because of the long latency period between the first symptom and radiological changes, current diagnosis criteria based on radiological changes may not be ideal for early treatment2.
Early diagnosis of AS will allow initiation of treatment with TNF-α inhibitors at a time when greater benefits may be realized5,6. Although there is no doubt that HLA-B27 is the strongest genetic factor of AS, only a small proportion (< 5%) of HLA-B27–positive individuals actually develop AS. Therefore, an HLA-B27 test alone is not appropriate at all for the prediction of AS development7. Although new scoring criteria, which combine HLA-B27 and key clinical variables such as inflammatory back pain, have been suggested and used to facilitate early recognition of patients with AS4,5,6,7, early diagnosis of AS is still challenging.
Genome-wide association studies (GWAS) of single-nucleotide polymorphisms (SNP) have identified non-MHC genes associated with AS, such as IL-23R, ERAP1, IL1R2, and ANTXR28,9,10,11. In our previous GWAS of copy number variants (CNV) with 934 Korean patients with AS and 1200 control individuals, we identified 5 risk-increasing CNV12. We also replicated the associations of the SNP in the ERAP1 gene and in 2p15 with AS13,14, which had been reported to be associated with AS in East Asian patients by GWAS15,16. However, despite the identification of the various genetic loci associated with AS, clinic-friendly genetic testing tools for early diagnosis or prediction of prognosis are yet to be developed.
In our study, we aimed to develop a genotype-based AS risk prediction model that has better sensitivity and specificity than the HLA-B27–only model. For this we built a logistic regression model that combined the CNV and SNP identified in Koreans together with HLA-B27.
MATERIALS AND METHODS
Study subjects
A total of 1904 individuals (861 patients with AS and 1043 healthy controls) were enrolled in our study. Among them, 285 patients and 363 controls were from our previous study sets12. Other subjects (576 AS and 680 controls) were newly recruited as an independent validation set from Seoul St. Mary’s Hospital (Seoul, South Korea), Hanyang University Hospital for Rheumatic Diseases (Seoul, South Korea), and Chungnam University Hospital (Daejeon, South Korea). All AS cases were diagnosed according to the modified New York criteria17. The general characteristics of the study subjects are summarized in Supplementary Data 1 (available online at jrheum.org). This study was performed under the approval of the institutional review board of the Catholic University of Korea College of Medicine (CUMC10U170). All participants gave written informed consent.
SNP genotyping
The TaqMan genotyping assay (Life Technologies) was used to genotype HLA-B27 and 7 SNP associated with the risk of AS (rs10865331, rs27044, rs27434, rs27037, rs30187, rs17482078, rs10050860)18. Genotyping PCR was performed using the Viia7 system (Life Technologies) according to the manufacturer’s instruction. Genotypes were determined using the Viia7 software 1.1 (Life Technologies). The dominant model was used to test for SNP association.
CNV typing
Genomic quantitative PCR was used to evaluate the copy number status of the 5 CNV loci that were previously reported to be nominally or suggestively significantly associated with an increased risk of AS: 1q32.2 (HHAT), 2q31.2 (PRKRA), 6p21.32 (HLA-DPB1), 13q13.1 (EEF1DP3), and 16p13.3, using the Viia7 system with TaqMan CNV probes (Life Technologies) as described elsewhere12. The NA10851 DNA was used as calibrator and the RNase P gene was used as endogenous control. The relative copy number was estimated using the Copy Caller Software V2.0 (Life Technologies).
Design of AS genetic risk scoring (AS-GRS) model
Categorical variables were compared using the chi-square test. Five CNV, 7 SNP, and an HLA-B27 marker were used for developing the AS-GRS model. The AS-GRS model was built using logistic regression analysis with backward selection19. For this, the CNV, SNP, and HLA-B27 factor were coded as 0 or 1 based on their status: 1 was assigned to copy number loss for each CNV, to risk allele for each SNP, and to HLA-B27–positive, and 0 to no copy number loss, to non-risk allele for each SNP, and to HLA-B27–negative. Each factor was weighted using the natural logarithm of its OR. The receiver-operating characteristic curve and the area under the curve (AUC) were used to assess the predictive value of AS-GRS. Statistical analyses were performed using SPSS (version 18) and p values < 0.05 were considered significant in all statistical analyses.
RESULTS
To develop the AS-GRS model, 648 individuals (285 AS cases and 363 controls) from our previous AS samples12 whose genomic DNA were available for genotyping were examined for 5 CNV, 7 SNP, and a HLA-B27 marker. In this step, to enhance the clinical applicability, we solely used the TaqMan assays for all markers. Overall strategy is illustrated in Figure 1. The patients were (mean ± SD) 23.4 ± 8.6 years old, 89.1% were men, and 95.8% were positive for HLA-B27, and the controls were 32.4 ± 10.3 years old and 78.8% were men (Supplementary Data 1, available online at jrheum.org). To validate the accuracy of TaqMan CNV genotyping, we compared the TaqMan assay results with 2 known CNV genotyping data samples (1q32.2 and 13q13.1), which were confirmed by DNA sequencing followed by deletion-typing PCR12. In total, 98.6% of TaqMan results were consistent with previously confirmed CNV profiles (Supplementary Data 2, available online at jrheum.org). The frequency distributions of each CNV, SNP, HLA-B27 marker, and SNP genotype of each individual are available in Supplementary Data 3 and Supplementary Data 4 (available online at jrheum.org). In univariate analysis, individuals positive for these markers showed significantly higher risks of AS than those negative for these markers: HLA-B27 (OR 321.3, 95% CI 157.8–654.3), 1q32.2 deletion (OR 4.0, 95% CI 2.9–5.6), 2q31.2 deletion (OR 3.0, 95% CI 2.2–4.2), 13q13.1 deletion (OR 4.1, 95% CI 2.9–5.7), 16p13.3 deletion (OR 3.1, 95% CI 1.7–5.7), and the risk allele of rs10865331 (OR 3.5, 95% CI 2.5–5.0; Table 1). Especially among the 7 SNP candidates, the rs10865331 was significantly associated with the AS risk not only in a dominant model, but also in allelic, recessive, and genotypic models (Supplementary Data 5, available online at jrheum.org). Through the logistic regression analysis with backward selection, we developed the AS-GRS model consisting of the 5 genetic components: HLA-B27, 3 CNV (1q32.2, 13q13.1, and 16p13.3), and 1 SNP (rs10865331; Figure 1). The equation of AS-GRS model is as follows:


The schematic flow from AS-GRS model construction to validation. In brief, 648 individuals (285 AS cases and 363 controls) from our previous AS samples11, whose genomic DNA were available for TaqMan CNV and SNP genotyping assay, were examined for 5 CNV, 7 SNP, and an HLA-B27 marker. Among the 5 CNV, 1 TaqMan probe for 6p21.32 did not work properly because of the presence of repetitive sequences or other unknown factors. The AS-GRS was developed by identifying independent variables using logistic regression analysis with backward selection. The AS-GRS was validated with a larger independent set of AS and controls (1256 individuals; 576 AS cases and 680 controls). The ROC curve and area under the curve were used to assess the predictive value of AS-GRS. AS: ankylosing spondylitis; AS-GRS: AS genetic risk scoring; CNV: copy number variants; SNP: single-nucleotide polymorphism; ROC: receiver-operating characteristic.
The association of each genetic variant with the AS risk.
A nonsignificant result on the Hosmer-Lemeshow test indicated a good fit of the AS-GRS model (p = 0.711).
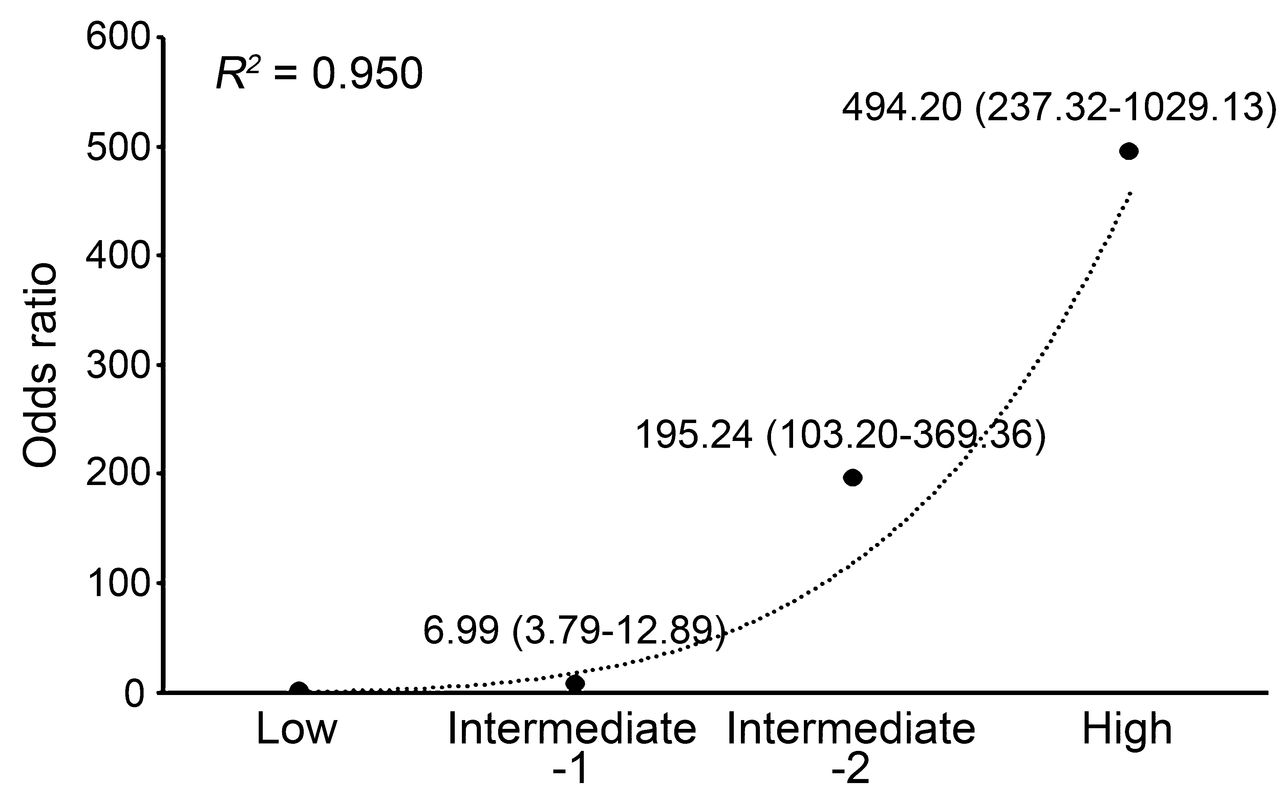
We validated this AS-GRS model with a larger independent set of AS cases and controls (1256 individuals: 576 cases and 680 controls). The patients were 28.7 ± 11.5 years old, 85.8% were men, and 92.9% were positive for HLA-B27, and the controls were 24.3 ± 14.7 years old and 85.0% were men (Supplementary Data 1, available online at jrheum.org). The ages of diagnosis were significantly older in the validation set compared with the model construction set (p < 0.05). Univariate analysis with the independent set showed that all significant associations of genetic factors in the model construction set were successfully replicated and the directions of their OR were the same as those in the model construction set (Table 1). Logistic regression also demonstrated that all of them were good predictors of AS (Supplementary Data 6, available online at jrheum.org). The discriminative ability of the AS-GRS model measured by the AUC was highly reliable: 0.976 (95% CI 0.96–0.99) in the model construction set and 0.951 (95% CI 0.94–0.96) in the independent validation set (Table 2). Histograms showing the fractions of patients with AS and controls by AS-GRS value in both construction and independent validation sets also showed distinct patterns for cases and controls (Supplementary Data 7, available online at jrheum.org). Moreover, the discriminative ability of the AS-GRS model was significantly higher than the HLA-B27 model in both the model construction set (AUC 0.976 vs 0.964, p = 0.032) and the validation set (AUC 0.951 vs 0.917, p < 0.001). Of note, the AS-GRS model showed higher specificity and accuracy compared with the HLA-B27 model when the sensitivity was set to be over 94% (Figure 2). For example, when the sensitivity threshold was set to 94% in both models, the specificity and accuracy were 86% and 90% in the AS-GRS model, whereas only 49% and 69% in the HLA-B27 model. These gaps increased as the sensitivity increased (Figure 2). Estimations of sensitivity, specificity, and accuracy for the AS-GRS and HLA-B27 models at specified thresholds are summarized in Table 3. When we categorized the independent validation set into quartiles based on the AS-GRS scores, OR of the 4 groups (low, intermediate-1, intermediate-2, and high risk groups) showed an increasing trend with the scores (r2 = 0.950; Figure 3). The high-risk group showed a 494× higher risk of AS compared with the low-risk group (95% CI 237.3–1029.1).
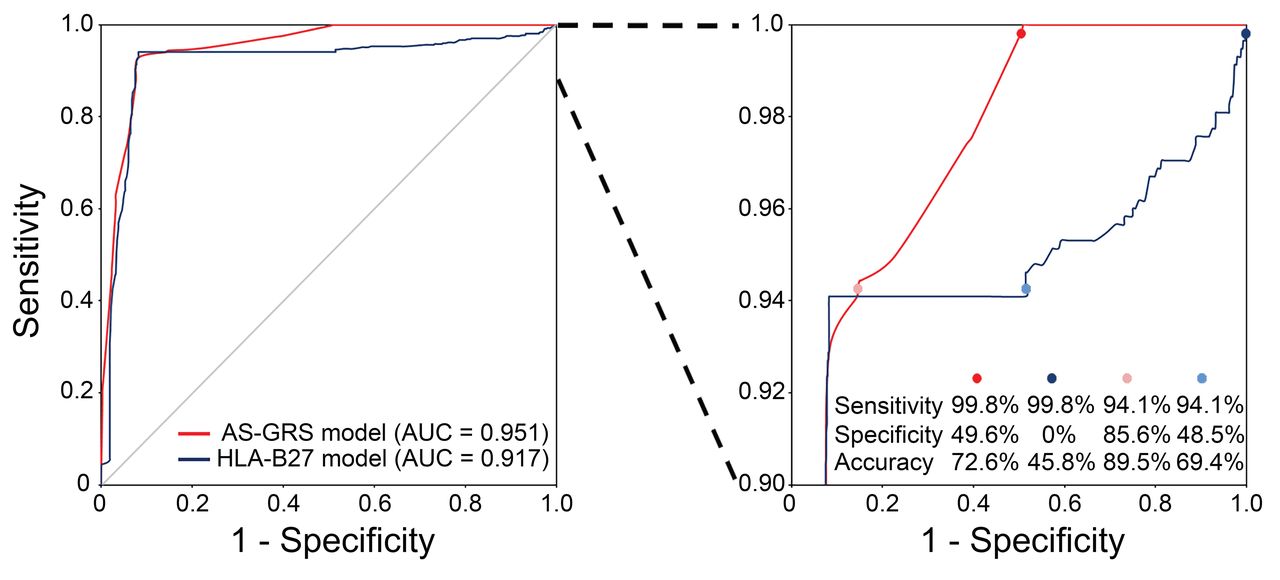
Receiver-operating characteristic curves for the AS-GRS and HLA-B27 models. Left: red and blue lines represent the AS-GRS and HLA-B27 models, respectively. Right: same data are shown with > 90% sensitivity. AS-GRS: ankylosing spondylitis genetic risk scoring; AUC: area under the curve.

A trend of OR for ankylosing spondylitis by AS-GRS score. OR of 4 risk groups based on the AS-GRS score (low, intermediate-1, intermediate-2, and high risk groups) were estimated relative to the lowest score group. AS-GRS: ankylosing spondylitis genetic risk scoring.
Discriminative abilities by model.
Specificity, accuracy, and threshold at specified sensitivity by model.
In the AS-GRS model construction and the validation sets, 888 individuals (808 AS and 80 controls) were HLA-B27–positive. In this subset, the sensitivity and specificity of the HLA-B27 marker is 100% and 0%, respectively. When we applied the AS-GRS model to them, its AUC was 0.709 (95% CI 0.66–0.76), which was significantly higher than that of the HLA-B27 model (AUC 0.609, 95% CI 0.54–0.68, p = 0.025; Supplementary Data 8, available online at jrheum.org). The sensitivity, specificity, and accuracy of the AS-GRS model were 80%, 46%, and 77%, respectively, based on the threshold being set at the first quartile.
DISCUSSION
Although HLA-B27 is the strongest genetic factor of AS, HLA-B27 testing is limited in predicting development of AS or to diagnose in early stage before major symptoms appear because of its low positive predictive value20. In our study, we aimed to develop a genotype-based AS risk prediction model by combining AS-associated CNV, SNP, and HLA-B27. This combination is more sensitive and more specific than HLA-B27–only typing. Indeed, our AS risk prediction model, AS-GRS, consisting of HLA-B27, SNP, and CNV, has a much-improved predictive ability compared with the HLA-B27 model. The AS-GRS model also showed higher sensitivity and specificity in a subset of the HLA-B27–positive individuals. In the independent validation set, individuals with higher AS-GRS scores showed higher OR (Figure 3). This dose-dependent trend also supports the predictive ability of our AS-GRS model. To our knowledge, ours is the first AS risk prediction model based on multiple genetic factors including HLA-B27, CNV, and SNP.
As for the CNV, we started with 5 risk-increasing CNV identified by screening whole-genome CNV profiles of 934 Korean patients with AS and 1200 control individuals12. All of the profiles are common variants across ethnic groups21. We successfully designed the TaqMan probes for 4 CNV out of the 5 candidates, and the TaqMan results showed 98.6% consistency with those confirmed by a different method, PCR sequencing. Therefore, we used the 4 CNV markers for the AS-GRS model. As for the SNP, there were several SNP suggested to be associated with AS, such as rs27434 in the ERAP1, rs10865331 in 2p15, and rs11209026 in the IL23R8,9,10,11, among which SNP in the ERAP1 and 2p15 were replicated in the Korean population13,14. For designing the AS-GRS model, we first selected 7 SNP in 2p15 and the ERAP1 and finally found 1 SNP (rs10865331) in 2p15 to be significant, which was included in the model. None of the SNP in the ERAP1 gene showed significant associations either in the model construction set (Table 1) or in the independent validation set (data not shown).
Through the logistic regression analysis, 5 genetic markers [3 CNV (HHAT, EEF1DP3, and 16p13.3), 1 SNP (2p15), and HLA-B27] were finally selected for the model. The AS-GRS model was successfully replicated in the independent validation set and their discriminative ability was superior to that of the HLA-B27 model. In particular, our model showed higher specificity and accuracy compared with the HLA-B27 model when the sensitivity was set to over 94%. In the independent validation set, individuals in the highest risk group (quartile group 4) had 494× higher risk (95% CI 237.3–1029.1) than those in the lowest risk group (quartile group 1), which also supports the predictive ability of our AS-GRS. AS-GRS could be more informative in HLA-B27–positive individuals or higher-risk individuals, such as relatives of the patients with AS. Indeed, in a subset of individuals positive for HLA-B27, our AS-GRS model showed higher predictive ability than the HLA-B27–only model.
In spite of the good performance of the AS-GRS model, there are several limitations in our study. First, only a small subset of the candidate SNP that have been replicated in East Asians were analyzed (7 SNP) and just one of them showed a significant signal and was included in the model. It has been commonly observed that some SNP significant in 1 ethnic group were not consistently significant in other groups. Considering this possibility, we used well-replicated SNP in Koreans in our study, which can make the model fit for Koreans, but at the price of reduced generalizability in other populations. In addition, new SNP are being reported to be associated with AS. For example, Ellinghaus, et al identified 27 new risk loci associated with 5 chronic inflammatory diseases in European ancestry including 17 AS-associated loci22, which are yet to be replicated in Koreans. It means that there is still room for improvement and refinement in the performance of the AS-GRS model. Second, the effects of genetic factors were less prominent in the validation set compared with the model construction set (Table 1). It can be explained by “winner’s curse,”23,24 that is, inflation of the observed effect size in a relatively small discovery set, which was the model construction set in our case. Although we found the evidence of risk inflation limited because of bias correction, the associations remained significant (Supplementary Data 9, available online at jrheum.org). Third, standard quality control procedures regarding sex, contamination, relationship, and population structure were not performed in our study because of the small number of variants used in the validation. Finally, although the CNV markers used for developing AS-GRS were proven to be associated with AS and they were common variants, their biological implication has not been validated in other populations. Further validation of AS-GRS in various populations will be required to generalize this model.
We built our model based on genotyping results from TaqMan assays, a genotyping tool commonly used in clinical settings worldwide. This can improve clinical applicability of this model25. In addition to SNP, CNV and HLA-B27 can be detected reliably by TaqMan assay in 1 reaction, making our system more convenient and affordable. Our AS-GRS could be used to identify individuals at high risk for AS before major symptoms appear, improving the prognosis for the patients through early treatment.
ONLINE SUPPLEMENT
Supplementary data for this article are available online at jrheum.org.
Footnotes
Supported by a grant from the Korean Health Technology R&D Project, Ministry for Health and Welfare, Republic of Korea (HI14C3417).
- Accepted for publication August 16, 2016.


