

Abstract
Objective. In adults, osteoarthritis (OA) is associated with obesity and knee alignment. Whether knee alignment differences develop during childhood and are associated with obesity is unknown. We assessed the distribution of knee alignment in children and adolescents, and determined how knee alignment differs between obese and nonobese children.
Methods. This cross-sectional study examined knee alignment in 155 healthy weight and 165 obese subjects. Knee alignment [metaphyseal-diaphyseal angle (MDA) and anterior tibiofemoral angle (ATFA)] and fat mass were measured using whole body dual-energy X-ray absorptiometry (DEXA). National reference data were used to generate age- and sex-specific body mass index (BMI, kg/m2) Z-scores. Multivariable linear regression was used to identify independent factors associated with ATFA and MDA.
Results. The mean MDA and ATFA were similar between obese and nonobese subjects. In stratified analyses, females had greater variability in MDA and ATFA values (p < 0.001 and p = 0.04, respectively) at higher BMI Z-scores. Compared with healthy weight controls, obese subjects had less valgus of the MDA prior to the onset of puberty (+ 2.0°, p = 0.001), but had greater valgus at later pubertal stages (−1.9°, p = 0.01).
Conclusion. We found significantly greater variability in knee alignment among females at higher BMI Z-scores, and greater valgus alignment in obese adolescents in late puberty. The major limitation is the use of DEXA for assessment of alignment, which needs validation against longstanding radiographs. Longitudinal studies are needed to determine whether childhood obesity is a risk factor for progressive malalignment that may predispose to pain and risk of early osteoarthritis.
Childhood obesity, defined as body mass index (BMI, kg/m2) at or above the 95th percentile for a reference population, has tripled since the 1970s. Similarly, obesity comorbidities, such as hypertension1, hyperlipidemia2, type 2 diabetes, and obstructive sleep apnea syndrome, are increasingly recognized during childhood and are thought to result in greater adult morbidity and mortality3. In adults, obesity is a recognized risk factor for the onset and progression of knee osteoarthritis (OA), a leading cause of disability4, and a significant health-related economic burden. The incidence of OA is increasing; by 2020, about 59 million people, or 18% of the US population, will be affected5. The effect of pediatric obesity on OA indicates that being overweight and obese in the teen years may be associated with pain and OA6,7,8.
OA is a progressive, degenerative joint disease affecting the articular cartilage and subchondral bone9. While nonmodifiable factors such as genetics and aging are strongly linked to the development and progression of OA, multiple studies suggest that obesity plays a critical role10. In addition to the causal relationship of obesity on developing OA, knee malalignment may confer an added risk by causing abnormal biomechanical forces to be transmitted across the joint during ambulation, affecting joint alignment11. In adults, varus and valgus malalignment leads to an amplification of medial and lateral OA, respectively12,13. In obese adults, valgus and varus knee alignment was associated with knee OA onset14.
Typically in childhood, dramatic changes in skeletal size and structure occur. About 25% of peak bone mass is deposited during the 2-year period surrounding peak height velocity15. The capacity of bone to respond to mechanical loading with increased bone size and strength is greatest during growth, especially adolescence16,17. In fact, childhood obesity is associated with greater whole body bone mineral content18 and femoral bone strength19. However, the effect of altered loading conditions on skeletal alignment in pediatric obesity has not been examined. One study used dual-energy X-ray absorptiometry (DEXA) to demonstrate that knee alignment abnormalities were more common among obese children and adolescents. They found that there was more valgus malalignment in obese children and that angle measures were more variable at higher BMI Z-scores20. However, other determinants of knee alignment differences were not assessed, such as sex and pubertal stage differences, both important mediators of knee alignment21,22. Although DEXA is not a conventional method and has not been validated to measure knee alignment, it may be an alternative method that can provide measurements of knee alignment and body composition simultaneously.
The objectives of our study were to characterize the distribution of knee alignment in a cohort of obese and healthy weight children and adolescents using DEXA, and to identify independent risk factors for knee malalignment during childhood, such as sex, race, age, pubertal stage, and obesity. Our a priori hypotheses were that valgus knee alignment was greater with greater BMI, and that obesity-related differences in knee alignment would be observed after puberty, when growth is rapid.
MATERIALS AND METHODS
We performed a cross-sectional study using a convenience sample of subjects who had existing DEXA and anthropometric data collected as part of other research studies18,23,24,25 and clinical care in the Division of Gastroenterology and Nutrition and the Nutrition and Growth Laboratory (NGL) at The Children’s Hospital of Philadelphia.
Subjects
The study population consisted of subjects from 3 groups. Healthy reference participants (n = 200; reference group), recruited from general pediatric clinics in the surrounding community and through newspaper advertisements, served as a reference group for multiple studies done at the NGL26. These participants were 4–20 years of age and the mean BMI Z-score (SD score) was 0.35 ± 1.13. About 16% were obese, comparable to the estimates of obesity among US children and adolescents27. Subjects were excluded if any coexisting conditions known to affect growth, nutritional status, dietary intake, pubertal development, or bone mineralization were present. The second group (Weight Management group) consisted of children and adolescents (n = 76) receiving care in a weight management program at The Children’s Hospital of Philadelphia over a 3-year period. They were 4–17 years of age, had a mean BMI Z-score of 2.38 ± 0.42, and had whole-body DEXA performed at the initial evaluation prior to any intervention23. The third group (sibutramine group) consisted of obese adolescents (n = 78) enrolled in a clinical trial of sibutramine therapy. These participants were 13–17 years of age and had a mean BMI Z-score of 2.42 ± 0.20. Subjects were excluded if they had cardiovascular disease, diabetes, psychiatric disorder, and medications that led to weight loss or weight gain24. All of these subjects had whole-body DEXA scans performed prior to any intervention24.
For our study, data from all 3 groups were pooled and stratified by obesity status into nonobese and obese groups. Of the 354 subjects with available data, 34 were excluded because of poor-quality images in which identification of bony landmarks was not possible. The BMI Z-scores of the subjects who were excluded did not differ from those who were included (excluded mean 1.38, CI 0.96–1.80 vs included mean 1.23, CI 1.08–1.37, p = 0.52).
DEXA body composition and knee alignment measurements
Whole-body DEXA scans were performed using a Hologic QDR 2000 bone densitometer (Hologic Inc.) with a fan beam in the array mode. Measurements were taken in the standard supine position with the feet inverted, and included estimates of lean and fat mass (kg), excluding the head. The instrument was calibrated daily using a hydroxyapatite phantom. The precision of lean and fat mass measures using DEXA is reported as 2–3% and 3–4%, respectively28. Sex-specific lean and fat mass-for-height Z-scores were derived from the healthy controls (control group) using the LMS method29,30.
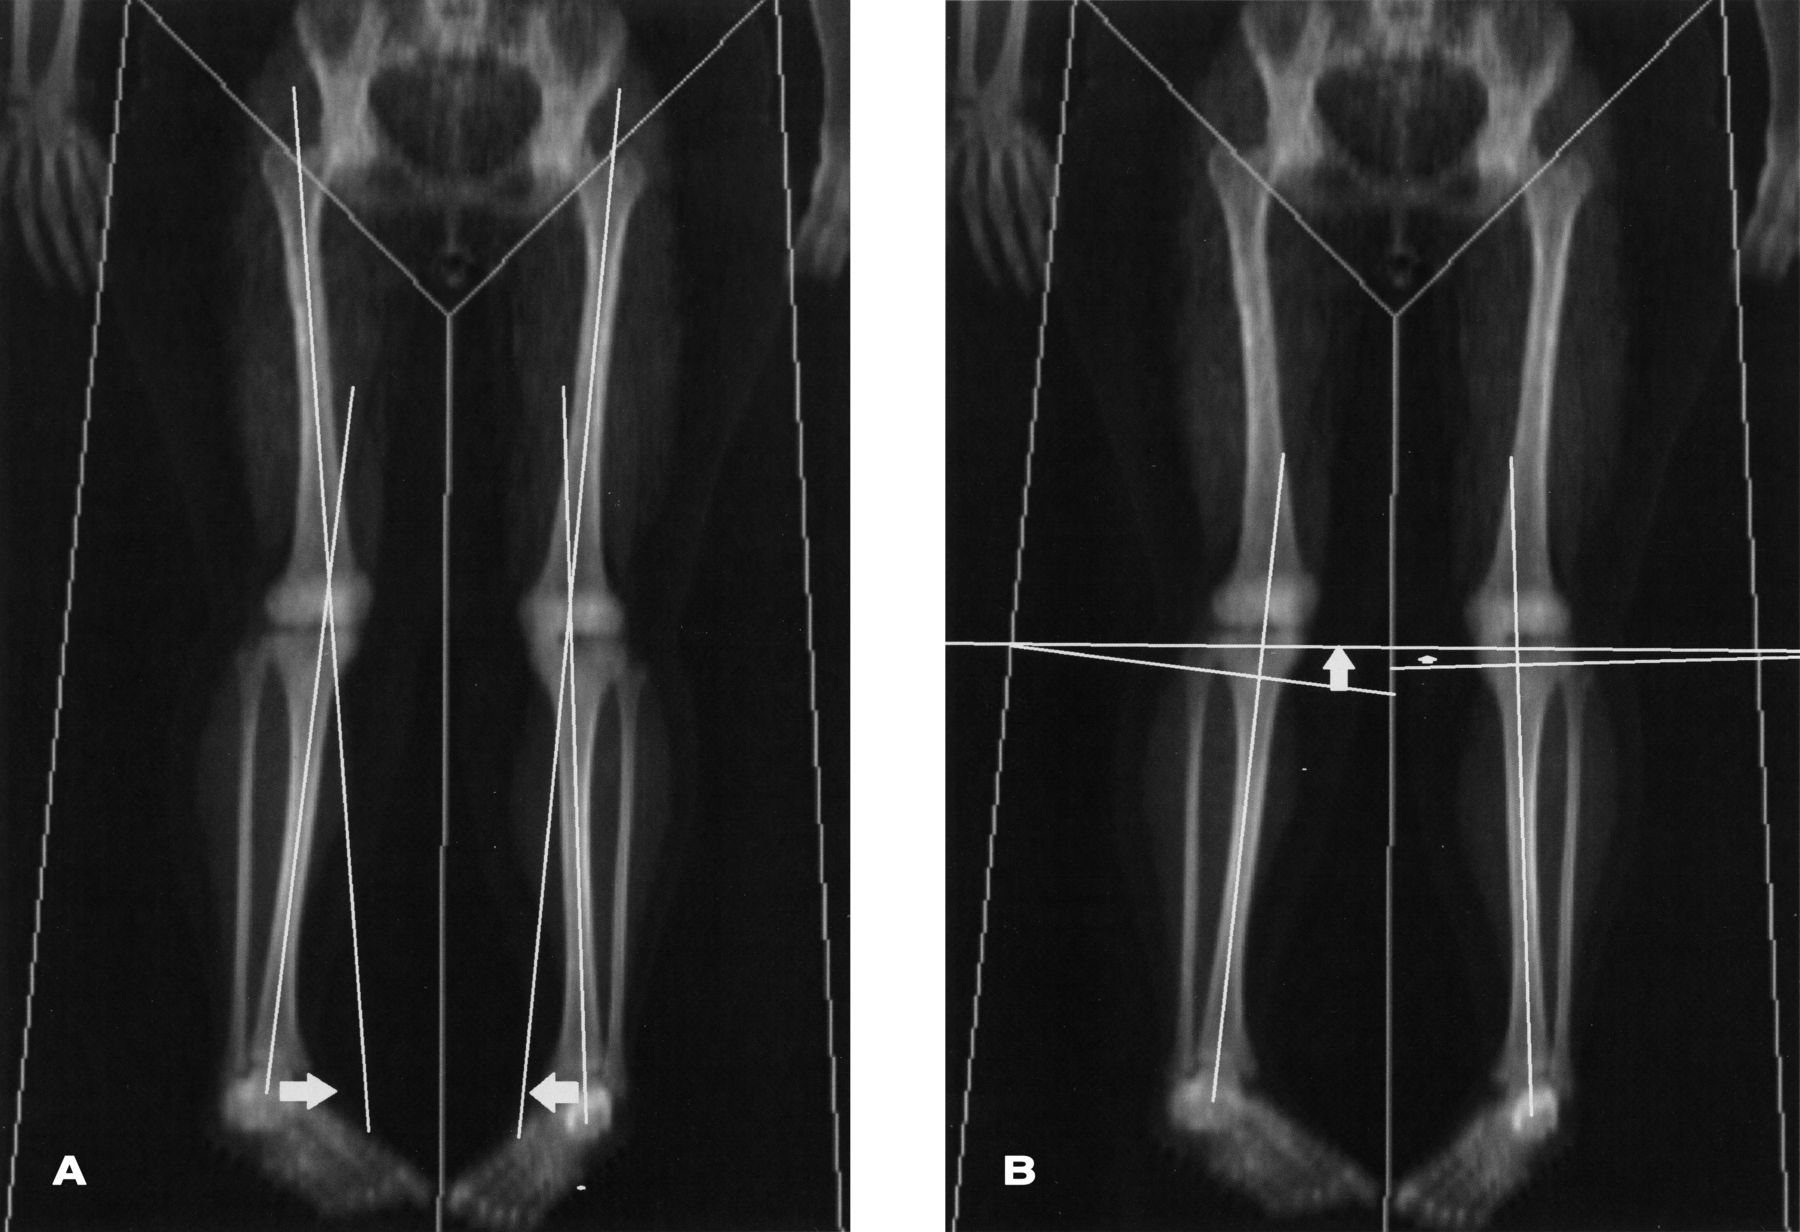
DEXA images were used to perform knee alignment measurements with eFilm Lite DICOM image viewing software (Merge Healthcare), by a single observer (SBT). Test-retest reliability was performed by repeat knee alignment measures on the first 30 DEXA scans and 1 of every 10 consecutive scans thereafter by SBT. The anterior tibiofemoral angle (ATFA), analogous to the anatomic knee axis, represented the angle formed between the central axis of the femur and the central axis of the tibia20,31. The metaphyseal-diaphyseal angle (MDA) was derived by drawing a line perpendicular to the longitudinal axis of the tibia and a line through the 2 beaks of the proximal tibial metaphysis (Figure 1)20,32. For both measures, positive and negative values represent varus and valgus alignment, respectively. These measures were chosen because they are typically used to assess knee alignment in children. The MDA is considered a more precise tool to assess early and progressive knee malalignment and both have been used in the diagnosis of children with Blount disease32,33. The minimum of the values for the right and left leg ATFA and MDA was used in the analysis. For the analysis, the ATFA and MDA were examined as continuous and categorical variables where the ATFA was defined as normal for angles between +5° and −15°, and MDA between +11° and −11°20.

Knee alignment measures. A. ATFA is the angle formed by the perpendicular lines drawn through the tibial and femoral shaft. B. MDA is the angle formed by the horizontal line drawn through the metaphyseal beaks and the line perpendicular to the tibial shaft. ATFA: anterior tibiofemoral angle; MDA: metaphyseal-diaphyseal angle.
Anthropometrics and pubertal development
Weight and height were measured using a digital scale to the nearest 0.1 kg (Scale-Tronix) and a stadiometer to the nearest 0.1 cm (Holtain Ltd.), respectively. Age- and sex-specific Z-scores for weight, height, and BMI were calculated using the National Center for Health Statistics 2000 Center for Disease Control growth data, using the LMS method34. Obesity was defined according to the Center for Disease Control and Prevention definition of a BMI greater than or equal to the 95th percentile35. Similarly, fat mass was based on a generated Z-score divided into below and above the 95th percentile. Pubertal stage was determined by physical examinations according to the method of Tanner18,23. The sibutramine group did not have assessments of pubertal maturation performed. However, given their older age (13–17 yrs) and high mean BMI Z-score, we imputed values of Tanner stage 4 or 5 to all subjects in the group36,37. For the analysis, we used all the Tanner levels and combined 4–5.
Our study was approved by the Institutional Review Board of the Children’s Hospital of Philadelphia.
Statistical analysis
All statistical analyses were performed using STATA 12 (Stata Corporation). Descriptive analyses included means, SD, median and ranges of continuous variables, and distributions of categorical variables. Differences of means were assessed using Student t test if the variable was normally distributed. The Wilcoxon Rank Sum test was used if these data were not normally distributed. Group differences in categorical variables were assessed using the chi-square or Fisher’s exact test, where appropriate.
Reliability was assessed using Pearson product-moment estimates and the root mean squared coefficient of variation.
Multivariable linear regression was used to identify independent factors associated with the ATFA and MDA. Sex, race, age, pubertal status, and BMI or fat mass were added at once in the model. A Tanner stage by obesity interaction term was used to assess whether the effect of obesity on ATFA and MDA differed between pubertal groups. The assumptions of the regression models were assessed by means of graphical checks, the Ramsey omitted variable test, and the Cook-Weisburg test for heteroscedasticity.
RESULTS
Subjects
Of the 320 subjects, 165 were obese (52%). Demographic and anthropometric characteristics are detailed in Table 1. Obese subjects were older (11.9 vs 10.5 yrs, p < 0.001). Among those who had a formal assessment of Tanner stage, obese participants at stage 3 and stage 4 were significantly younger than their nonobese counterparts (p < 0.001 and p = 0.04, respectively). The sex and race distributions were similar between obese and nonobese subjects.
Demographic and anthropometric characteristics of the study population. All values are mean ± SD unless otherwise specified. BMI-for-age and fat mass-for-height Z-scores were sex-specific. Ranges in parentheses.
Reliability of alignment measures
Knee alignment measurements showed high test-retest reliability for both knees. For the ATFA: r = 0.92–0.95, p < 0.001. For the MDA: r = 0.93–0.95, p < 0.001 (Table 2). While the coefficient of variation showed the MDA measurements to be less reproducible than those of the ATFA, there were no differences in the reproducibility according to obesity status for either measurement (p > 0.20).
Intrarater reliability of DEXA knee alignment.
Knee alignment measures
Knee alignment measures were assessed in relation to obesity status, BMI Z-score, and fat mass Z-score. Mean ATFA (obese = −10.6 ± 3.7 vs non-obese = −10.5 ± 3.4, p > 0.20) and MDA (obese = −8.7 ± 4.0 vs non-obese = −8.9 ± 3.1, p > 0.20) angles did not differ by obesity status. Neither the ATFA nor MDA were correlated with either BMI Z-scores or fat mass Z-score.
Further, when the same analysis was repeated by classifying the knee alignment measurements into abnormal and normal alignment20, there were no differences by obesity status, BMI Z-score, or fat mass Z-score.
In univariate analysis, to test for associations between ATFA and independent risk factors, we found that sex (p < 0.01), age (p < 0.05), and Tanner stage (p < 0.01) were significantly associated with the ATFA, while race was not. However, the MDA was not associated with these independent risk factors.
Multivariable regression modeling examined associations between obesity and the MDA and ATFA separately, while controlling for sex, race, age, and Tanner stages. Sex and race were not associated with MDA or ATFA values. However, MDA values varied according to Tanner stage and obesity status. In Tanner stage 1, obese subjects had a significantly greater MDA, compared with nonobese subjects (1.99°, p = 0.001) indicating less valgus alignment. However, in Tanner stages 4–5, obese subjects had a significantly lower MDA compared with nonobese subjects (1.89°, p = 0.01), indicating greater valgus alignment (Figure 2).
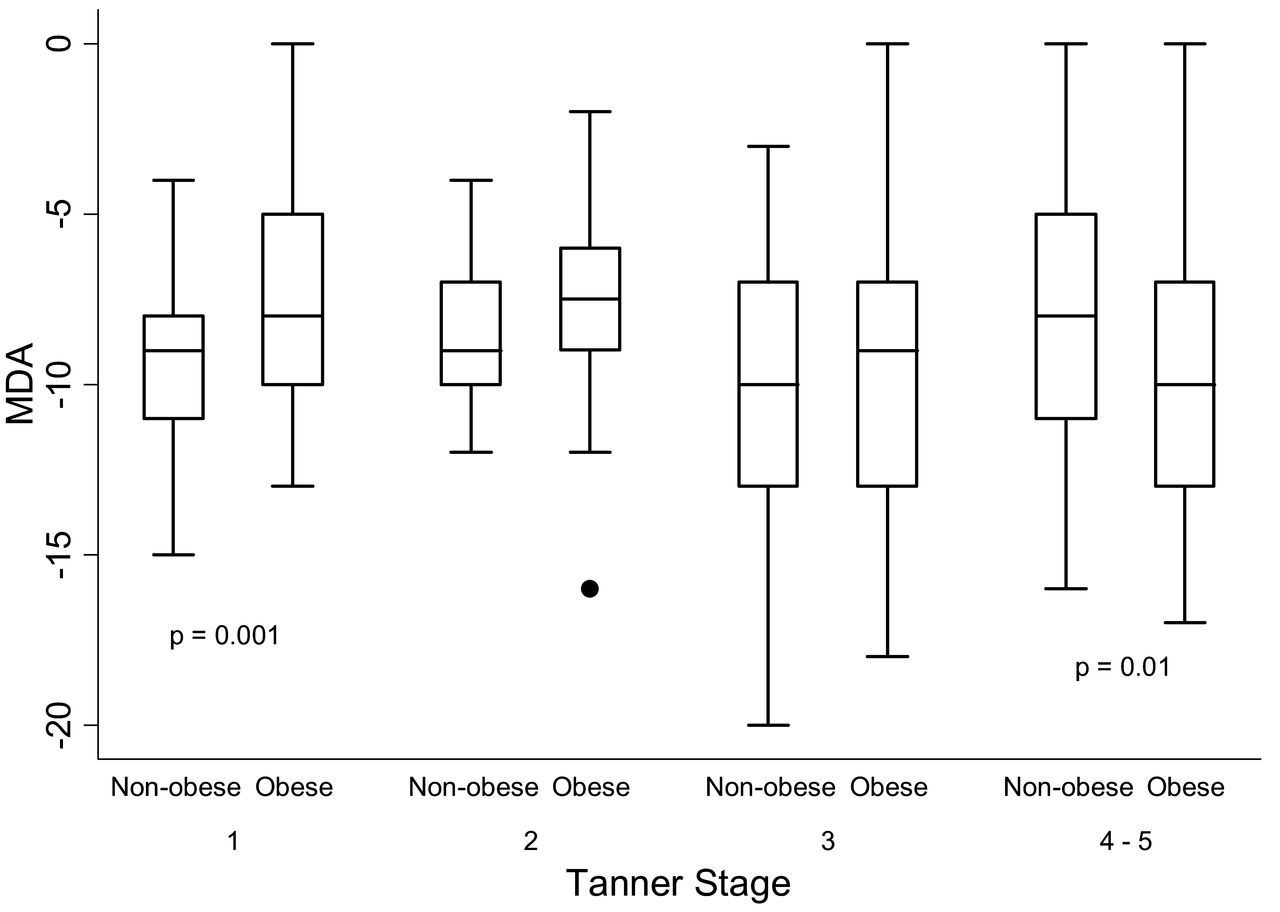
Box-and-whisker plot demonstrating the MDA distribution for obese and nonobese children at Tanner stages 1–5. In Tanner stages 1–5, obese children had greater valgus alignment compared with nonobese children (p = 0.01). Analyses were adjusted for sex, race, and age. MDA: metaphyseal-diaphyseal angle.
We then examined independent risk factors of the relationship between obesity and knee alignment. In stratified analyses by sex, females had greater variability in MDA and ATFA values (p < 0.001 and p = 0.04, respectively) at higher BMI Z-scores. In males, the variability in MDA and ATFA values was not significant (p > 0.07 and p > 0.20, respectively) at higher BMI Z-scores (Figure 3). At higher fat mass Z-scores, the greater variability in MDA values was significant only in females (p = 0.001).
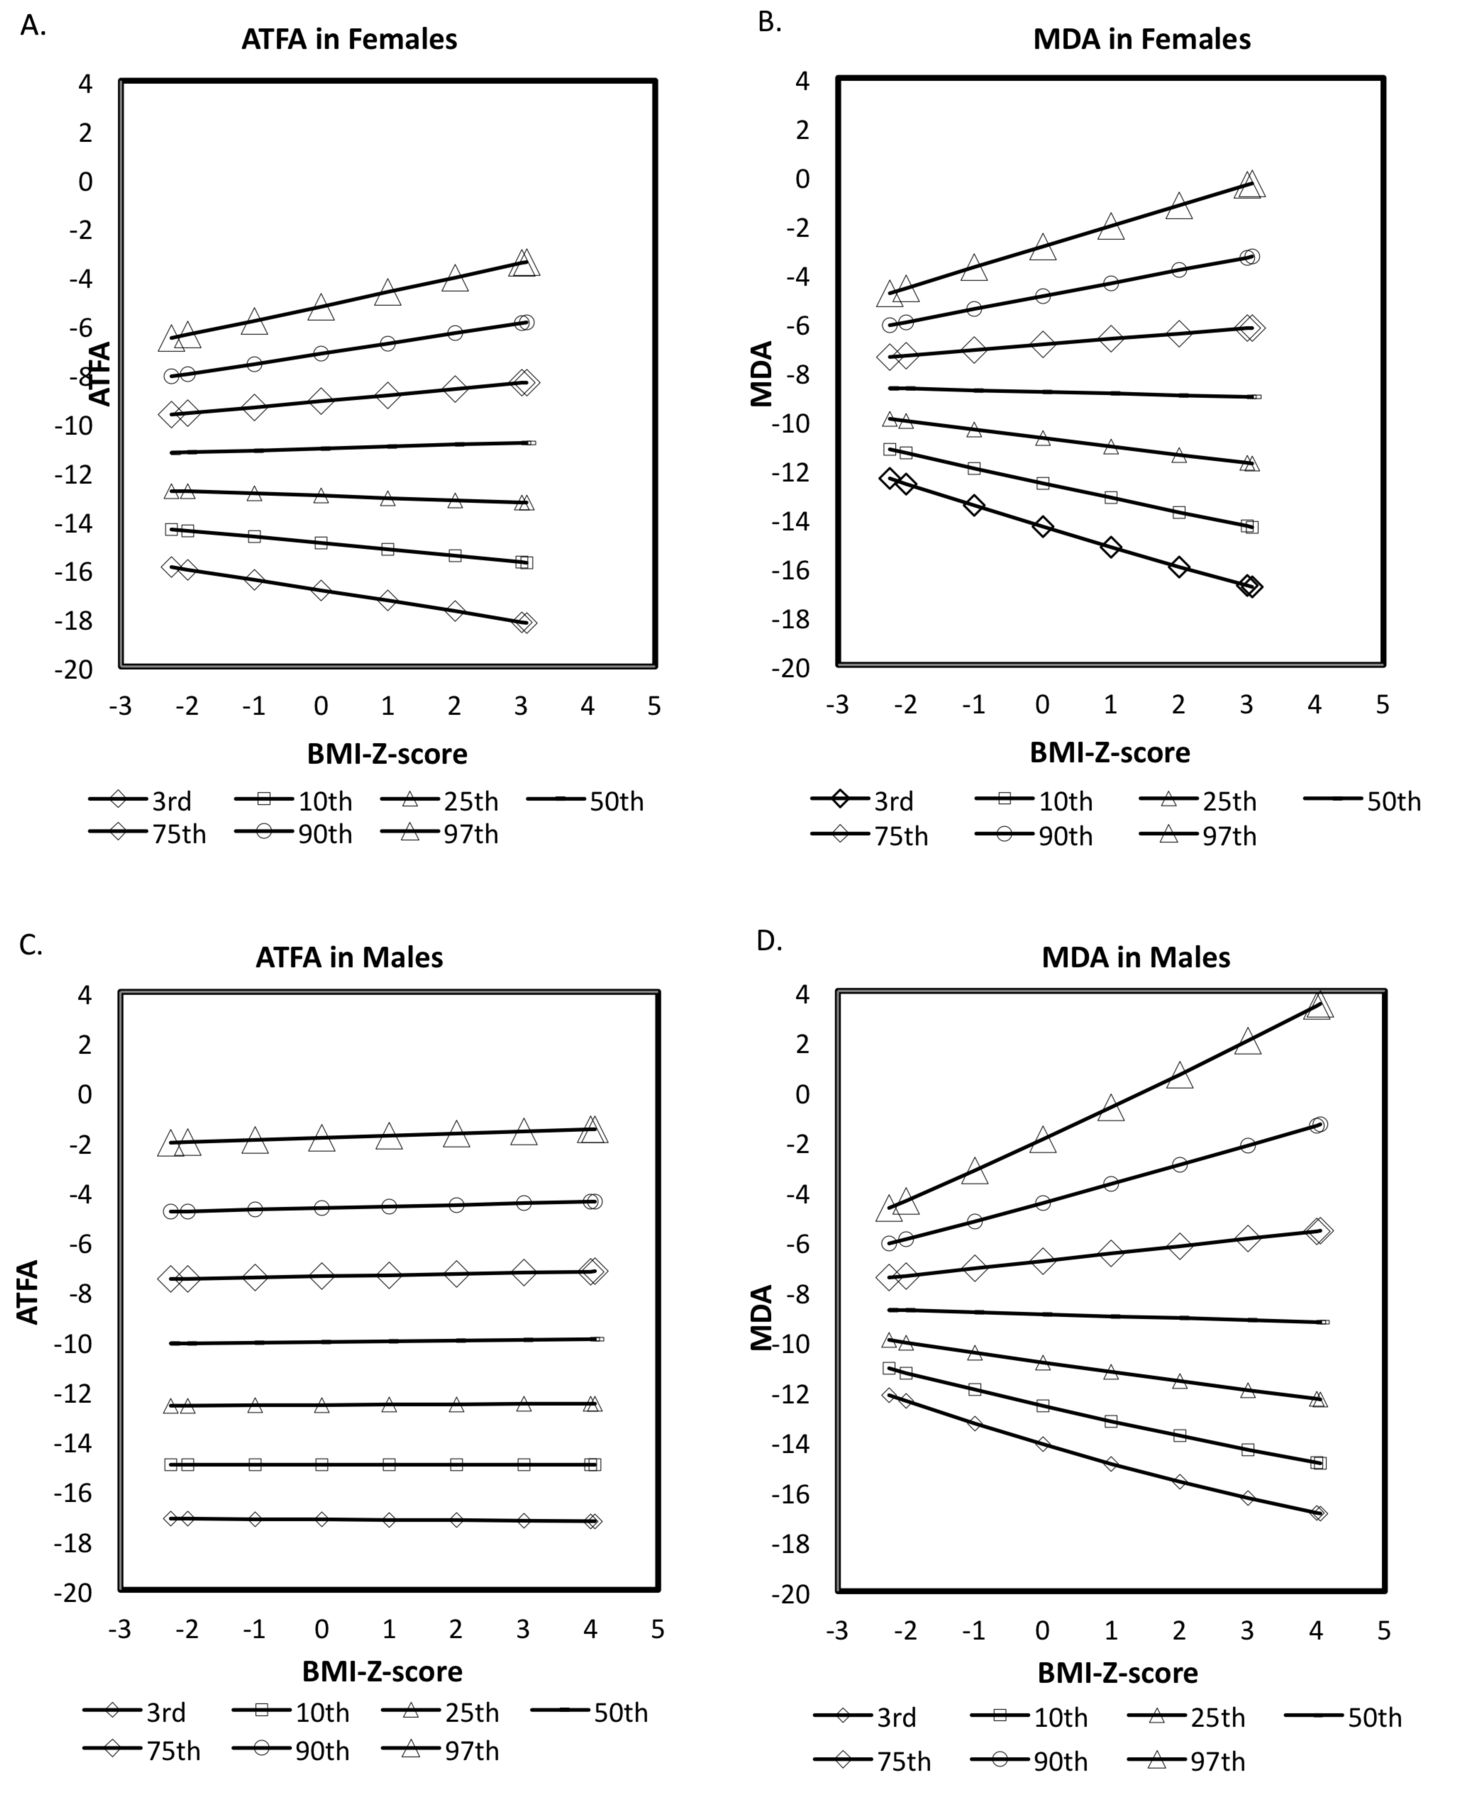
Distribution of ATFA and MDA by BMI Z-scores. ATFA among females (A) is significant (p < 0.04). MDA among females (B) is significant (p < 0.001). ATFA among males (C) is not significant (p > 0.2). MDA among males (D) is not significant (p > 0.07). Positive values = varus. Negative values = valgus. ATFA: anterior tibiofemoral angle; MDA: metaphyseal-diaphyseal angle; BMI: body mass index.
We evaluated our a priori hypothesis by testing mediators of the relationship between obesity and knee alignment. ATFA and MDA were assessed according to obesity status and stratified by Tanner stage. First, the ATFA values of subjects in Tanner stages 1, 2, 3, and 4–5 were similar among nonobese children. However, the ATFA values of subjects in Tanner stages 4–5 were significantly lower relative to those in Tanner stage 1 (p = 0.03), indicating greater valgus alignment among obese subjects (Table 3). Second, the MDA values of subjects in Tanner stages 4–5 were lower relative to those in Tanner stage 1 (p = 0.04), indicating greater valgus among nonobese subjects. The MDA values of subjects in Tanner stages 3 and 4–5 were lower relative to those in Tanner stage 1 (p = 0.006 and p = 0.001), indicating greater valgus alignment among obese subjects. When comparing knee alignment angles in nonobese and obese children by the mediating role of Tanner stage, only the MDA values significantly differed. In Tanner stage 1, obese children had less valgus alignment, but in Tanner stages 4–5 obese children had greater valgus alignment (Figure 2 and Table 3).
Relationship between obesity and pubertal stage on the MDA and ATFA. All values are mean ± SD in degrees. Negative MDA and ATFA values indicate valgus alignment. The minimum of the 2 values for ATFA and MDA from the right and left legs was used in the analysis. Analyses were adjusted for sex, race, age, Tanner stages, and obesity.
DISCUSSION
In our study comparing knee alignment in obese and nonobese children, we demonstrated that pubertal stage modified the relationship between obesity and knee alignment. Specifically, obese children in Tanner 1 had less valgus while those in Tanner 4–5 had greater valgus alignment compared to their nonobese counterparts. Additionally, there was greater variability in knee alignment among girls with higher BMI Z-scores.
Bone and cartilage are mechanically sensitive tissue and remodel in response to prolonged loading in the periarticular areas where most of the pressure is exerted. In Blount disease (tibia vara), histopathology shows fissuring and clefts in the physis, fibrovascular, and cartilaginous tissue consistent with microscopic damage because of mechanical compression38. In healthy children, knee articular cartilage accrual is independently associated with vigorous physical activity, showing that articular cartilage, like bone, responds to mechanical skeletal forces during development39. We hypothesize that these mechanisms are particularly active in the rapidly maturing skeleton and may explain our finding of greater valgus alignment in obese adolescents40.
Our study expanded on a study by Taylor, et al20 by specifically assessing how pubertal development and body composition affect the relation between obesity and knee alignment. In the obese children, we obtained mean MDA and ATFA values similar to those of Taylor, et al20. However, we could not reproduce their findings that a larger proportion of obese children had abnormal angles when knee alignment was dichotomized (normal ATFA +5° to −15° and MDA +11° to −11°). While Taylor, et al concluded that obese children had significantly greater valgus using the MDA, we found this association significant only at Tanner stages 4 and 520. These discrepancies between our studies may be explained by the wider age range and BMI Z-score representation in our study.
Although we used a novel technique to measure knee alignment, we found that our data in healthy-weight children were similar to existing normative data on knee alignment that use conventional techniques21,22,31,41. Typically, the tibiofemoral angle progresses from varus to valgus from birth to 3 years of age and approaches 4–7° of physiologic valgus alignment in children aged 5–18 years21,22,31,41. In nonobese children older than 4 years, we obtained a mean ATFA of −10.5 ± 3.4 of physiologic valgus. Although we did find more children in postpubertal valgus alignment, we did not find a trend of greater valgus among obese children in the prepubertal stages (Tanner 2 and 3), consistent with our hypothesis that the rapid pubertal growth may allow for greater loads to amplify knee alignment. Further, less valgus was seen among children in Tanner stage 1; a plausible explanation is that these children are physiologically transitioning from varus to valgus alignment, but the children who are obese, because of greater loading, may not attain physiologic valgus.
Nonphysiologic alignment is associated with pathologic disease states. In children, knee malalignment leads to abnormal mechanics, damage to the cartilage, and pain38. In fact, pain and satisfaction scores in children with Blount disease after correction improved and were associated with a narrow MDA score between −5° and +5° and ATFA score of 0° to −5°42. Longterm followup of children with physiologic genu varum followed for 36 years found that two-thirds of the children showed no symptoms while one-third reported pain and stiffness43. In adults, varus and valgus malalignment in combination with obesity is associated with incident and progressive knee OA12,13,14. We documented a clear association between obesity and nonphysiologic valgus knee alignment among older adolescents.
Our study had limitations that should be considered. First, our study was a cross-sectional design of existing data that used DEXA to assess bone mass and body composition estimates. We used DEXA to assess alignment to expand on the findings of Taylor, et al, although the gold standard for the assessment of knee alignment is a standing radiograph. However, we demonstrated adequate test-retest reliability to measure knee alignment. Second, DEXA is performed with the patient supine, eliminating weight-bearing, which may have attenuated differences between obese and nonobese participants. We expect that our significant findings would have been amplified using standing weight-bearing radio-graphs. Third, our DEXA protocol was standardized with the feet immobilized and inverted. Although this protocol may have caused minimal rotation of the hips, the protocol and the assessment of knee alignment did not differ between obese and nonobese children. Fourth, in research studies, the mechanical axis is typically assessed, but the anatomic axis is being favored and correlates well with the mechanical axis44.
Fifth, though the MDA is considered to be a more precise measure for early diagnosis of bowleg deformity and assessment of varus progression in children32, but not for valgus progression, we chose to replicate the findings by Taylor, et al while cognizant that more work is needed to standardize DEXA measurements against longstanding radiographs. The Taylor, et al paper and our data suggest that DEXA may be an alternative imaging modality for knee alignment once validated against standard measures. If true, we could study both knee alignment and anthropometry in obese children while minimizing the number of studies and radiation exposure to children. We were unable to validate DEXA against the gold standard because we used existing data from older studies examining bone health and were not able to recall subjects. Finally, because this is a cross-sectional study, causality cannot be determined.
We describe an association between obesity, pubertal maturation, and knee alignment that may have short- and longterm implications for musculoskeletal health. We report for the first time, to the best of our knowledge, that girls with higher BMI Z-scores have greater variability in knee alignment and that there is greater valgus alignment in obese adolescents in late puberty. Our study highlights the pressing need for research on the musculoskeletal burden of obesity and the pediatric roots of OA. A first step would be to evaluate DEXA measures against the gold standard measures of knee alignment. Future studies are needed to better define the clinical and functional significance of varus and valgus in obese children, to standardize measurements, and to determine whether childhood obesity is a risk factor for abnormal knee alignment and joint remodeling over the long term.
Footnotes
-
Supported by the American College of Rheumatology Research and Education Foundation and National Institutes of Health (NIH) T32-AR07442-23. Robert I. Berkowitz discloses that data from the sibutramine trial were supported in part by grant DK054713 from the NIH, and from the Clinical and Translational Research Center at The Children’s Hospital of Philadelphia, by grants UL1RR024134 (National Center for Research Resources) and UL1TR000003 (National Center for Advancing Translational Sciences). Knoll Pharmaceutical Co. and Abbott Laboratory provided an unrestricted educational grant that was used to support a postdoctoral fellow and several student research assistants involved in the sibutramine trial. Neither Knoll Pharmaceutical Co. nor Abbott Laboratories contributed to the design and conduct, in the collection, analysis, and interpretation of the data, or in the preparation, review, or approval of manuscripts pertaining to the sibutramine data.
- Accepted for publication September 3, 2014.


