
Abstract
Objective. Low-dose methotrexate (MTX) is the anchor drug in the treatment for rheumatoid arthritis (RA). Response to MTX is related to the intracellular MTX-polyglutamate (MTX-PG) levels and little is known about its determinants. We aimed to define the determinants of erythrocyte MTX-PG concentrations in 2 prospective cohorts of patients with RA.
Methods. Patients with RA treated with MTX from 2 longitudinal cohorts were included: 93 from the MTX-R study (Rotterdam, the Netherlands derivation cohort), and 247 from the treatment in Rotterdam Early Arthritis Cohort study (validation cohort). MTX-PG concentrations were measured at 3 months of treatment using liquid chromatography/mass spectrometry. The MTX-PG were used as outcome measure. Various sociodemographic, clinical, biochemical, and genetic factors were assessed at baseline. Associations with MTX-PG levels were analyzed using multivariate regression analysis.
Results. Age was positively associated with MTX-PG1 (stβ 0.23, p = 0.033) and total MTX-PG (stβ 0.23, p = 0.018) in the derivation cohort, and with all MTX-PG in the validation cohort (MTX-PG1: stβ 0.13, p = 0.04; MTX-PG2: stβ 0.21, p = 0.001; MTX-PG3: stβ 0.22, p < 0.001; MTX-PG4+5: stβ 0.25, p < 0.001; and total MTX-PG: stβ 0.32, p < 0.001). Erythrocyte folate levels were positively associated with MTX-PG3 (stβ 0.3, p = 0.021) and total MTX-PG levels (stβ 0.32, p = 0.022) in the derivation cohort, which was replicated for MTX-PG3 (stβ 0.15, p = 0.04) in the validation cohort. Patients with the folylpolyglutamate synthase (FPGS) rs4451422 wild-type genotype had higher concentrations of MTX-PG3 (p < 0.05), MTX-PG4+5 (p < 0.05), and total MTX-PG (p < 0.05) in both cohorts. In the combined cohort, MTX dose was positively associated with levels of MTX-PG3 (stβ 0.23, p < 0.001), MTX-PG4+5 (stβ 0.30, p < 0.001), and total MTX-PG (stβ 0.20, p = 0.002), but negatively associated with MTX-PG2 levels (stβ −0.22, p < 0.001).
Conclusion. Our prospective study shows that higher age, higher MTX dose, higher erythrocyte folate status, and the FPGS rs4451422 wild-type genotype are associated with higher MTX-PG concentrations. While only up to 21% of interpatient variability can be explained by these determinants, this knowledge may aid in the development of personalized treatment in RA.
- METHOTREXATE
- ERYTHROCYTES
- RHEUMATOID ARTHRITIS
- PROSPECTIVE STUDIES
- SINGLE-NUCLEOTIDE POLYMORPHISM
Low-dose methotrexate (MTX) is the most widely used treatment for rheumatoid arthritis (RA) and other arthritic diseases. Although MTX is effective and safe, about 30% of patients with RA encounter adverse events or do not reach sufficient response1. A pharmacogenetic model for the prediction of MTX efficacy has been proposed previously2. However, at the moment there is no therapeutic drug monitoring (TDM)-based model for predicting compliance, response, or adverse events during low-dose MTX treatment.
While MTX plasma levels can be measured easily, low-dose MTX is rapidly cleared from plasma and is not routinely measured. Hence, plasma MTX levels do not correlate with response in patients with RA3. The therapeutic effects of MTX are thought to be mediated by its intracellular levels4, which are difficult to measure. Intracellular levels of MTX can predict treatment response, making intracellular MTX an interesting target for TDM5,6,7,8,9,10,11,12,13. We developed a stable isotope dilution liquid chromatography/mass spectrometry (LC-MS/MS) assay to measure erythrocyte MTX polyglutamates (MTX-PG)14.
MTX is transported into the cell primarily by the reduced folate carrier. Once in the cell, MTX is converted by folylpolyglutamate synthase (FPGS) to MTX-PG by γ-linked sequential addition of glutamic acid residues. In a competing reaction, the MTX-PG are deconjugated by γ-glutamyl hydrolase (GGH), leading to a variety of chain lengths (MTX-PG2–7). In low-dose MTX treatment, the pentaglutamate (MTX-PG5) is the highest order of glutamylation detected, while the triglutamate form (MTX-PG3) of MTX predominates15,16. Polyglutamylation retains MTX in the cell because the MTX-PG are a poor substrate for the MTX efflux proteins.
In low-dose MTX, the median time to reach steady-state MTX-red blood cell (RBC) levels is highly variable between patients and increases with the number of PG attached to MTX17. For example, MTX-PG3 has a median time to reach steady state of 41.2 weeks (range 19.8–66.7 weeks) compared to 139.8 weeks (range 15.5–264.0 weeks) for MTX-PG517. Steady-state levels are also highly variable between patients: total erythrocyte MTX-PG concentration varied between 90.9–351.5 nmol/8 ×1012 RBC17. The mechanisms behind the highly variable intracellular MTX-PG levels are still not known. Previous research has shown that increased age, higher dose, route of administration, and decreased renal function18,19 are associated with higher MTX-PG levels, as well as multiple single-nucleotide polymorphisms (SNP) in MTX pathway genes8,13. However, these studies used cross-sectional cohorts with a wide range of treatment duration among patients. Therefore, the aim of our study was to examine clinical, genetic, sociodemographic, and biochemical determinants of erythrocyte MTX-PG concentrations in patients treated with low-dose oral MTX using 2 different prospective cohorts.
MATERIALS AND METHODS
Patients
Our study includes data of patients with RA treated with MTX from 2 prospective cohorts. For the derivation cohort, patients from the MTX in Rotterdam, Netherlands, cohort (MTX-R) were used. The MTX-R is a longitudinal prospective cohort of patients diagnosed with RA who started MTX between January 2006 and March 2011 in the Department of Rheumatology, Erasmus University Medical Center, Rotterdam, the Netherlands. The validation cohort consisted of patients from the treatment in Rotterdam Early Arthritis Cohort (tREACH). The tREACH is a clinical multicenter, stratified single-blinded trial (ISRCTN26791028) and was described earlier20. Patients were included in the validation cohort if they met the 2010 American College of Rheumatology/European League Against Rheumatism criteria for RA. The medical ethics committee from the Erasmus University Medical Center approved both studies, and patients gave written informed consent before inclusion. Patients from the derivation and validation cohorts were included in our study if they were prescribed MTX at baseline and 3 months of treatment, and had at least 1 MTX-PG measurement at 3 months of treatment. All patients were MTX-naive at inclusion.
In the derivation cohort, dosage and comedication was chosen by the physician. MTX was generally given orally. Patients from the validation cohort started with 25 mg/week MTX orally (dosage reached after 3 weeks) and were randomized to treatment with or without sulfasalazine (SSZ), hydroxychloroquine (HCQ), and glucocorticosteroids. Patients in both cohorts received folic acid (10 mg/week) during MTX treatment as recommended by the Dutch Rheumatology Society21. In both cohorts, patients were assessed at baseline and after 3 months.
Patient material
During the first and second study visits, an extra EDTA tube was drawn from the patient. The sample from the first visit was used for DNA isolation, whereas the sample from the second visit was immediately put on ice after collection and centrifuged for 10 min at 1700 × g and 4°C. Plasma and erythrocyte cell-pellet aliquots were stored at −80°C.
MTX-PG quantification
MTX-PG were measured in the cell-pellet aliquots sampled at 3 months of treatment using a recently developed LC-MS/MS method14. MTX-PG1 and MTX-PG2 are considered as short chain, MTX-PG3 as medium chain, and MTX-PG4 and MTX-PG5 as long chain. The sum-score of MTX-PG2 to MTX-PG5 was used as the total MTX-PG content. Considering the finding that MTX-PG1 can diffuse over the RBC membrane22, we decided to remove MTX-PG1 out of the model for total MTX-PG.
Genotyping
SNP in genes involved in MTX transport and polyglutamylation were selected based on the following criteria: minor allele frequency > 0.10 in the HapMap and National Center for Biotechnology Information SNP database23,24 or a proven functionality in relation to MTX, juvenile idiopathic arthritis (JIA), RA, or folate metabolism25,26,27,28,29,30,31,32,33. If no information was known for a particular gene, we selected tagging SNP by HapMap database and Haploview (version 4.2, 29 April 2008). Preferably, 2 SNP were selected per gene, which were located in different haplotype blocks.
The following 28 SNP in 19 genes were selected: ABCB1 rs1128503, rs2032582, rs1045642; ABCC1 rs35592, rs3784862; ABCC2 rs4148396, rs717620; ABCC3 rs4793665, rs3785911; ABCC4 rs868853, rs2274407; ABCC5 rs2139560; ABCG2 rs13120400, rs2231142; ADA rs7359874; ADORA2A rs5751876; AMPD1 rs17602729; ATIC rs2372536; FPGS rs4451422; FOLR2 rs514933; GGH rs10106587, rs3758149; ITPA rs1127354; MTHFR rs1801131, rs1801133; MTRR rs1801394; SLC46A1 rs2239907; and SLC19A1 rs1051266. The major allele was analyzed as wild-type allele.
SNP genotyping has been described earlier34.
Clinical, biochemical, and sociodemographic variables
Various clinical, biochemical, and sociodemographic variables were assessed at baseline. In the derivation cohort, the use of other disease-modifying antirheumatic drugs, HCQ, SSZ, corticosteroids, biological, route of administration of corticosteroids, dose of MTX, and route of administration of MTX were reported by patients using question forms. In the validation cohort, these items were scored by research nurses. The estimated glomerular filtration rate-Modification of Diet in Renal Disease (eGFR-MDRD) was calculated using the 4-variable MDRD formula, and body surface area was calculated using the Mosteller formula.
During our study visit, blood was obtained from patients to determine rheumatoid factor, anticyclic citrullinated peptide antibody, C-reactive protein (CRP), 1-h erythrocyte sedimentation rate (ESR), albumin, enzymatic creatinine, erythrocyte folate, serum folate, vitamin B12, vitamin B6, and homocysteine. Questionnaires were used to determine smoking habits and the consumption of alcohol, cola, coffee, tea, and cigarettes (amount per day).
Statistics
Comparison of patient characteristics between cohorts was made by Student t test, chi-square test, or the Mann-Whitney U test where appropriate. Multivariate multiple linear regression analysis, stratified by cohort, was used to examine the associations between these potential determinants and the different MTX-PG concentrations. First, univariate linear regression was performed for all potential determinants with the MTX-PG concentrations as outcome measure. The strength of the associations was expressed as standardized β. Univariate relations between variables and any MTX-PG with a p value less than 0.2 were entered in subsequent multivariate multiple regression analyses with adjustment for age, sex, and other potential determinants that had a p value of less than 0.2 in the univariate analysis.
Continuous determinants were analyzed as continuous variable and transformed into quintiles to examine possible nonlinear associations. To establish nonlinear associations, the quintiles were plotted against the total MTX-PG levels used. Variables with a nonlinear association were transformed into categorical variables and categories were combined where appropriate. This was done for ESR, GFR, creatinine, alcohol consumption, tea consumption, and days of treatment. Dummy variables were used to analyze categorical variables with more than 2 categories in linear regression using the first category as reference. Non-normal distributed variables were transformed using the natural logarithm (ln) for linear regression; this was done for homocysteine, erythrocyte folate, and C-reactive protein.
SNP were divided into dominant, recessive, or additive models depending on the distribution of the total MTX-PG levels per genotype to ensure preanalysis selection of an analysis model. ANCOVA was used to determine significant associations between SNP and MTX-PG levels. For SNP, estimated marginal means + standard error are reported. SNP in dominant model were ITPA rs1127354, AMPD1 rs17602729, ABCC4 rs2274407, and ABCC2 rs717620. SNP in recessive model were ABCC1 rs35592, ABCC4 rs868853, FPGS rs4451422, and SLC19A1 rs1051266. Other SNP were analyzed as an additive model. All SNP were corrected for age and sex.
It was not possible to test the influence of MTX dose in the separate cohorts because MTX dose was registered at 25 mg/week in the validation cohort and there was low variation in the derivation cohort. To evaluate dose as potential determinant, both cohorts were combined. MTX dose was entered in an ANCOVA together with age, sex, erythrocyte folate, and FPGS rs4451422.
Multiple testing was not corrected for, as the included variables in our study were carefully chosen for an expected relation to MTX-PG based on the literature and physiology. Statistical analyses were done with SPSS PASW 20.0.0.1 for Windows (SPSS Inc.) unless stated otherwise. P values less than 0.05 were considered significant.
RESULTS
Patient characteristics
Ninety-three out of 102 patients from the derivation cohort and 247 out of 285 patients from the validation cohort could be included in our study. The remaining patients were excluded because there was no erythrocyte pellet sample for MTX-PG measurement at 3 months.
The derivation and validation cohorts were very similar for most baseline characteristics (Table 1). In the derivation cohort, a smaller percentage of patients used HCQ (44.7% vs 58.4%, p = 0.32), SSZ (35.3% vs 58.4%, p < 0.001), and corticosteroids (12.9% vs 89.1%, p < 0.001). Disease Activity Score at 28 joints was lower in the derivation cohort (4.1 vs 4.7), and the derivation cohort had slightly higher eGFR-MDRD (88.1 ml/min/1.73m2 vs 80.7 ml/min/1.73m2, p < 0.05) and erythrocyte folate content (1075.7 nmol/l vs 925.5 nmol/l, p < 0.001) than the validation cohort. Treatment dose of MTX was significantly different between the cohorts (p < 0.001). Patients in the derivation were treated with 15 mg/week and patients in the validation were treated with 25 mg/week as per study protocol.
Baseline characteristics of MTX-R and tREACH cohorts.
MTX-PG levels
After 3 months of MTX treatment, median [interquartile range (IQR)] MTX-PG concentrations in the derivation cohort were 33.8 (22.7–61.6), 23.1 (17.2–31.6), 39.8 (24.8–53.6), 8.4 (4.2–17.3), 1.0 (0.0–2.8) nmol/l for MTX-PG1 to MTX-PG5, respectively, and 79.0 (49.3–106.0) nmol/l for total MTX-PG (Figure 1a). In the validation cohort, median (IQR) MTX-PG concentrations were 30.0 (19.8–47.4), 21.2 (15.9–27.4), 49.0 (36.5–61.4), 20.0 (11.4–30.2), 4.7 (2.0–9.3) nmol/l for MTX-PG1 to MTX-PG5, respectively (Figure 1a), and 97.9 (71.6–125.3) for total MTX-PG. MTX-PG1 did not differ between the derivation cohort and the validation cohort despite the difference in MTX dose between cohorts (Table 1). Median MTX-PG2 concentrations were slightly, but significantly higher in the derivation cohort than in the validation cohort (p = 0.015). In contrast, median MTX-PG3, MTX-PG4, MTX-PG5, and total MTX-PG were significantly lower in the derivation cohort than in the validation cohort (p < 0.001 for MTX-PG3-5 and total MTX-PG; Figure 1a).

A. Concentrations of the separate MTX-PG in the derivation (white bars, n = 93) and validation (grey bars, n = 247) cohorts. Brackets denote significant differences between cohorts. P values are noted above the brackets. MTX-PG2 is significantly lower in the validation cohort, while MTX-PG3, MTX-PG4, and MTX-PG5 are higher in the validation cohort. Significant differences were tested with Mann-Whitney U test. B. Effect of MTX dosage on the concentration of total MTX-PG in the combined cohort. Increased dose of MTX leads to increased total MTX-PG. ANCOVA was adjusted for age, sex, erythrocyte folate, and rs4451422 in the FPGS gene. P values are from the confounder adjusted data. Boxplots are from unadjusted data. *p < 0.05. **p < 0.001. MTX: methotrexate; PG: polyglutamate; RBC: red blood cell.
Determinants of MTX-PG
All variables listed in Table 1 were entered into a univariate linear regression model (Supplementary Table 1, available online at jrheum.com). Variables that obtained a p value < 0.2 in univariate linear regression were entered into a multivariate linear regression model (Table 2).
Clinical, sociodemographic, and biochemical determinants of erythrocyte MTX-PG levels at 3 months of treatment (multivariate analysis). Variables shown had p values < 0.1 in univariate analysis for at least 1 of the MTX-PG. All variables have been adjusted for age and sex. In addition, C-reactive protein was also adjusted for DAS28-ESR and albumin; erythrocyte folate for serum folate; albumin for C-reactive protein; homocysteine for erythrocyte folate; parenteral administration of MTX for coffee; vitamin B12 for erythrocyte folate; anti-CCP for prednisone route.
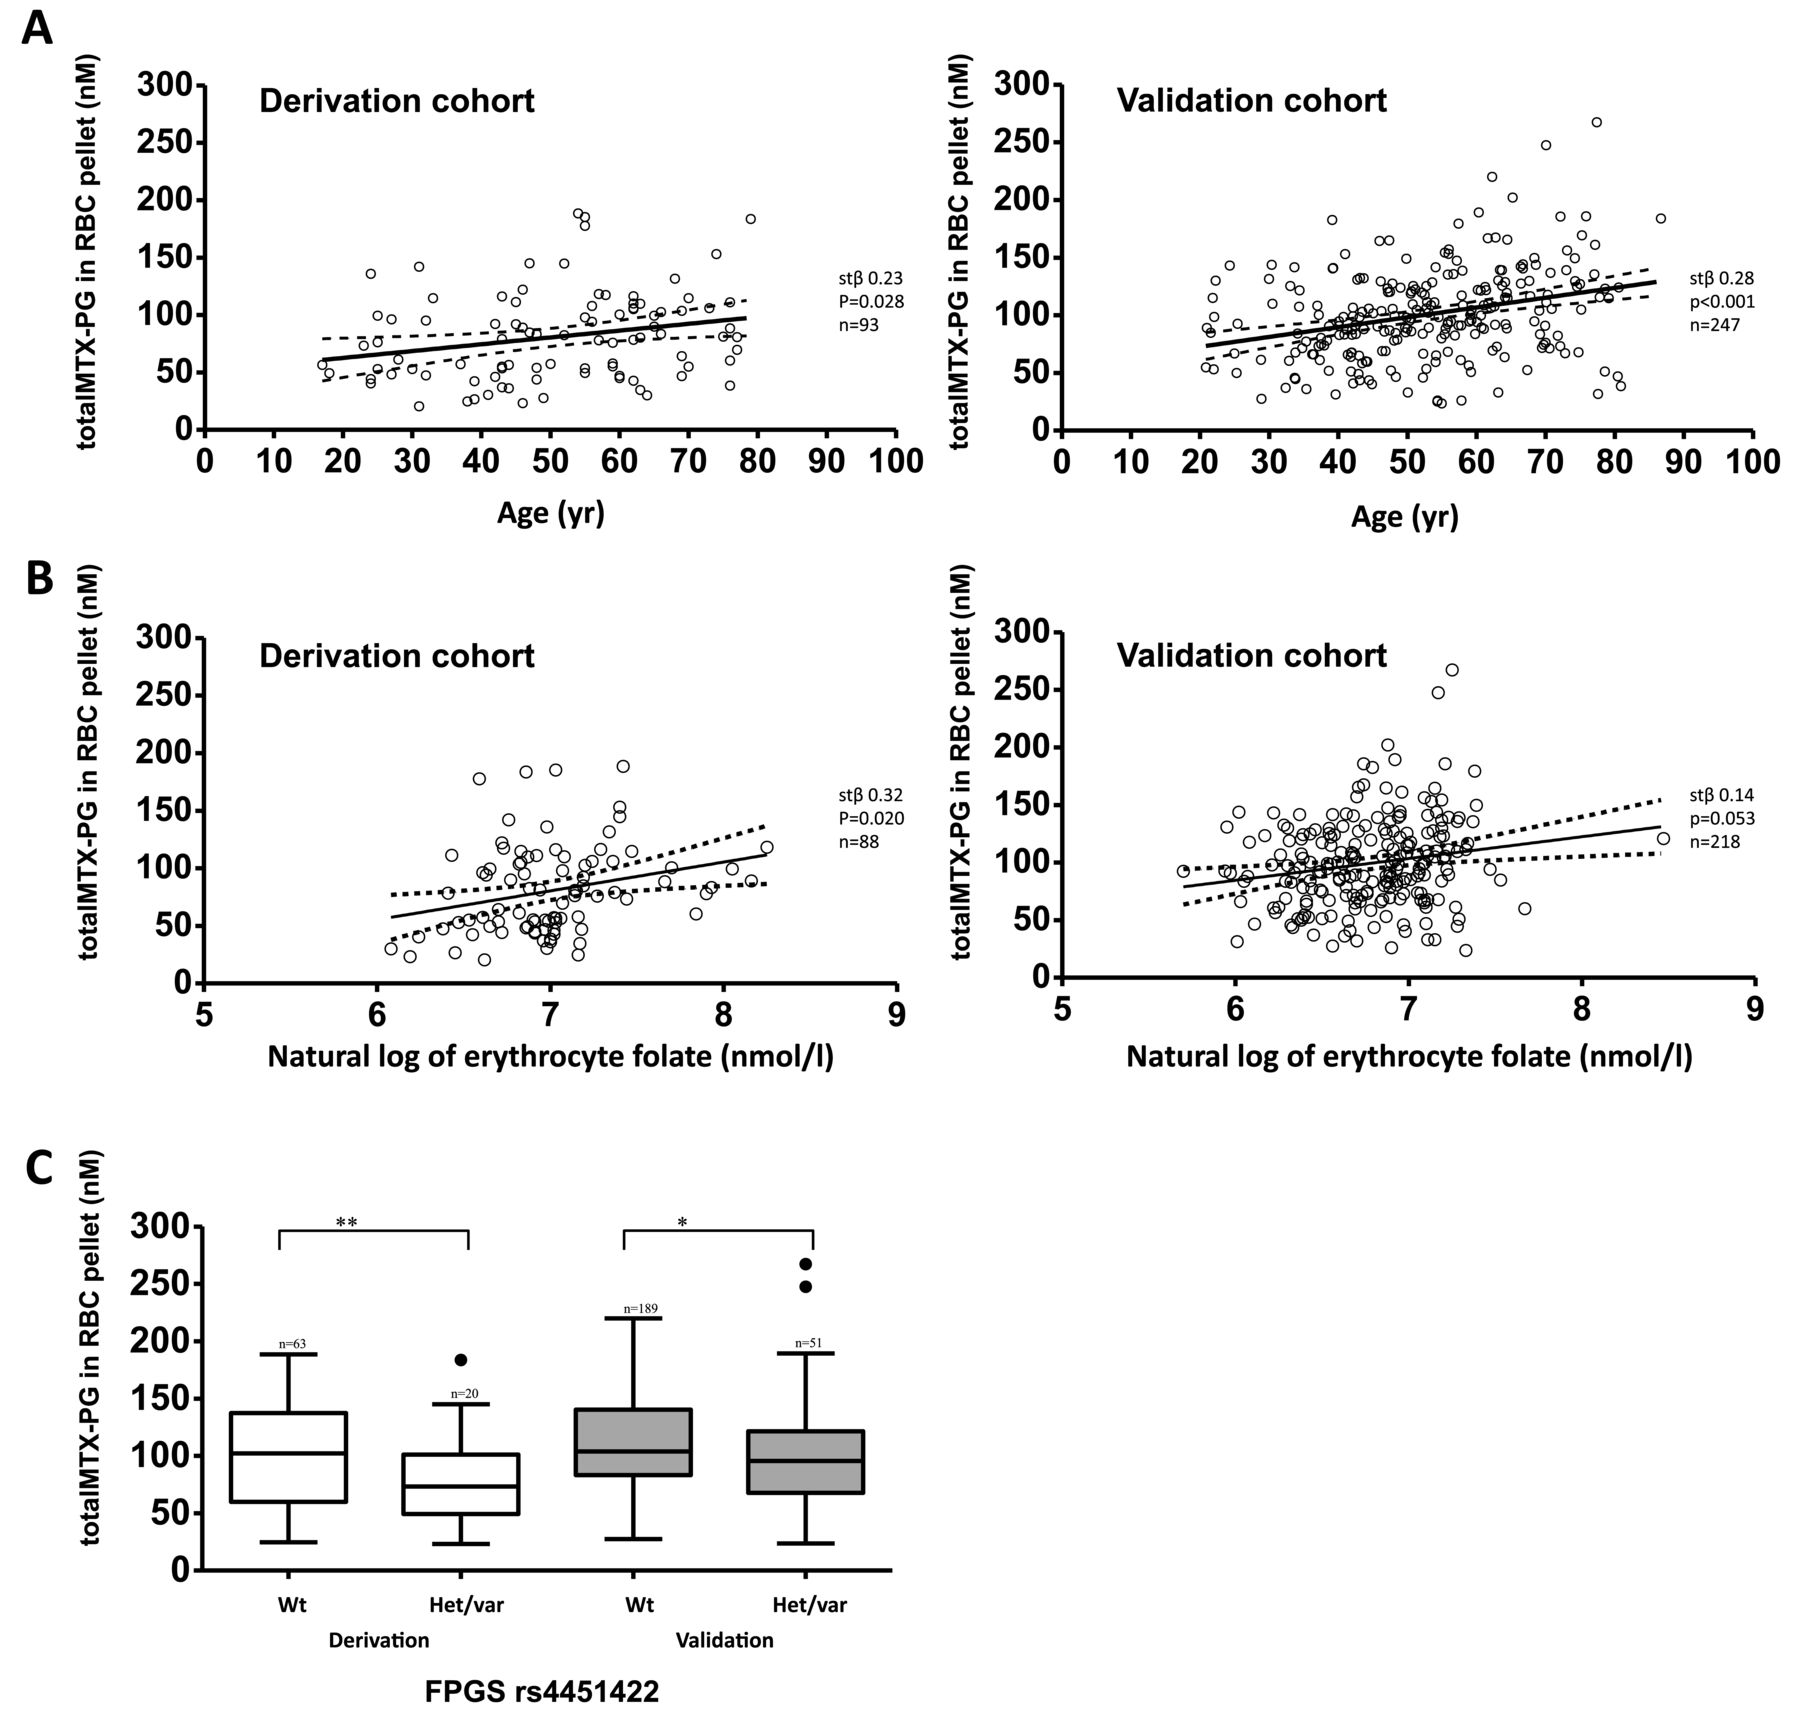
In multivariate analysis, in the derivation cohort, there was a positive association between age at start of treatment and levels of MTX-PG1 (stβ 0.23, p = 0.033) and total MTX-PG (stβ 0.23, p = 0.018), while exhibiting a trend for MTX-PG2 (stβ 0.18, p = 0.098) and borderline significance for MTX-PG3 (stβ 0.21, p = 0.052; Table 2). This finding was replicated in the validation cohort for all MTX-PG (MTX-PG1: stβ 0.13, p = 0.04; MTX-PG2: stβ 0.21, p = 0.001; MTX-PG3: stβ 0.22, p < 0.001; MTX-PG4+5: stβ 0.25, p < 0.001; and total MTX-PG: stβ 0.28, p < 0.001; Figure 2a). Erythrocyte folate was positively associated with levels of MTX-PG3 (stβ 0.32, p = 0.021) and total MTX-PG (stβ 0.32, p = 0.022) while exhibiting a trend for significance for MTX-PG4+5 (stβ 0.24, p = 0.099) in the derivation cohort. This was replicated in the validation cohort for MTX-PG3 levels (stβ 0.15, p = 0.04) and there was a trend toward significance for MTX-PG4+5 levels (stβ 0.13, p = 0.087) and total MTX-PG levels (stβ 0.14, p = 0.053; Figure 2b). Also, in the derivation cohort, there were positive associations between serum folate concentration and MTX-PG1 levels (stβ 0.32, p = 0.002), and between CRP concentration and levels of MTX-PG1 (stβ 0.29, p = 0.043) and MTX-PG2 (stβ 0.32, p=0.022). These findings were not replicated in the validation cohort.

A. Linear regression of age and total MTX-PG. Solid line represents a trend line with its 95% CI (dotted line). In both cohorts, age is positively associated with total MTX-PG. Regression analysis is plotted from the unadjusted data. Stβ and p values are from the confounder adjusted data. B. Linear regression of erythrocyte folate and total MTX-PG. Solid line represents a trend line with its 95% CI (dotted line). In both cohorts, age is positively associated with total MTX-PG. Regression analysis is plotted from the unadjusted data. Stβ and p values are from the confounder adjusted data. C. Effect of the FPGS rs4451422 variant allele on the concentration of total MTX-PG. Patients of the FPGS rs4451422 heterozygous and homozygous genotype have significantly lower concentrations of total MTX-PG. ANCOVA was adjusted for age and sex. Brackets denote significant differences between groups. P values are noted above the brackets. *p < 0.05. **p < 0.001. MTX: methotrexate; PG: polyglutamate; FPGS: folylpolyglutamate synthase; RBC: red blood cell; Wt: wild-type carriers; het/var: heterozygous combined with homozygous variant carriers.
In the validation cohort, male patients had higher total MTX-PG levels than female patients (0.14, p = 0.027), and homocysteine levels were positively associated with MTX-PG4+5 levels (stβ 0.20, p = 0.007). These findings were not found in the derivation cohort.
SNP analysis
A total of 28 SNP in 18 MTX pathway genes were assessed for their contribution to MTX-PG levels (Table 3; Supplementary Table 2, available online at jrheum.com). With the exception of ABCB1 rs2032582 (chi-square = 299.36, p < 0.001) and MTHFR rs1801133 (chi-square = 5.46, p = 0.019), all SNP were in Hardy-Weinberg equilibrium. SNP not in Hardy-Weinberg equilibrium were entered into linear regressions as normal.
SNP within cellular folate transport and metabolism routes in relation to MTX polyglutamate levels at 3 months of treatment in MTX-R and tREACH cohorts. Analysis was done using ANCOVA with correction for age and sex. Only SNP with a significant correlation with any MTX-PG in the derivation or validation cohort are shown (full table in Supplementary Table 2, available online at jrheum.com).
In the derivation cohort, patients with the FPGS rs4451422 wild-type genotype had significantly higher levels of MTX-PG3 (p = 0.001), MTX-PG4+5 (p = 0.004), and total MTX-PG (p < 0.001; Table 3, Figure 2c). This was replicated in the validation cohort for MTX-PG3 (p = 0.049), MTX-PG4+5 (p = 0.043), and total MTX-PG (p = 0.015; Table 3, Figure 2c). Also, patients with the SLC46A1 rs2239907 wild-type or heterozygous genotype had significantly lower MTX-PG2 (p = 0.031) levels in the derivation cohort; this was replicated in the validation cohort for MTX-PG1 (p = 0.012).
In the derivation cohort, significant positive correlations were also found for ITPA rs1127354 and MTX-PG4+5 levels (p = 0.024); ABCC5 rs2139560 and MTX-PG1 levels (p = 0.001), and MTX-PG2 levels (p = 0.022); ATIC rs2372536 and MTX-PG1 levels (p = 0.008); ABCB1 rs1045642 and MTX-PG1 (p = 0.029), MTX-PG2 (p = 0.001), MTX-PG3 (p = 0.012), and total MTX-PG (p = 0.011) levels. A significant negative correlation was found for ABCC1 rs35592 and MTX-PG3 (p = 0.021). None of these results were replicated in the validation cohort.
In the validation cohort, significant positive associations were found for AMPD1 rs17602729 and MTX-PG2 levels (p = 0.015); ABCC1 rs3784862 and MTX-PG1 levels (p = 0.014); MTHFR rs1801131 and MTX-PG1 levels (p = 0.031); ABCC3 rs3785911 and MTX-PG4+5 (p = 0.004), and total MTX-PG levels (p = 0.029); ABCC3 rs4793665 and MTX-PG1 levels (p = 0.038). A significant negative correlation was found for ABCC4 rs868853 and MTX-PG1 levels (p = 0.038). These results were not observed in the derivation cohort.
Combined multivariate model
The significant variables present in both cohorts and their confounders were included in 1 multivariate regression model. The included variables were age, erythrocyte folate, and FPGS rs4451422. Confounders included were sex and serum folate. In the derivation cohort, this combined model explained 14% of MTX-PG1 variability, 4% of MTX-PG2 variability, 21% of MTX-PG3 variability, 11% of MTX-PG4+5 variability, and 21% of total MTX-PG variability (Table 4). However, in the validation cohort, the model explained 0% of MTX-PG1 variability, 3% of MTX-PG2 variability, 7% of MTX-PG3 variability, 7% of MTX-PG4+5 variability, and 10% of total MTX-PG variability.
Multivariate regression model of the 3 strongest determinants. Variables that after correction for confounders had a significant correlation in both cohorts were included in 1 multivariate regression model. FPGS rs4451422 was dichotomized into wild type versus heterozygous/variant. Correlations with p < 0.05 are considered significant. Confounders are not shown and were serum folate (for erythrocyte folate) and sex (for FPGS rs4451422).
MTX dose
Because the variation in MTX dosage in each cohort was insufficient to adequately determine the influence of treatment dose on MTX-PG concentration, the effect of dosage was studied by grouping both cohorts and comparing the different treatment doses. Multivariate regression analysis was performed using age, sex, erythrocyte folate, and FPGS rs4451422 as covariables. Treatment dose did not have a significant association with MTX-PG1. However, treatment dose had a positive association with MTX-PG3 levels (stβ 0.23, p < 0.001), MTX-PG4+5 levels (stβ 0.30, p < 0.001), and total MTX-PG levels (stβ 0.20, p = 0.002; Figure 1b). Strikingly, there was a negative association with MTX-PG2 levels (stβ −0.22, p < 0.001). The model including dose explained 1% of MTX-PG1 variability, 8% of MTX-PG2 variability, 15% of MTX-PG3 variability, 15% of MTX-PG4+5 variability, and 16% of total MTX-PG variability in the combined cohort.
DISCUSSION
To the best of our knowledge, we are the first to report the clinical, genetic, sociodemographic, and biochemical determinants of erythrocyte MTX-PG accumulation at 3 months of low-dose MTX treatment in a prospective study using a derivation and validation cohort. In our study, we found age, MTX dosage, erythrocyte folate content, and the FPGS rs4451422 SNP as the major determinants of MTX-PG levels in both cohorts.
MTX is the “anchor drug” in the treatment of pediatric and adult arthritis because of its high efficacy, low cost, and good safety profile. Its use is hampered because 20–40% of patients are nonresponsive to treatment and 30% of patients encounter adverse events1,2. To further improve efficacy and reduce toxicity, personalized treatment is mandatory by prescribing patients the right drug in the right concentration2,35. The dosage of MTX required to suppress disease activity varies among patients, and TDM of low-dose MTX therapy is not yet possible because plasma MTX is rapidly cleared and is unrelated to response4,36. This has led to a trial-and-error approach in finding the right MTX dose for patients with RA. However, intracellular MTX can be measured15,37,38, and we have shown in 3 prospective cohort studies in RA and JIA39,40 that erythrocyte MTX-PG levels predict response in the first 9 months of treatment. Knowing the determinants of MTX-PG accumulation and the cutoff concentration that predicts good response with good sensitivity and specificity might help with targeting treatment for the individual patient to reach the optimal MTX-PG level. TDM of MTX therapy may also help to identify patients who do not comply or partially comply with treatment.
In concordance with previous findings18, we found age as the predominant determinant for erythrocyte MTX-PG levels, with increasing age leading to increased concentrations of long-chain and total MTX-PG (Figure 2a). Although reduced renal function is likely an important part of this complex interaction, eGFR-MDRD and creatinine levels did not have a significant effect on MTX-PG levels in either of our cohorts. More extensive research is needed to find the underlying interactions.
Previous studies have shown that dose is a driving factor for the accumulation of MTX-PG18,19,41. In our study, the validation cohort had elevated MTX-PG3, MTX-PG4, and MTX-PG5 levels, but lower MTX-PG2 levels than the derivation cohort (Figure 1a). This difference in MTX-PG levels between cohorts is likely caused by the difference in dose as the cohorts had significantly different dosing regimens (Table 1).
However, in our cohorts, there was too little variation in dosage to be able to demonstrate and validate a relation between MTX dosage and erythrocyte MTX-PG accumulation in each cohort. Therefore, we studied the effect of MTX dosage on erythrocyte MTX-PG accumulation by grouping both cohorts and comparing the treatment doses. Using multivariate analysis, we confirmed that the differences in MTX-PG concentration between our cohorts were largely attributable to the difference in dose. Patients treated with 25 mg/week had 61% higher concentrations of long-chain MTX-PG and 18% higher concentrations of total MTX-PG (Figure 1b) than did patients treated with 15 mg/week or less. Interestingly, the group that was treated with higher MTX dosage had 21% lower short-chain MTX-PG levels, possibly indicating that the addition of glutamate groups occurs at a higher rate than the removal of the glutamate groups, which would lead the high exposure to MTX to push the equilibrium toward long-chain MTX-PG.
In our validation cohort, strict protocols were applied to comedication (Table 1). Therefore, we cannot conclusively dismiss the effect of comedication on the accumulation of MTX-PG. Corticosteroid supplementation, especially, was very strongly correlated to MTX dose. However, none of the comedications had significant associations with MTX-PG levels and when entered as covariables in multivariate linear regression, they had no effect on the association.
In addition to dose of treatment, route of administration has been shown to affect MTX-PG levels12,19. The effective dose of subcutaneous administration would be substantially higher because of the increased bioavailability. In our cohorts, only 7% of the derivation cohort and none of the patients from the validation cohort received subcutaneous MTX, and we did not see an effect of route of administration on the MTX-PG levels. This is likely attributable to the small number of patients who received subcutaneous MTX, and we expect this to have a stronger effect when more patients are treated with subcutaneous MTX.
Folic acid use during MTX treatment has no or negative effects on MTX efficacy42,43, suggesting that higher concentrations of folate during MTX treatment facilitate lower effectiveness of MTX owing to competition with folate for transporter proteins, polyglutamylation proteins, and target enzymes. However, we showed in 2 prospective RA cohorts that high baseline erythrocyte folate was related to response to MTX44. We speculated that patients with higher concentrations of baseline erythrocyte folate may be more effective in accumulating intracellular MTX because of the high structural similarity of MTX to folate; MTX uses the same cellular machinery for uptake, transport, and metabolism. Baseline erythrocyte folate might be viewed as a functional marker for the capacity to take up and accumulate folates, thereby predicting MTX accumulation during treatment. In support of this hypothesis, we show that higher baseline erythrocyte folate levels are associated with higher levels of MTX-PG. We also found that higher baseline serum folate levels were associated with higher MTX-PG1 levels in the derivation cohort, although not in the validation cohort, which may reflect improved takeup of MTX from the intestine.
It might be speculated that the observed relation between age and MTX-PG levels is caused by changes in folate with age. However, although age and baseline erythrocyte folate levels are correlated in both cohorts (derivation cohort r = 0.229, validation cohort r = 0.177), the relation between age and MTX-PG did not change when erythrocyte folate or serum folate was included in the model as variable, suggesting that age has a distinct effect on MTX-PG accumulation. In our present study, baseline erythrocyte folate was significantly lower in the validation cohort, whereas this cohort accumulated the highest MTX-PG levels owing to the much higher doses (25 mg/week). The difference in baseline erythrocyte folate between cohorts might be explained by the slightly higher disease activity in the validation cohort; the higher activity of the immune system in patients with higher disease activity might lead to higher folate use, leading to a lower baseline erythrocyte folate in the validation cohort.
Folylpolyglutamate synthetase has a central role in the metabolism of MTX, as it is the enzyme that attaches the glutamate groups to MTX, creating the MTX polyglutamates. Any changes in function might therefore dramatically decrease the longer chain MTX-PG, thereby leading to a slower buildup of MTX-PG and lower steady-state concentrations, which in turn can lead to decreased response to medication45. In our study, we see this effect most strongly in the derivation cohort, where medium chain and long chain MTX-PG, as well as total MTX-PG, are significantly lower (Table 3) in patients with the heterozygous or homozygous variant genotype of FPGS rs4451422. In the validation cohort, the effect is less prominent, with smaller differences in concentrations between genotypes. The higher MTX dosage in the validation cohort might partially override the genetic determinants46, leading to a decreased influence of this genotype. This could indicate that patients with the homozygous variant genotype would benefit from an increase in MTX dose, thereby possibly lowering the time needed for patients to achieve optimal treatment and might prevent needless switching to the more expensive biological.
We also found SLC46A1 rs2239907 to be significantly associated with MTX-PG in both cohorts. SLC46A1 is a proton-coupled folate transporter that is responsible for the intestinal uptake of folate. Patients with the SLC46A1 rs2239907 homozygous variant allele have significantly higher concentrations of short-chain MTX-PG than patients with the wild-type allele. This could correspond to an increased uptake of MTX, which would lead to higher plasma MTX levels and increased exposure of the bone marrow to MTX. Similar to previous studies, the associations of SNP to MTX-PG are weak. In other studies, polymorphisms in the GGH and SLC19 genes have been found to influence the long-chain MTX-PG levels6,8. In our cohorts, there was no significant association of GGH or SLC19 SNP in the derivation cohort, although there was an effect on long-chain MTX-PG in the validation cohort. To our knowledge, we are the first to publish an extensive overview of the effect of SNP in the MTX pathway on intracellular MTX accumulation using a prospective derivation and validation cohort, and linking FPGS rs4451422 and SLC46A1 rs2239907 to MTX-PG accumulation in both cohorts.
Previous research also found dose of MTX, route of administration, age, and renal function15,18,19,41 to be strongly associated with MTX-PG levels. In concordance with this data, we found MTX dose and age to be strong determinants. However, renal function was not significantly associated with MTX-PG levels in our cohorts. The discrepancy between results from previous studies and our study can be partially explained by the cross-sectional cohorts that were used in previous studies. In our study, patients were prospectively followed while other studies used patients that were treated with MTX for up to 19 years6,8,18,19,41. The MTX-PG accumulation over such a long period would be very different, mostly in steady state, and possibly controlled by different determinants. Previous studies also used patients treated with a relatively low dose of MTX, comparable to the derivation cohort in our study. The validation cohort uses an almost 2-fold higher MTX dose, which might override some of the biological and genetic determinants, thereby leading to other significant determinants of MTX-PG. Despite strong correlations, the determinants found in our study explained only up to 21% of the variability in the derivation cohort, and even less in the validation cohort (up to 10%). This was also seen in the combined cohort, where only up to 16% of variability (MTX-PG2–5) was explained by the model, including dose of treatment. This indicates that there are other undiscovered factors that influence the MTX-PG status. One possibility could be alternative splicing of FPGS, which has been shown to influence response to MTX in leukemia cell lines47. Alternative splicing leads to loss of function of FPGS, resulting in a different polyglutamation status and loss of MTX retention in the cell. Another possibility could be differences in methylation, causing differences in expression of the folate pathway genes, thereby leading to variation in MTX uptake, or polyglutamation.
To the best of our knowledge, our study is the first prospective study investigating the determinants of intracellular MTX-PG using a derivation and validation cohort. We found that higher age, higher erythrocyte folate concentration, higher MTX dose, and the FPGS rs4451422 wild-type variant all lead to higher accumulation of medium and long-chain MTX-PG. Knowing these determinants might help target treatment for the individual patient.
ONLINE SUPPLEMENT
Supplementary data for this article are available online at jrheum.org.
Footnotes
-
Supported by treatment in Rotterdam Early Arthritis Cohort (tREACH): Unrestricted grant from Pfizer bv. (0881-102217). RDJ: Dutch Arthritis Association (06-02-402 and 09-1-402).
- Accepted for publication July 8, 2014.
REFERENCES
- 1.
- 2.
- 3.
- 4.
- 5.
- 6.
- 7.
- 8.
- 9.
- 10.
- 11.
- 12.
- 13.
- 14.
- 15.
- 16.
- 17.
- 18.
- 19.
- 20.
- 21.
- 22.
- 23.
- 24.
- 25.
- 26.
- 27.
- 28.
- 29.
- 30.
- 31.
- 32.
- 33.
- 34.
- 35.
- 36.
- 37.
- 38.
- 39.
- 40.
- 41.
- 42.
- 43.
- 44.
- 45.
- 46.
- 47.