

Abstract
Objective. To investigate the associations of alcohol consumption and radiographic disease progression in African Americans with recently diagnosed rheumatoid arthritis (RA).
Methods. Patients with RA included in the study were participants in the Consortium for the Longitudinal Evaluation of African Americans with Early Rheumatoid Arthritis (CLEAR) registry. Patients were categorized based on self-reported alcohol consumption; those consuming < 15 beverages per month versus those with ≥ 15 per month. Association of radiographic disease progression over a 1-year to 3-year period of observation with alcohol consumption was evaluated using multivariate generalized estimating equations.
Results. Of 166 patients included in the study, 39% reported that they had never consumed alcohol. Of the 61% who had consumed alcohol, 73% reported that they consumed on average < 15 alcoholic beverages per month and 27% reported consuming ≥ 15 per month. In multivariate analysis, consumption of ≥ 15 alcoholic beverages per month was associated with an increased risk of radiographic disease progression (p = 0.017). There was no evidence of a relationship in those consuming < 15 beverages per month (p = 0.802).
Conclusion. There appears to be a dose-dependent relationship between alcohol use and radiographic disease progression in RA. Individuals who consume 15 or more alcoholic beverages per month may have faster rates of radiographic joint damage than those with lower levels of consumption.
African Americans with rheumatoid arthritis (RA) are a historically understudied population. However, recent efforts have begun to closely examine disease characteristics and risk factors within this group. An example is studies of tobacco use in African Americans with RA1,2. Investigators have identified an increased risk of both autoantibody-positive and autoantibody-negative RA in African Americans who smoke tobacco. Further, certain genetic variations, including HLA-DRB1 shared-epitope and N-acetyltransferase polymorphisms, have been shown to potentiate smoking risk within this group of patients1,2. The complexity of RA, however, warrants investigation into other risk factors that may also be involved in the disease process. Alcohol consumption, for example, is a modifiable exposure that to our knowledge has not yet been studied in African Americans with RA.
To date, observational studies investigating the risk of RA associated with alcohol consumption have predominantly involved cohorts of European ancestry. Results from these studies suggest that low to moderate alcohol consumption is associated with a lower risk of developing RA3,4,5. However, a large prospective cohort evaluating 31,336 older women from Iowa found no such association between alcohol use and the risk of developing later-onset RA6. Differences in findings from these studies may reflect varying levels of alcohol consumption between European and American cohorts.
Indeed, studies employing animal models of RA have shown that alcohol may exert paradoxical dose-dependent effects on disease pathogenesis. In select animal studies, investigators observed antiinflammatory effects associated with alcohol intake characterized by lower levels of circulating proinflammatory cytokines, including interleukin 6 (IL-6) and tumor necrosis factor-α (TNF-α)7,8. Other studies, however, have shown that these antiinflammatory effects may not be sustained with larger quantities of alcohol consumption9,10. A study comparing heavy drinkers with alcoholic liver disease to healthy controls with low/moderate levels of consumption found that proinflammatory circulating TNF-α levels were higher in the heavy alcohol consumption group10. Body mass index (BMI), however, was not controlled for in the analysis, and it may also influence TNF-α levels11. Based on these studies it is reasonable to infer that inflammatory cytokine levels may differ in patients with RA based on variability in alcohol intake, and this variability could be reflected in disease activity levels.
A limited number of studies have examined disease progression in relation to alcohol consumption in patients with RA. A study investigated alcohol use and associations with radiographic progression in a European cohort with RA. This study demonstrated that low to moderate alcohol consumption was protective against radiographic erosions, but that heavy consumption was associated with worse radiographic outcomes12, consistent with the aforementioned biologic studies. It is difficult to conclude whether these results are generalizable to other cohorts. To date, to our knowledge there have been no studies investigating radiographic disease progression associated with alcohol consumption in African Americans with RA.
Although studies in African American cohorts have been limited, the potential effects may be particularly relevant because alcohol consumption appears to yield differing health effects in African Americans compared to whites in the context of other inflammatory diseases13,14,15,16,17. Because of this, we sought to investigate whether similar effects of alcohol consumption are applicable in African Americans with RA. Specifically, our aim was to determine whether alcohol consumption in African Americans is associated with radiographic disease progression during the early stages of RA.
MATERIALS AND METHODS
Patient population
Study participants were part of the Consortium for the Longitudinal Evaluations of African Americans with Early Rheumatoid Arthritis (CLEAR) registry18. All subjects self-reported African American race and satisfied the American College of Rheumatology (formerly, the American Rheumatism Association) 1987 classification criteria for RA19, and had 2 years or less disease duration from the initial onset of symptoms. Patients were enrolled from 5 participating academic medical centers in the southeastern United States (University of Alabama at Birmingham, Emory University, University of North Carolina, Washington University, and the Medical University of South Carolina).
Patients with RA were enrolled between 2002 through 2005. At baseline, subjects received a complete history and physical examination and were asked to complete a participant questionnaire to gather demographic, diet, and general health information. Patients were then reevaluated 3 years (1 to 3 years after enrollment) after disease onset using evaluations similar to those at enrollment. Because duration of followup varied among participants, followup time was controlled for in all analyses to limit potential confounding.
The study was approved by the institutional review boards at each of the participating centers. All participants involved in the study provided written informed consent.
Outcome and exposure measures
Radiographic disease progression was the primary outcome measure for our study. Radiographs of the hands, wrists, and feet were collected at baseline and 3 years from disease onset. Radiographs were read with a known order of time. A modified Sharp/van der Heijde score (SHS)20 was then computed by a single blinded observer using joint space narrowing and erosions totals as described21. SHS progression was than calculated by subtracting the baseline SHS from the followup SHS.
A detailed history of alcohol and tobacco use was collected at enrollment. Subjects were categorized into 2 groups: those who reported either current or past use of alcohol, and those who reported no history of alcohol use. Patients with a history of alcohol use provided the number of alcoholic beverages they consumed, on average, within a 1-month timeframe. The questionnaire did not define specific alcohol quantities or volumes that constituted a given alcoholic beverage. Smoking status was defined as never, former, and current. Never-smokers were those who reported < 100 cigarettes in their lifetime. Former smokers were those who smoked > 100 cigarettes in their lifetime but who quit smoking prior to enrollment. Current smokers were those who reported smoking > 100 cigarettes and who continued to smoke at the time of enrollment.
Demographic information including age, sex, and disease duration were collected at enrollment. Height and weight were also included to calculate body mass index (BMI; kg/m2) and patients were asked to report their annual income range and level of completed education. We categorized self-reported disease-modifying antirheumatic drug (DMARD) therapy at enrollment into 6 groups: (1) biologic agents (anakinra, etanercept, and infliximab); (2) hydroxychloroquine; (3) methotrexate (MTX); (4) other DMARD (gold, penicillamine, sulfasalazine, leflunomide, azathioprine, cyclosporine, and cyclophosphamide); (5) combination therapy (patients concurrently receiving 2 nonbiologic DMARD); and (6) those not taking any of these therapies. Groups were not mutually exclusive. Adherence and medication dispensing data were not collected but surveys were completed by trained study personnel with knowledge of DMARD. Other biologics including adalimumab were not routinely available when the data were collected and therefore not included in the analysis. Because DMARD therapy was similar in the exposed and unexposed groups (Table 1) and because the number of patients taking biologics was very small (7 patients), we subsequently classified DMARD use as a dichotomous variable, comparing those receiving DMARD therapy versus those not receiving DMARD therapy for all subsequent analyses. Because of the potential risk-channeling bias, MTX and MTX combination therapy were also analyzed independently. Pain intensity was assessed by asking patients to rate their current level of pain (0 being no pain and 10 being the worst pain possible). Anticyclic citrullinated peptide antibody (anti-CCP) positivity, rheumatoid factor (RF) IgM positivity, HLA-DRB1 shared-epitope (SE) positivity, and C-reactive protein (CRP) were also collected as described22,23,24.
Demographics at baseline in African American patients with rheumatoid arthritis (n = 166).
Statistical analysis
Variations in patient characteristics at enrollment (age, disease duration, sex, education, income, DMARD use, MTX use, combination MTX use, HLA-DRB1 SE, anti-CCP antibody, and RF status) were compared for those with no history of alcohol and those who reported alcohol use using chi-square test for dichotomous variables and ANOVA for continuous variables.
The relationship of SHS and alcoholic beverages per month was initially examined using a running-line least-squares smoothing function as depicted in Figure 1. Upon visualization, it was clear that a natural break with an inflection in slope (checkmark-shaped curve) was observed at ∼15 alcoholic beverages per month. Patients were subsequently subcategorized into 2 groups based on consumption using a linear spline function with a knot at this break point. The low alcoholic beverage consumption group was defined as those consuming fewer than 15 drinks per month including the nondrinker group and the heavier alcohol consumption group was defined as those who consumed at least 15 drinks per month. Radiographic disease progression (SHS scores) from baseline to Year 3 from disease onset were then compared between the 2 groups using generalized estimating equation (GEE) methods. A cutoff of 2 SD from the mean was used to identify outliers and all subsequent analyses were repeated with the outliers excluded.
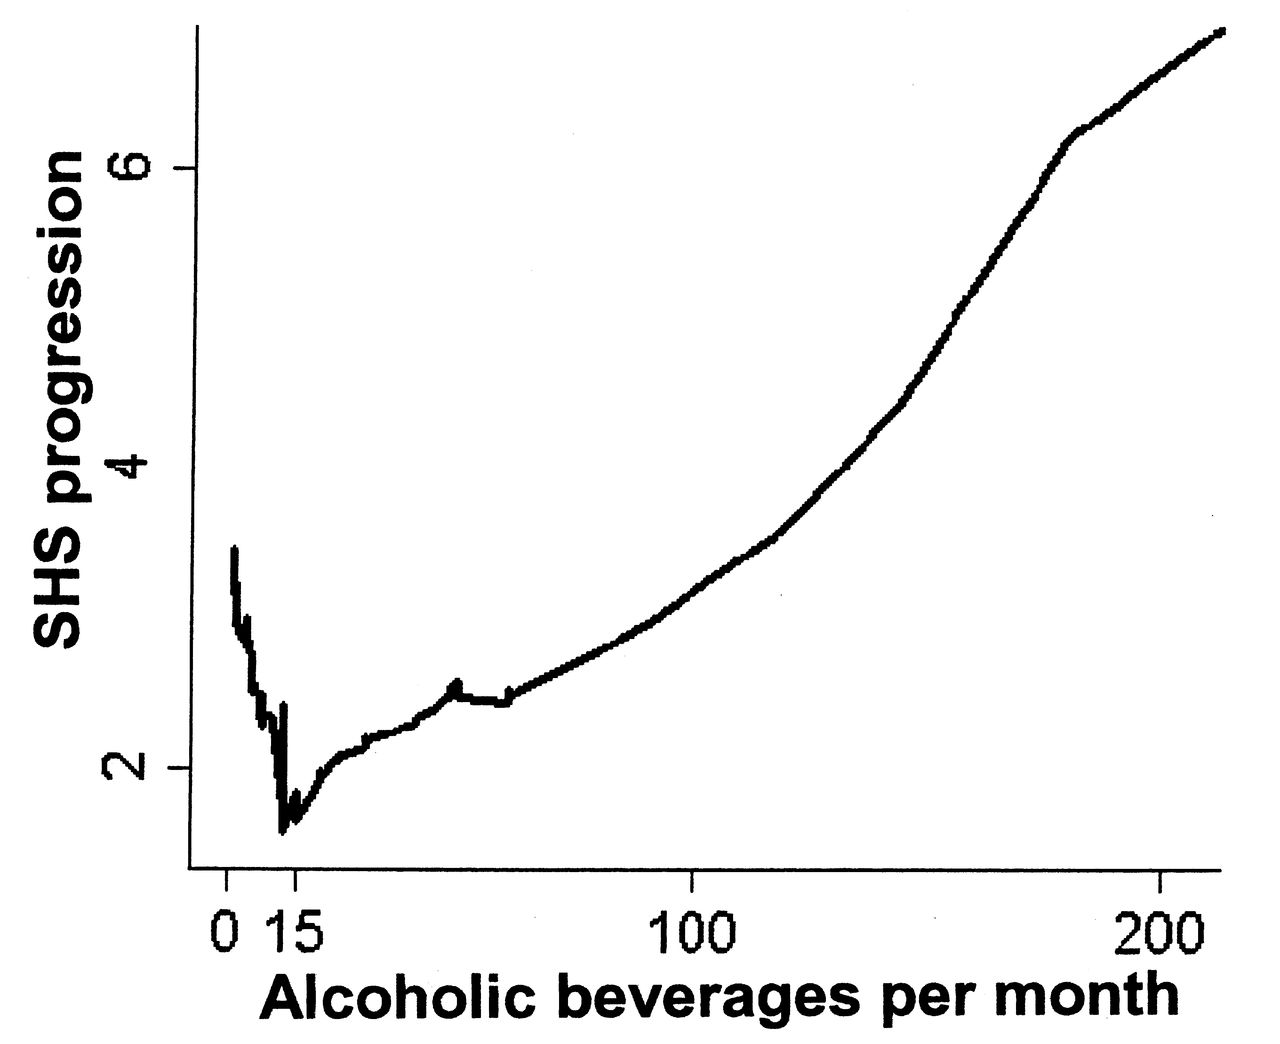
Radiographic disease progression, from baseline to a second timepoint 3 years from disease onset, as measured by modified Sharp/van der Heijde score (SHS progression) is summarized based on the average number of alcoholic beverages consumed per month. An inflection point occurs at 15 alcoholic beverages per month. Each alcoholic beverage consumed, on average, below 15 drinks per month has a progressively lower SHS change from baseline to followup, while each beverage consumed after 15 beverages per month has a progressively higher SHS change.
GEE models were structured using a first-order autoregressive correlation matrix to account for repeated measurements over time within the same individual. A quasi-likelihood under the independence model information criterion measure was calculated for competing correlation matrices to confirm the structure25. As described in a previous study using data from CLEAR, our dependent variable (SHS) contained non-negative integers with an overdispersed Poisson-like distribution, thus all GEE methods were fit with a negative binomial distribution26. Potential confounders were evaluated for an association with SHS using a univariate GEE model. Age, sex, disease duration, and covariates with a p < 0.10 in the univariate analyses were included in the multivariate model. Time from baseline (< 2 years disease duration) to second visit (3 years from disease onset) was also included in the final analyses (time lapse between visits) to control for varied followup time between patients. Collinearity was tested using condition indices. All covariates had condition indices < 30 and were therefore removed from the analysis. Lastly, because pain may be involved in the causal pathway and our study was not powered to assess for an interaction, 2 models were generated, one with and one without pain as a covariate. No differences were observed and so pain was excluded from the final analysis. Statistical significance was set at α = 0.05.
To determine whether high alcohol intake precluded taking MTX and to investigate potential channeling as a source of bias, we used a chi-square test to compare MTX use in the high alcohol group (≥ 15 beverages per month) versus the low alcohol group (< 15 beverages per month).
Missing data may have occurred if patients did not report an answer on the patient questionnaire or if there was an error when analyzing a blood sample. There were 4 patients (2.4%) who reported alcohol use but did not provide an average number of alcoholic beverages per month. Additionally there were 2 patients (1.2%) without CRP information, 2 (1.2%) with missing data precluding BMI calculation, 2 (1.2%) without IgM-RF results, and 1 (0.6%) missing anti-CCP antibody status. To mitigate bias arising from stepwise deletion and to accommodate for missing values, we imputed these data using multiple imputation by chained equations (ICE).
All statistical analyses were performed using Stata, version 10.1 (StataCorp., Stata Statistical Software).
RESULTS
There were 166 patients included in the analyses with a mean (± SD) age of 51 (13) years. Of these, 86% were women, 68% were anti-CCP antibody–positive, and 77% were RF-IgM-positive. There were 108 patients (65%) who were both anti-CCP–positive and RF-positive, 20 were RF-positive and anti-CCP–negative, and 4 were anti-CCP–positive and RF-negative. At enrollment, the average disease duration was 14 (7) months, there were 78% patients receiving DMARD therapy, and the average BMI was 32.1 (7.6).
Patient characteristics and demographics at enrollment are summarized in Table 1. Of patients included in the analysis, 39% reported that they had never consumed alcohol and 61% either currently consumed alcohol or consumed alcohol in the past. Alcohol consumers were more likely to report a history of cigarette smoking (p < 0.001) but were similar to non-consumers of alcohol in age, sex, and other demographics. DMARD therapy was similar in alcohol consumers and non-consumers (p = 0.961). As well, MTX use was similar between the 2 groups (p = 0.449) and was similar between those consuming ≥ 15 alcoholic beverages per month and those consuming < 15 per month (p = 0.735). There were 5 patients taking MTX plus biologic combination therapy and 18 patients on MTX plus hydroxychloroquine combination therapy. There was no significant difference between alcohol consumers and non-consumers taking any type of MTX plus DMARD combination therapy (p = 0.775).
Of those patients who consumed alcohol, 74 reported that they had, on average, fewer than 15 (mean 4.24 ± 3.61, range 1–12) alcoholic beverages per month and 27 reported that they had ≥ 15 (mean 66.61 ± 68.71, range 15–330) alcoholic beverages per month. The group consuming ≥ 15 alcoholic beverages per month had the highest SHS at baseline (mean 4.53 ± 7.31) and at the followup visit (mean 6.52 ± 10.86). SHS progression associated with monthly alcohol consumption is shown in Figure 1. The checkmark-shaped graph shows that each additional alcoholic beverage consumed from 0 to 14 beverages is associated with an increasingly lower SHS change from baseline to followup. With each additional alcoholic beverage ≥ 15 the trend reverses, increasing the SHS change from baseline to followup.
Associations of SHS with covariates in both univariate and multivariate analyses are summarized in Table 2. In the univariate analysis, education level was a significant predictor of SHS progression during the first 3 years of RA. Compared to those without a high school education, those with a bachelor’s degree had the least progression (p = 0.001), followed by those with a high school education and possibly some college (p = 0.030). Increased BMI was associated with significantly less SHS progression (p < 0.001) as was the use of DMARD therapy at enrollment (p < 0.001). Covariates associated with elevated SHS progression during the first 3 years of RA included anti-CCP antibody positivity (p < 0.001), IgM-RF positivity (p < 0.001), pain level (p < 0.001), and the time lapse between the baseline visit and the 3-year followup visit (p < 0.001). SHS progression was not associated with age, disease duration at enrollment, sex, income, HLA-DRB1 SE, CRP, or smoking status. There was a nonsignificant trend in unadjusted analyses of SHS progression per alcoholic beverage consumed (per month) in individuals consuming ≥ 15 alcoholic beverages per month (p = 0.075), but not in those consuming < 15 beverages per month (p = 0.931).
Association of modified Sharp/van der Heijde Score (SHS) during the first 3 years of rheumatoid arthritis and alcoholic beverage consumption at baseline in 166 African American patients. Results from generalized estimating equations model.
In the multivariate analysis, higher education level and DMARD therapy retained their protective effect, while increased BMI did not (Table 2). Anti-CCP antibody positivity, IgM-RF positivity, and the time lapse between the baseline visit and the 3-year followup visit remained significantly associated with SHS progression. Pain was excluded from the analysis as described; results for all other covariates were similar to those observed in univariate analysis. Among those consuming more than 15 alcoholic beverages per month, each additional beverage consumed was associated with a mean progression in SHS of 0.007 units (95% CI 0.001–0.013, p = 0.017). This was not apparent in those consuming fewer than 15 alcoholic beverages per month, where there was a nonsignificant mean change in SHS progression of −0.005 units (95% CI −0.041−0.031, p = 0.802). A single outlier was identified with an average consumption of 330 beverages per month. The analysis was repeated after removing the outlier, and the outcomes did not differ (data not shown).
DISCUSSION
We investigated the associations of alcohol in RA course using radiographic joint damage as the primary indicator of disease progression during the early stages of RA. To our knowledge, this is the first study to evaluate such associations in an African American cohort. Our findings suggest that individuals consuming more than 15 alcoholic beverages per month have significantly worse rates of radiographic disease progression with each additional alcoholic beverage consumed. This association was not evident in those consuming fewer than 15 beverages per month. The results therefore appear to reflect a somewhat paradoxical dose-dependent effect of alcohol in the natural course of RA. In the low consumption group, each additional alcoholic beverage per month has an increasingly more pronounced protective effect (albeit not statistically significant) until the 15th beverage is reached, at which point each additional beverage has an increasingly more severe rate of radiographic disease progression. Our results indicate that there might be a “checkmark-shaped” relationship with alcohol consumption and disease progression, as depicted in Figure 1.
This apparent paradoxical dose-dependent effect of alcohol coincides with findings from the Swiss Clinical Quality Management Project in Rheumatoid Arthritis12. Those investigators found that the rate of radiographic progression after 4 years of followup, compared with non-drinkers, was significantly less severe in occasional drinkers and daily drinkers but more severe in heavy alcohol drinkers. Although our results did not indicate a significant reduction in the rate of disease progression in the low-consumption group, they did trend in that direction. These slight differences might have arisen because we adjusted for BMI. In our cohort, increased BMI was not significantly associated with disease progression but trended toward having a protective effect. This is similar to other studies that have found that BMI has a robustly protective effect on radiographic disease progression27,28,29,30,31. If we had not adjusted for this it may have falsely shifted our results away from the null and incorrectly elevated our effect size.
Not all of the studies investigating RA disease progression have found worse disease in high alcohol consumption groups. A European case-control study demonstrated that radiographic disease severity was inversely associated with higher levels of alcohol consumption, but it is important to note that this was a cross-sectional component of the analysis3. It is possible that our results differed from these primarily because our study design allowed us to follow disease progression longitudinally over multiple visits. Further, the cutoffs for high alcohol consumption between studies differed. In the European group, the highest alcohol consumption group included everyone who consumed > 10 beverages per month. In our cohort, use of this cutoff would have potentially missed the stark change in the direction of disease progression we found in those consuming more than 15 beverages per month. By including individuals from both the unexposed group (i.e., < 15 beverages per month) and the exposed group (i.e., ≥ 15 beverages per month) we found that there may be a threshold limit approximating 15 alcoholic beverages per month where the adverse effects of alcohol may begin to accumulate and cause worsening degrees of disease progression in patients with RA.
Our results potentially agree with previously reported biological effects of alcohol. Levels of circulating TNF-α are elevated in chronic alcoholics, presumably heavy drinkers, because of increased cellular expression of Toll-like receptors9. Similarly, IL-6 is elevated with moderate to high alcohol consumption but appears to be reduced with low alcohol consumption (p = 0.005)32. Binge drinking also significantly increases the levels of IL-6 in mice (p < 0.05)33. The relationship between these cytokines and differing levels of alcohol consumption might help explain our dose-dependent observation and offer some explanation why there was an increase in radiographic progression in our high alcohol consumption group but none in our low consumption group. The underlying mechanisms involved are still under investigation, but one theory suggests that IL-6 and TNF-α (increased with high levels of alcohol intake) may promote osteoclastogenesis. This is thought to lead to pathological bone resorption and more severe RA disease activity34,35,36,37,38. Additionally, IL-6 and TNF-α have been shown to promote synovitis through the recruitment of inflammatory cells and synovial fibroblast proliferation38. Although the biologic mechanisms were not the primary focus of our study, higher levels of CRP were evident, although not reaching statistical significance, in those with a history of alcohol consumption versus those without. Because CRP is a downstream inflammatory marker of IL-638, the biologic mechanisms are plausible and should be investigated further.
Although radiographic data in our study were collected longitudinally, our study was limited in that the patients’ history of alcohol consumption was collected only at baseline. This limits our ability to conclude whether our patients’ disease progression was associated with prior alcohol use or current alcohol use. Additional limitations to our study include the potential for misclassification bias, because alcohol use might be underreported and our questionnaire did not specify the quantity of alcohol per beverage. Although these were potential sources of error, we believe that this would only bias our results toward the null, suggesting that the effects observed in our study represent conservative risk estimates. Channeling may also be a source of bias if alcohol use were to preclude taking DMARD therapy, but this is unlikely because no differences in DMARD use or MTX use were identified based on different levels of alcohol consumption reported. Lastly, even though potential confounders were controlled for in our analysis, it is possible that residual confounding remains because the categorizations used may be oversimplified and because of the limited capacity to completely encompass confounders such as socioeconomic status, which may influence alcohol intake and disease progression. Despite these limitations, there are several notable strengths with our study. To our knowledge, this is the first study to evaluate the effects of alcohol use on radiographic disease progression in North America. Further, this is the first study to look at these associations in an entirely African American cohort — a traditionally understudied group.
We found a dose-dependent relationship between alcohol use and radiographic disease progression in RA. Individuals who consume 15 or more alcoholic beverages per month have accelerated rates of radiographic joint damage. In addition to extending our findings into other populations, further work should focus on disease outcomes associated with alcohol cessation in individuals who consume large amounts of alcohol.
Acknowledgment
The authors thank the CLEAR registry coordinators and many patients for their participation.
Footnotes
-
Mr. Davis was supported by the University of Nebraska Medical Center Enhanced Medical Education Tract. Dr. Mikuls was supported by the Nebraska Arthritis Outcomes Research Center, the American College of Rheumatology, and the Veterans Affairs Office of Research and Development (VA Merit). The CLEAR Registry (Primary investigator, Dr. Bridges) is also supported by the US National Institutes of Health grant 2P60 AR048095 UAB Multidisciplinary Clinical Research Center.
- Accepted for publication May 3, 2013.


