

Abstract
Objective. Adaptive tests are increasingly being used to assess health-related quality of life in patients with a variety of medical conditions, including osteoarthritis (OA) of the knee. This approach has recently been used to assess health state utility valuations (HSUV) for use in quality-adjusted life-year calculations. To accurately assess incremental value for money, these tools must be responsive. Therefore, we examined the responsiveness of the Health Utilities Index mark 3 (HUI3) and Paper Adaptive Test-5D (PAT-5DQOL) in a group of patients with knee OA.
Methods. We used patient-level data from a randomized controlled trial evaluating a pharmacist-initiated multidisciplinary intervention in newly diagnosed patients with knee OA. The mean change for utility scores from baseline to 6 months was calculated, as well as effect size (ES) and standardized response mean (SRM) for the HUI3 and PAT-5DQOL, and generalized additive model plots, using the Western Ontario and McMaster Osteoarthritis index as a reference standard.
Results. When patients were assessed based on whether their condition had improved, remained unchanged, or worsened over time, the PAT-5DQOL showed greater responsiveness in patients whose condition had either improved or worsened. ES and SRM were generally small for both instruments.
Conclusion. The PAT-5DQOL is more responsive to change over time than the HUI3 in patients with knee OA.
- KNEE OSTEOARTHRITIS
- HEALTH-RELATED QUALITY OF LIFE
- ADAPTIVE TESTS
- QUALITY-ADJUSTED LIFE-YEARS
- HEALTH CARE EVALUATION MECHANISMS
The reduction of pain, maintenance or improvement of joint mobility, limitation of functional disability, and improvement of self-management are the primary goals in the treatment of osteoarthritis (OA), a condition for which there is no curative therapy1. Thus health-related quality of life (HRQOL) and functional capacity is of paramount importance to assess the effect of therapies aimed at managing OA. As new therapies and strategies are developed, their relative cost-effectiveness needs to be estimated using standard techniques of economic evaluation, including the increment cost-effectiveness ratio (ICER) given by the formula:
 In most economic evaluations, the numerator is the quality-adjusted life year (QALY). The QALY combines length with HRQOL such that each year of life is adjusted by a certain value according to decrements in HRQOL experienced. There are several different methods to assess HRQOL that can be used to calculate QALY; however, there are no specific recommendations for OA.
For optimal use of these methods, investigators must have sensitive instruments for quantifying changes in HRQOL as measured by health state utility values or HSUV (ΔE) for groups of patients over time, as a result of a given intervention. A tool insensitive to change over time may result in small or insignificant changes in ΔE compared to changes in cost (ΔC) resulting in a larger ICER. This effect could result in decisions not to fund particular interventions owing to a perceived lack of cost effectiveness or cost utility. For HRQOL assessment tools, the ability of the tool to accurately measure changes in patient health states over time is referred to as responsiveness, or longitudinal validity2,3,4.
Two such tools, the Health Utilities Index Mark 3 (HUI3) and the Paper Adaptive Test (PAT-5DQOL) were used in a recent randomized controlled trial (RCT) of patients with knee OA comparing standard care and pharmacist-initiated multidisciplinary care5. The HUI3 is a multiattribute, preference-based HSUV instrument that measures health status and HRQOL and produces HSUV6. The PAT-5DQOL is an adaptive measurement system using an item bank with domains developed to be specifically relevant to patients with arthritis, to produce HSUV and measurements of health status and HRQOL7. Adaptive measurement systems allow different respondents to answer a different set of questions from preexisting item banks, based on their current health state as measured by their previous responses, and final scores are determined using maximum likelihood estimation8,9.
In general, disease-specific scales have been shown to be more responsive than generic instruments10. Responsiveness of multiple generic and disease-specific measures has also been compared in OA in a Thai population, finding superior responsiveness with disease-specific instruments11. Other trials have compared the relative responsiveness of specific instruments in knee OA and knee replacement. The Western Ontario and McMaster Osteoarthritis index (WOMAC) has been shown to have superior responsiveness compared to the Lequesne’s algofunctional index (AFI) and the Medical Outcomes Study Short Form-36 (SF-36) questionnaire in patients with lower extremity arthritis and knee replacement. Hart, et al studied the use of a computer adaptive test (CAT) model in a population of patients with a broad range of knee impairments, finding the CAT model to be valid, reliable, and responsive12; however, to our knowledge, no studies to date have compared the responsiveness of the HUI3 to the PAT-5DQOL in knee OA.
The objectives of our study were to (1) compare the PAT-5DQOL and the HUI3; and (2) assess the relative responsiveness of these measures in a cohort of patients with OA of the knee.
MATERIALS AND METHODS
Patient population.
Patients who underwent randomization in the Pharmacist Initiated Intervention Trial in Osteoarthritis (PhIT-OA) and completed baseline HRQOL assessments as well as 6-month followup assessments for the HUI3, PAT-5DQOL, and WOMAC were included in this analysis. Baseline characteristics for patients included in this analysis are presented in Table 1. Detailed study methodology including patient inclusion and exclusion criteria for the PhIT-OA trial has been published elsewhere13. In brief, the results of the trial showed that the quality of care was significantly improved in the intervention arm as compared to the control arm. In addition, significant improvements were observed for the intervention care group as compared to the usual care group in the WOMAC global, pain, and function scores at 3 and 6 months (all p < 0.01); the PAT-5D daily activity scores at 3 and 6 months (both p < 0.05); the PAT-5D pain scores at 6 months (p = 0.05); the HUI3 single-attribute pain scores at 3 and 6 months (all p < 0.05); and the Lower Extremity Function Scale scores at 6 months (p < 0.05).
Baseline demographics for those with complete information (n = 94).
Measures.
Contact was made by blinded study staff at baseline, 3 months, and 6 months, which consisted of a predefined scripted questionnaire including the WOMAC, HUI3, and PAT-5DQOL. Changes in patient clinical status in the intervention arm were the result of a pharmacist-initiated multidisciplinary intervention including OA medication review, provision of an OA education booklet and education program, letter to their primary care physician, physiotherapist referral, and exercise program12. Patients in the control arm received standard care, which consisted of provision of an OA education booklet.
HRQOL measures.
The WOMAC is a 24-item OA-specific instrument originally designed for clinical trials of hip and knee OA, and has previously been validated in patients with OA13,14. The WOMAC comprises 3 domains, including pain, stiffness, and physical function, rated from 0 (full health) to 4 (extreme disability). The score for individual domains was determined by summing the coded response scores for each domain, and the overall instrument utility was scored by summing the individual domain scores. Individual domain scores were then normalized to a scale of 0 to 10, resulting in a total score on a scale of 0 to 30. A ≥ 20% positive or negative change in the WOMAC has been validated as clinically significant15.
The HUI3 is a generic utility instrument comprising 8 domains (Vision, Hearing, Speech, Ambulation, Dexterity, Emotion, Cognition, and Pain), each with 4–6 descriptive levels, scored from 0.0 (death) to 1.0 (perfect health), with states worse than death measured as negative scores. The HUI3 describes a potential 972,000 unique health states. HSUV for the HUI3 were derived from a random sample of adults in Hamilton, Ontario, Canada, using both a visual analog technique and a standard gamble instrument6. A previously described multiplicative scoring model was used in this analysis17. A clinically significant change on the HUI3 has been described as 0.03 by Grootendorst, et al18. Based on this analysis, and the fact that the smallest measurable change on the HUI3 is a change of 0.03, we used a cutoff of 0.03 on the HUI3 to represent a minimally important difference (MID)19.
PAT-5DQOL.
The PAT-5DQOL is an adaptive measure of HRQOL designed for measuring HSUV in patients with musculoskeletal diseases, based on item response theory. It comprises 5 domains considered relevant to patients with arthritis and related conditions including daily activities, walking, handling objects, pain or discomfort, and feelings. The PAT-5DQOL utility scores are derived using an approach similar to that used for HUI, EQ-5D, or SF-6D, i.e., this is an indirect approach to measuring preferences. We had performed a preference study in which we used standard gamble to obtain preferences for different combination of health levels defined by the instrument. Scores were determined based on a previously described computer algorithm7.
Statistics.
Baseline HRQOL scores were compared between those with complete (all HRQOL assessment instruments completed at both baseline and 6 months) and incomplete (those patients missing 1 or more HRQOL assessment score at either baseline, 6 months, or both) datasets using independent t tests. Patients were analyzed as 1 cohort, assuming that the multidisciplinary intervention offered to the intervention group would not affect validity, responsiveness, or discriminative ability of the instruments (i.e., independent of randomized intervention).
Analyses were performed using SAS statistical software version 9.2 (SAS Institute Inc.).
Assessment of responsiveness.
All patients who had data on all 3 instruments at both baseline and 6 months were included in the analysis. Baseline and 6-month WOMAC scores were used as a standard with which to measure change in health state. The WOMAC was chosen as the reference standard because its validity, reliability, and responsiveness have already been demonstrated in this patient population14,15,16. The following criteria were used to determine health status change based on the WOMAC: (1) Improvement: ≥ 20% negative change; (2) No change: < 20% change; and (3) Worsening: ≥ 20% positive change.
Responsiveness was measured using both distributive techniques and an anchor-based method. Distributive methods included effect size (ES) using the following formula:
 Where X1 is the mean score at 6 months, X2 is the mean score at baseline for the entire group, and SDBaseline is the SD of the mean baseline scores. An effect size of 1 indicates a mean change equal in magnitude to 1 SD.
Cohen’s criteria were used in interpreting effect size with absolute changes: a small effect size was 0.2, a medium was 0.5, and a large effect size was 0.820,21.
The second distributive method was standardized response mean (SRM), using the following formula:
 Where X1 is the mean score at 6 months, X2 is the mean score at baseline, and SDX1 − X2 is the SD of the mean change between baseline and 6 months.
The absolute values of the SRM are interpreted in the same manner as ES (< 0.5 small, 0.5–0.8 medium, > 0.8 large).
To estimate the empirical 95% CI of each ES and SRM, bootstrap sampling with 1000 simulations was performed, because the standard errors of the distribution-based approaches are not defined.
To provide answers regarding the likelihood of a given magnitude of change in utility score representing an actual improvement or deterioration in patient status relative to the reference standard (i.e., How much of a change is actually clinically significant?), a generalized additive model (GAM) was used as an anchor-based method. The GAM model used here was the additive logistic model; this means the nonparametric smoothing was used to estimate the log odds, that is, the log odds change smoothly with a predictor (as opposed to log odds being linear in a predictor).
This model was used to show how estimated probabilities of a specific response vary depending on the observed change in the scores of the instruments. GAM plots were produced in R version 2.11.1 (www.r-project.org).
RESULTS
The RCT in which these data were collected originally included 139 patients, the baseline characteristics of which are reported elsewhere5. Data from 45 patients (32%) were excluded from this analysis because they did not complete the HUI3, PAT-5DQOL, and WOMAC assessments at both baseline and 6-month followup. The following analyses were therefore conducted on the data from the remaining 94 patients (68%). There were some differences in baseline HRQOL between those patients with complete data and those with incomplete data. Those with incomplete data had a significantly lower global score on both the HUI3 and PAT-5DQOL compared with those who completed all assessments at both timepoints (HUI3 0.74 vs 0.58, p < 0.001, and PAT-5DQOL 0.87 vs 0.79, p = 0.002, respectively). Individual domain scores for pain were also significantly different for both the HUI3 and PAT-5DQOL between patients with complete and incomplete data (HUI3 pain 0.73 vs 0.62, p = 0.029 and PAT-5DQOL pain/discomfort 45.97 vs 42.16, p = 0.022, respectively). Of the 94 patients analyzed, 53% showed improvement, 28% were unchanged, and 19% had worsened, based on the previously described WOMAC cutpoints.
Responsiveness.
Neither the HUI3 nor the PAT-5DQOL global scores showed a significant change from baseline to 6 months in the overall patient sample; however, when stratified into patients who improved, those who were unchanged, and those who worsened over time according to the WOMAC criteria, the HUI3 global score remained nonsignificant in all 3 groups, and the PAT-5DQOL detected significant changes in patients who improved (mean change 0.037, p = 0.012) and those who worsened (mean change 0.051, p = 0.011; Table 2). Interestingly, the HUI3 global score showed a numerically larger positive change from baseline for those whose clinical status remained unchanged compared to those who improved, although neither of these values was statistically significant.
Mean HRQOL change from baseline.
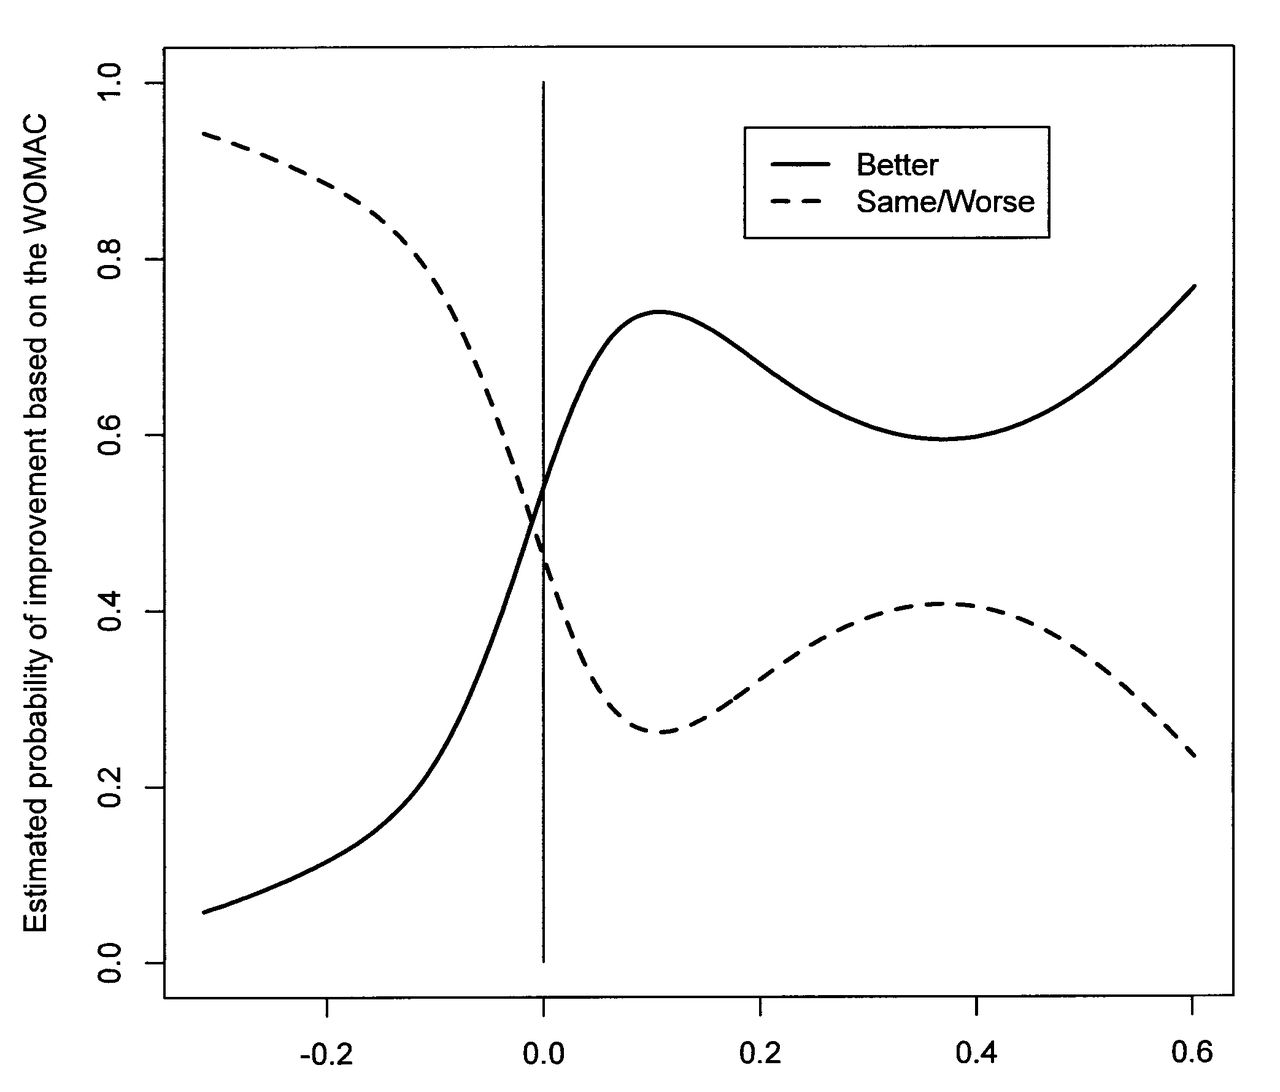
The ES and SRM were small in general for both tools when considering global scores and are presented in Table 3. The HUI3 global score CI for ES and SRM included 0 for all patient groups. When the groups were broken down by the WOMAC response criteria, the PAT-5DQOL had larger ES and SRM for patients who either improved or worsened over time, and the CI did not cross 0. In contrast, for the group of patients who remained unchanged based on the WOMAC, the PAT-5DQOL CI for both ES and SRM included 0. This result is consistent with responsiveness in those who either improve or worsen, while not showing inappropriate change in those who remain truly unchanged. GAM. GAM plots were based on 2 groups: those who improved (n = 50) and those who either remained unchanged or worsened (n = 44). Using the GAM plot for the global HUI3 score, a change in HUI3 score of 0.4 (on a scale of 0.00 to 1.00) would result in a probability of improvement defined by WOMAC of only 0.6 (Figure 1). Deterioration on the HUI3 of about −0.4 would result in a probability of no improvement/worsening on the WOMAC of about 0.5 (Figure 1). Conversely, in Figure 2, the GAM plots for the global PAT-5DQOL score showed a probability of improvement on the WOMAC of about 0.7, with a change of about 0.1 on the PAT-5DQOL global. A deterioration of PAT-5DQOL global of −0.2 was associated with a probability of not improving/worsening on the WOMAC of about 0.9. The individual domain scores for the PAT-5DQOL showed similar agreement with the WOMAC index (results not shown).

Change in Health Utilities Index mark 3 from baseline to 6 months. WOMAC: Western Ontario and McMaster Osteoarthritis index.
Change in Paper Adaptive Test-5D from baseline to 6 months. WOMAC: Western Ontario and McMaster Osteoarthritis index.
Effect size (ES) and standardized responses mean (SRM).
Single domain scores.
Single domains reaching statistical significance in mean change from baseline for the overall patient population included the HUI3 pain domain and the PAT-5DQOL pain and discomfort domain. For those patients whose health status improved, the PAT-5DQOL pain and discomfort, walking, and daily activities domains all showed significant improvement from baseline to 6 months. For patients who worsened over time, the HUI3 Ambulation domain, and the PAT-5DQOL pain and discomfort, walking, and daily activities domains all showed significant change.
ES and SRM for individual domains are presented in Table 3. In general, for the pain domains, the PAT-5DQOL showed larger ES and SRM than did the HUI3 for those who either improved or worsened. The walking domain of the PAT-5DQOL showed larger ES and SRM for those who improved or worsened compared to the HUI3 Ambulation domain; however, CI included 0 in all patient groups. Finally, the daily activities domain of the PAT-5DQOL showed a moderate ES and SRM in patients who improved, and a large ES and SRM in those who worsened. As seen in Table 4, 58% of patients exceeded the MID for the PAT-5DQOL pain and discomfort domain, 56% exceeded the MID for the PAT-5DQOL usual daily activities domain, while 39% exceeded the MID for the HUI3 global score.
Proportion of patients exceeding the minimally important difference (MID).
DISCUSSION
This analysis is the first to compare the responsiveness of the PAT-5DQOL, a disease-specific adaptive HSUV measurement tool to the HUI3, a generic, indirect HSUV measure, in patients with OA of the knee. In general, ES and SRM for both instruments were small. When patients were stratified into groups based on their change in WOMAC score (the reference standard), the PAT-5DQOL global score was more responsive for both patients who improved and those who worsened over time compared to the HUI3. The individual domains for pain and ambulation/walking were also more responsive in the PAT-5DQOL for those who improved or worsened, compared to the corresponding HUI3 domains. ES and SRM were considered large in the pain and discomfort and daily activities domains of the PAT-5DQOL for those who worsened over time. Pain and daily activity domains for both instruments were more responsive than the ambulation/walking domains.
GAM plots showed greater probability of correctly defining patients as improved, unchanged, or worsened, based on our reference standard, with the PAT-5DQOL compared to the HUI3. Neither the HUI3 global score nor the PAT-5DQOL global score showed significant changes from baseline in the overall population of patients with complete data, and the HUI3 global score did not show a significant difference from baseline for any of the groups broken down by WOMAC cutpoint scores, although the PAT-5DQOL did measure significant change in both the improved and worsened patient groups. Our results also demonstrate that patients who failed to complete all HRQOL measurement tools at both baseline and 6 months had lower baseline HUI3 and PAT-5DQOL global scores, indicating a poorer HRQOL in this patient group.
Other investigators have examined the responsiveness of disease-specific and generic HRQOL instruments in knee OA and total knee arthroplasty (TKA). In 1999, Theiler, et al compared the responsiveness of the WOMAC and the AFI in patients with OA of the lower extremities and found that in general, pain scales were more responsive than function scales in both tests, and the WOMAC scales and global index were more responsive than the AFI over 12 months (SRM at 12 months 2 vs 1.5)22. Similarly, the WOMAC and SF-36 have been compared both in patients with OA of the legs undergoing a comprehensive rehabilitation intervention and knee OA patients undergoing TKA. In patients undergoing rehabilitation, pain scales were again found to be more responsive than function scales for both instruments, and the WOMAC was significantly more responsive than the SF-36 in both populations23,24,25,26. Recently, Sweeney, et al27 compared a WOMAC-derived HUI3 and the SF-6D in patients with knee OA undergoing arthroplasty. This group found that both instruments had good construct validity and correlated well with disease-specific measures. The HUI3 was found to be more responsive (ES 1.34, 95% CI 1.17, 1.52 at 3 months and 1.52, 95% CI 1.35, 1.68 at 6 months) than the SF-6D (ES 1.12, 95% CI 0.95, 1.30 at 3 months and 1.33, 95% CI 1.16, 1.51 at 6 months), although mean changes from baseline to 3 and 6 months did not differ significantly between instruments27. This body of literature agrees with our finding that disease-specific tools such as the PAT-5DQOL tend to be more responsive than generic tools such as the HUI3, although both are able to detect change over time. In addition, the PAT-5DQOL differs from the HUI3 not only in being disease-specific, but also in being adaptive, which may make it more responsive to change.
Comparisons have been made between the responsiveness of CAT and nonadaptive instruments in other disease states. In a childhood physical activity intervention study, CAT was found to be less responsive than the Pediatric Evaluation of Disability Inventory (PEDI; ES 0.99 vs 0.87, SRM 1.64 vs 1.00, respectively), but this was offset by a large decrease in testing burden27 (15 items vs 161 items). The authors speculate that a reason for the CAT being found less responsive in this patient population compared to the PEDI was that it was limited to 15 items per individual, which showed some reduced ability to detect changes in mobility in those with autism or cognitive deficits. This difference may be responsible for those findings being contrary to our own. The population of patients with knee OA examined in our study also differs greatly from the children studied by Haley, et al28.
Limitations of our methodology must also be considered. First, our sample size was quite small, contributing to large CI around the ES and SRM, as well as the splines in the GAM plots. Second, we were unable to use a transition question as an external standard because it was not included in the questionnaires for the original RCT for which these data were gathered. Change in WOMAC score has previously been used to determine cutpoints for data analysis in similar patients27. Third, the PAT-5DQOL has yet to undergo a validation study in this population, although several studies have used it in patients with knee OA for measuring HRQOL29,30. Finally, in general, effect sizes were quite small for both the PAT-5DQOL and HUI3, potentially as a result of combining the patients from the intervention and control arms of an RCT, thereby resulting in a group of patients with more heterogeneous mean HRQOL changes from baseline. Strengths of our methods include the use of both ES and SRM to measure responsiveness, as well as GAM plots, which give a better indication of the magnitude of change required to classify a patient as either improved, unchanged, or worsened, based on the reference standard. We also analyzed the mean score changes and responsiveness from baseline in not only the entire patient population, but also in those who improved, remained unchanged, or worsened, based on their WOMAC scores. This allowed us to draw conclusions regarding the usefulness of these tools in populations of patients undergoing a known effective therapy, as well as those who remained untreated and followed the natural disease course of OA.
The PAT-5DQOL is more responsive than the HUI3 in patients who either improve or worsen from baseline. Pain domains and daily activity domains were more responsive than ambulation/walking domains. Single domain scores of the PAT-5DQOL are more responsive than corresponding domains of the HUI3. Economic evaluations in OA that use the HSUV from the PAT-5DQOL to determine QALY are likely to result in valid estimates in incremental cost-effectiveness ratios because the denominator is sensitive to relevant changes in quality of life.
- Accepted for publication August 28, 2013.


