

Abstract
Objective. To define the minimally important change (MIC) in the SpondyloArthritis Research Consortium of Canada (SPARCC) spine and sacroiliac (SI) joint magnetic resonance imaging (MRI) indices in patients with ankylosing spondylitis.
Methods. MRI scans were performed during a placebo-controlled trial of adalimumab (no. NCT00195819). Two independent readers, blinded to treatment and sequence, determined SPARCC scores for the spine and SI joints and a global evaluation of change (GEC; “much worse,” “worse,” “no change,” “better,” or “much better”; categories other than “no change” were pooled together as “change”) between baseline–Week 12, baseline–Week 52, and Weeks 12–52. Mean absolute changes in SPARCC scores (95% CI) were calculated for each interval, treatment group, and GEC. Receiver-operating characteristic (ROC) curves were used to identify the MIC. Relationships of MIC to clinical responses were examined.
Results. Reader agreement on GEC evaluations was > 70%. Changes in SPARCC scores were generally comparable between time intervals and treatment groups for “change” and “no change” categories and were combined for each category; change in score was significantly associated with GEC of “change” (area under ROC curves: spine 0.839; SI joints 0.960). ROC curves peaked at values of 5.0 for the spine and 2.5 for SI joints. Placebo-treated patients achieving > 2.5 unit improvement in SI joint score had significantly better clinical responses than placebo-treated patients who did not achieve such improvement. MRI and clinical responses were uncoupled in adalimumab-treated patients.
Conclusion. We propose that changes of 5.0 for the spine and 2.5 for SI joints define the MIC for the SPARCC MRI indices.
- ANKYLOSING SPONDYLITIS
- MAGNETIC RESONANCE IMAGING
- SPONDYLOARTHRITIS RESEARCH CONSORTIUM OF CANADA
- ADALIMUMAB
- MINIMALLY IMPORTANT CHANGE
Tumor necrosis factor-α (TNF-α) inhibition has changed treatment practices for ankylosing spondylitis (AS), a disease for which only nonsteroidal antiinflammatory drugs (NSAID) were previously proven to be effective. Clinical trials with TNF-α agents have provided insights into the unique challenges of assessing efficacy of new therapies for AS. The current limitations in measuring disease activity and treatment response in AS are 2-fold. First, validated clinical outcome measures in AS are largely subjective and primarily assess symptoms1,2. Second, conventional radiography and the modified Stoke Ankylosing Spondylitis Spine Score used to quantify structural damage in AS reflect chronic changes of bone erosion and bone formation3, rather than the underlying inflammatory processes that lead to bone damage.
The use of magnetic resonance imaging (MRI) addresses the need for a more objective measure of disease activity and treatment response in AS. MRI techniques have afforded physicians the opportunity to monitor changes in inflammation, rather than the resulting bone damage typically seen on radiographs. Through the incorporation of fat-suppression techniques [e.g., short-tau inversion recovery (STIR) sequences], MRI enables direct visualization of inflammatory lesions within the bone marrow that are often obscured by marrow fat4. These lesions are thought to be predictive of future locations of erosion and subsequent osteoproliferation, and thus may offer detection and objective monitoring of active disease, advantages not otherwise possible with plain radiography in patients with AS5,6,7.
The SpondyloArthritis Research Consortium of Canada (SPARCC) MRI indices are validated scoring methodologies for spine and sacroiliac (SI) joint inflammation in patients with AS8,9,10. The SPARCC MRI indices assess the presence, 3-dimensional extent, and signal intensity of active inflammatory lesions represented by bone marrow edema (BME), in the spine and SI joints of affected patients. In the spine, the scoring system measures BME in the bone marrow of discovertebral units (DVU), each unit representing the region between 2 imaginary lines drawn through the middle of adjacent vertebrae. The 6 worst DVU are selected for assessment, a method that has been shown to be equally discriminatory as an assessment of all 23 DVU11. The scoring system also measures BME in the iliac and sacral bone marrow of the SI joints by assessing lesions in consecutive coronal slices through the synovial portion of the joint.
In a randomized controlled trial of patients with longstanding AS, evaluation of changes in the SPARCC MRI scores of the spine and SI joints demonstrated a significant reduction in inflammation following treatment with the TNF-α inhibitor adalimumab versus placebo at Week 1212. These results indicate that changes in BME can be detected using the SPARCC MRI indices as early as 12 weeks after initiation of effective therapy.
While the SPARCC MRI indices have proved to be useful discriminatory tools for the assessment of inflammation in groups of patients with AS, a threshold defining what constitutes a minimally important change (MIC) in the individual patient has not been described. An MIC is needed to determine the number of patients actually showing an important change in a particular instrument or outcome measure in response to a therapeutic agent. The MIC can be the basis for determining the minimal clinically important difference (MCID)13. As an example, a change in the total Sharp score of 5 units or more over 1 year is a widely used MCID to indicate the occurrence of radiographic progression in individual patients with rheumatoid arthritis (RA), as this constitutes the amount of change judged by expert readers to be clinically relevant progression when reading sets of radiographs obtained at 1-year time intervals14. We sought to determine the MIC for inflammatory lesions in the spine and SI joints scored by expert radiologists using the SPARCC MRI indices.
MATERIALS AND METHODS
Patients
Adult patients ≥ 18 years of age who met the definition of AS based on the modified New York criteria15 were eligible for enrollment in this Canadian study of patients with AS. Patients must have had active AS at study entry, defined as fulfillment of at least 2 of the following 3 conditions: a Bath Ankylosing Spondylitis Disease Activity Index (BASDAI) score ≥ 4 cm, a visual analog scale (VAS) score for total back pain ≥ 40 mm (scale 0–100 mm), and/or morning stiffness ≥ 1 hour. Patients must have had an inadequate response to or intolerance of 1 or more NSAID. Additionally, patients were allowed to have failed at least 1 disease-modifying antirheumatic drug (DMARD), although this was not a requirement for study entry. Patients were allowed to continue concomitant therapy with sulfasalazine (SSZ; ≤ 3 g/day) and/or methotrexate (MTX; ≤ 25 mg/week) and/or hydroxychloroquine (≤ 400 mg/day) and/or prednisone (≤ 10 mg/day) and/or NSAID as long as the doses of these drugs remained stable for 4 weeks prior to the baseline visit.
Patients were ineligible for the study if they had received prior treatment with a TNF-α inhibitor, had radiological evidence of total spinal ankylosis, or had received cyclosporine, azathioprine, or DMARD (other than MTX and/or SSZ and/or hydroxychloroquine) within 4 weeks prior to baseline.
Our study was approved by an independent ethics committee at each study site. All patients provided written informed consent, and the study was performed in accord with the ethics principles of the Declaration of Helsinki.
Study design
The M03-606 study was a multicenter, randomized, double-blind, placebo-controlled trial of adalimumab for the treatment of patients with active AS in Canada (clinicaltrials.gov identifier NCT00195819)12. Patients were randomized in a 1:1 ratio to receive blinded adalimumab 40 mg or placebo every other week during the initial 24-week double-blind period. Patients completing 24 weeks of treatment were eligible to enter into an extension study and receive open-label adalimumab 40 mg every other week for a period of up to 5 years. Patients failing to meet the Assessment of SpondyloArthritis International Society criteria for 20% improvement in disease activity (ASAS20) at Weeks 12, 16, or 20 were eligible to receive open-label adalimumab 40 mg every other week for the remainder of the double-blind period (early escape option).
Imaging
MRI of the spine and SI joints was performed at baseline, Week 12, and Week 52 as described8,9,12. STIR sequences were obtained for both the spine and SI joints using the following measures: time to recovery 2720–3170 ms; time to inversion 140 ms; time to echo 38–61 ms. STIR sequences of the spine were obtained in a sagittal orientation, 12–15 slices of 4-mm thickness, divided into 2 parts: the entire cervical spine and most of the thoracic spine, and the lower portion of the thoracic spine and entire lumbar spine. STIR sequences of SI joints were obtained in a coronal plane tilted parallel to the long axis of the SI joint, and 12 slices of 4-mm thickness were acquired. T1-weighted spin-echo images of the entire spine and the SI joints were also obtained for use as anatomical references.
MRI scoring
Two independent readers, blinded to randomized treatment assignment and time sequence (i.e., study week), scored the MRI using the SPARCC MRI indices for spine (range 0–108) and SI joints (range 0–72). Details of the SPARCC scoring methodologies have been described8,9,10. Additionally, an overview of the SPARCC scoring methodologies can be found at www.arthritisdoctor.ca. Readers also compared MRI between blinded timepoints and rated each comparison according to a 5-category global evaluation of change (GEC) as “much worse,” “worse,” “no change,” “better,” or “much better.” After unblinding, this allowed for evaluation of comparisons between baseline and Week 12, baseline and Week 52, and Week 12 and Week 52. Interreader agreement was assessed by determining the proportion of concordant reads for the GEC to total available reads. Only the cases in which both readers agreed on the original 5-category GEC were considered for this analysis of the MIC. Reader agreement across the distribution of spine and SI joint SPARCC MRI scores and change from baseline to Week 12 and baseline to Week 52 were assessed by Bland-Altman plots16,17. These plots illustrate the interreader difference across the range of SPARCC MRI scores.
Clinical response
Clinical response measures included the ASAS20. This measure is defined as improvement ≥ 20% and absolute improvement ≥ 10 units in 3 of 4 domains, with no deterioration (defined as a worsening ≥ 20% and a net worsening ≥ 10 units) in the remaining domain. The 4 domains are patient’s global assessment of disease activity VAS, total back pain VAS, functionality [Bath Ankylosing Spondylitis Functional Index (BASFI)] and inflammation (mean of questions 5 and 6 on the BASDAI scale)1, ASAS40 (improvement ≥ 40% and absolute improvement ≥ 20 units from baseline in ≥ 3 of the 4 domains of the ASAS20 with no worsening in the potential remaining domain), a 50% improvement in the BASDAI (BASDAI50), clinically important improvement (CII) in the Ankylosing Spondylitis Disease Activity Score (ASDAS18; improvement ≥ 1.1), and major improvement (MI) in ASDAS (improvement ≥ 2.0).
Statistical analyses
For this analysis, categories other than “no change” in the GEC were pooled together as “change.” Change in the numerical SPARCC score was expressed as an absolute change, independent of the direction of change (i.e., values are reflective of both “progression” and “improvement”). Mean absolute changes in SPARCC scores and 95% CI were summarized by intervisit comparison (baseline to Week 12, baseline to Week 52, and Week 12 to Week 52), treatment group (adalimumab or placebo), and GEC category (pooled “change” or “no change”). Receiver-operating characteristic (ROC) curves were generated on the basis of a logistic regression model of “change”/“no change” from the GEC compared with change in the SPARCC MRI scores. ROC curves were used to predict the efficiency with which the SPARCC MRI indices discriminated GEC of “change” from “no change” by plotting the sensitivity against 1 – the specificity for all values of absolute change in the SPARCC score. A plot of the sensitivity and specificity against absolute change in the SPARCC score was used to identify the point at which the 2 curves met; this convergence point was defined as an acceptable threshold for defining “change.”
The percentages of patients who improved beyond the identified MIC for SPARCC scores of the spine and SI joints were summarized. The clinical response rates of patients improving or failing to improve beyond the MIC for MRI assessments of the spine and SI joints were compared between and within treatment groups using chi-square analysis.
RESULTS
Defining the MIC for SPARCC scores of the spine and SI joints
Patient demographics and disease characteristics at baseline for the 38 and 44 patients randomized to adalimumab and placebo, respectively, were indicative of a population with active AS12. As reported, there were no significant differences in the baseline disease characteristics between treatment groups. About 95% and 65% of patients had baseline SPARCC scores > 0 for the spine and SI joints [adalimumab: spine 97%, mean (SD) = 16.0 (15.6) and SI joints 63%, mean = 5.7 (9.0); placebo: spine 93%, mean = 19.9 (19.8) and SI joints 66%, mean = 7.5 (10.0)]12. Following 52 weeks of treatment, all 38 patients initially randomized to adalimumab and 42 of 44 initially randomized to placebo had evaluable MRI.
Interreader agreement on the 5-category GEC (“much worse,” “worse,” “no change,” “better,” or “much better”) was noted to be higher for MRI assessments of the SI joints than of the spine at each visit interval (Table 1). For the majority of the GEC evaluations in which readers agreed on “change” or “no change,” the 95% CI of the absolute changes in numerical SPARCC scores of both the spine and SI joints showed comparability between treatment groups and among visit comparisons (Tables 2 and 3). Therefore, all cases were combined across treatment groups and visit comparisons in the analysis of the MIC.
Interreader agreement on the 5-category global evaluation of change.
Summary statistics of absolute change in SPARCC score for spine by global evaluation of change.
Summary statistics of absolute change in SPARCC score for SI joints by global evaluation of change.
Based on 100 spine and 154 SI joint assessments in which both readers concluded “no change” in the GEC, the mean absolute changes in SPARCC scores were 4.2 (95% CI 2.6–5.8) and 1.1 (95% CI 0.6–1.6) for spine and SI joints, respectively. Conversely, based on 72 spine and 40 SI joint assessments in which the readers concluded “change,” the mean absolute changes in SPARCC scores were 15.9 (95% CI 12.6–19.3) and 10.8 (95% CI 8.6–13.0), respectively. A review of the Bland-Altman plots showed that interreader differences were similar across the range of change scores (data not shown).
Absolute changes in SPARCC scores of the spine and SI joints were significantly associated with “change” as determined by the GEC (areas under the ROC curve for spine and SI joints were 0.839 and 0.960, respectively; Figures 1A and 1B). Absolute changes between 4 and 5 in the SPARCC scores for the spine were associated with sufficiently high levels of both sensitivity and specificity (about 80% for both) for a GEC of “change” (Figure 1A). Absolute changes between 2.0 and 2.5 in the SPARCC scores for SI joints were associated with even higher levels of sensitivity and specificity (about 90% for both; Figure 1B).

ROC curves for absolute change in the spine (A) and sacroiliac (SI) joint (B) SPARCC scores and global evaluation of “change” (all visit comparisons combined). ROC curves were generated using a logistic regression model of “change”/“no change.” Ranges of 4.0–5.0 and 2.0–2.5 demonstrate values with sufficiently high levels of sensitivity and specificity for MRI readings of the spine and SI joints, respectively.
To further quantify the absolute change in SPARCC scores that would be an acceptable threshold to separate “change” from “no change,” the modeled sensitivities and specificities for the spine and SI joint assessments were plotted against absolute changes in SPARCC scores (Figures 2A and 2B). The lines converged at absolute changes of 5.0 and 2.5 for the spine and SI joints, respectively, suggesting that changes of 5.0 SPARCC units in the spine and 2.5 SPARCC units in the SI joints define the minimally important changes in inflammation on MRI for patients with AS.
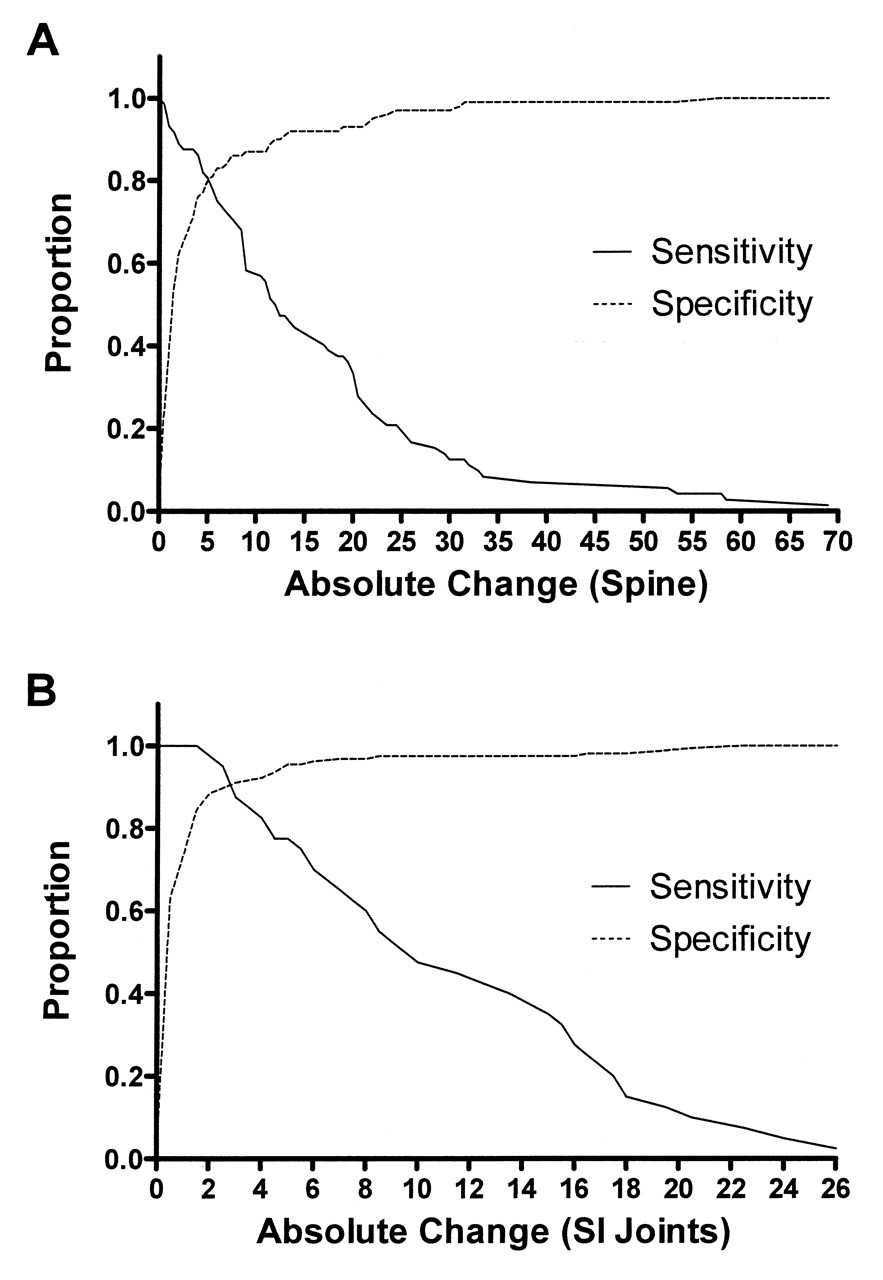
Identification of minimally important change in SPARCC scores of the spine and sacroiliac (SI) joints. The sensitivity and specificity of the SPARCC indices were plotted as a function of absolute change in score for the spine (A) and SI joints (B). The intersection of the sensitivity and specificity curves indicates the threshold at which “change” can be separated from “no change.”
MIC and clinical response
Higher percentages of patients randomized to adalimumab (57.9%) demonstrated improvements in SPARCC scores of the spine that surpassed the identified MIC threshold (5.0 SPARCC units) within 12 weeks of treatment when compared with patients randomized to placebo (27.3%; p = 0.005 for difference between treatment groups). In contrast, there were no differences between the percentages of patients who improved beyond the MIC for SPARCC scores of the SI joints (2.5 SPARCC units) following 12 weeks of treatment (28.9% vs 31.8% for patients randomized to adalimumab and placebo, respectively; p = 0.78). In general, 12 weeks of treatment with adalimumab was associated with better clinical responses than treatment with placebo regardless of whether SPARCC scores improved beyond the MIC (Table 4). On the other hand, placebo-treated patients who demonstrated improvements in SI joint SPARCC scores beyond the MIC within the first 12 weeks of treatment achieved significantly better clinical responses than placebo-treated patients who did not demonstrate such improvements. There was also a trend for better ASDAS CII and ASDAS MI responses among adalimumab-treated patients who had improvements in SPARCC scores beyond the MIC, although the differences were not statistically significant.
Relationship between Week 12 clinical response and improvements greater than minimally important change (MIC) in spine or SI joint SPARCC scores.
DISCUSSION
MRI scoring systems for spinal and SI joint inflammation in AS have been shown to be highly discriminatory between treatment groups in placebo-controlled trials of TNF-α inhibitors12,19,20,21,22,23. Although limited histopathological data from biopsies of the spine and SI joints show that changes in MRI inflammation correlate well with changes in histopathological scores for inflammation24, the correlation with clinical measures such as BASDAI, BASFI, and back pain scores has been reported to be relatively poor11,12,25,26. A beneficial effect of treatment on inflammation as detected by MRI may be observed even in the absence of a clinical response12. Nonetheless, MRI provides additional data on disease activity and response to therapeutics that cannot be provided by assessment of clinical measures alone, specifically in AS, where the most commonly used clinical response measures are largely subjective.
The scoring systems used for spine and SI joint MRI have not been widely adopted within the clinical practice setting given the time and specialized training required to perform such scoring. In addition, their applicability has not been adequately translated from the clinical trial setting to the individual patient seen in the clinical practice environment, a setting in which it is often desirable to assess a patient for changes in disease activity that are clinically relevant. MCID cutoffs for a variety of instruments examined in patients with AS (e.g., BASDAI, BASFI) have been described27. Minimal CII has also been defined for patient global assessment of disease activity and pain in patients with AS28. We have estimated using a data-driven approach, with the overall assessment of change seen on MRI by expert radiologist readers as an external anchor, that the MIC for the SPARCC MRI assessments of the spine and SI joint are 5.0 and 2.5 units, respectively. This cutoff can be useful in discriminating treatment groups and particularly in discriminating clinical responders from nonresponders in patients receiving conventional therapy. Patients taking a placebo in our study continued to receive conventional background therapy during the trial. All Week 12 clinical response measures (ASAS20, ASAS40, BASDAI50, ASDAS-CII, ASDAS-MI) were significantly higher in placebo-treated patients with SPARCC SI joint MRI improvement > 2.5 units compared with placebo-treated patients who did not demonstrate this magnitude of change in the MRI score. Interestingly, treatment with adalimumab uncoupled clinical response from MRI improvement.
The methodology for defining the MIC for imaging instruments in rheumatology can be considered in 2 broad categories29,30. The first is a statistical approach in which the distribution of the data is used to determine the amount of change that can be reliably discriminated from the interreader measurement error of the scoring method. Because this approach is based only on statistical analyses, it is not known to what degree it represents a clinically relevant change. A second approach uses anchor-based methods: an external criterion, such as patient global assessment, is used to estimate a relevant or important change. A limitation of this approach is that it does not take measurement precision into account; thus, information is lacking on whether an important change lies within the measurement error of the instrument. We selected an anchor-based approach to estimate the MIC.
The choice of an external anchor for estimation of a clinically relevant MIC can pose challenges for an imaging instrument, particularly in AS where a poor correlation has been demonstrated with clinical outcomes. While increasing evidence shows that inflammation observed on MRI has predictive validity for structural damage5,31, it is unclear how this might affect treatment decisions in the absence of therapies that can inhibit radiographic progression in AS. Therefore, we chose an external anchor that is based on an expert radiologist’s opinion of what constitutes “change” based on overall interpretation of the MRI scans. Consequently, it is important to emphasize that this MIC defined in this manner reflects an important change in an MRI lesion, which does not necessarily imply a concomitant MCID in the clinical status of the patient.
The spine SPARCC score assesses inflammation in a dichotomous manner (present/absent) in quadrants of the 6 most severely affected DVU. The identified MIC (change of at least 5.0 SPARCC units) indicates a change of 5 quadrants with BME. It is unlikely that scoring all 23 DVU would affect the cutoff for the MIC because the DVU that are not scored have less severe inflammation and would therefore not likely influence the GEC. Similarly, the SPARCC SI joint score assesses inflammation in a dichotomous manner in SI joint quadrants, with an MIC of 2.5 indicating a change in at least 2–3 quadrants with BME.
The MIC thresholds identified in this analysis allowed discrimination of clinical responders from nonresponders in patients who received conventional therapy, but only for assessments of the SI joints. In contrast, improvements in SPARCC MRI scores were uncoupled from clinical responses in patients treated with adalimumab, where improvement in MRI was evident in virtually all patients as seen on cumulative probability data12. These data are reminiscent of responses observed following TNF-α inhibition in patients with rheumatoid arthritis (RA). Patients with RA who receive a TNF-α inhibitor show low levels of radiographic progression across the entire range of clinical responses32,33,34,35,36.
Limitations of the analyses presented here include the possibility that these cutoffs might differ in patients with a shorter disease duration prior to the appearance of tissue metaplasia with fat and new bone. The appearance of structural lesions may lead to increased difficulty in the assessment of inflammatory lesions. This may be particularly challenging in the SI joints, where inflammation is often seen bordering areas of fat infiltration in well established disease. Readers may differ in their approach to recording inflammation, and published SI joint scoring methods do not specify the approach to quantifying inflammation in the presence of such structural abnormalities8,9,19. While the SPARCC methods score inflammation in a dichotomous manner even in the presence of structural lesions, this inflammation is often of low signal intensity on STIR and difficult to differentiate from normal marrow signal. This might also account for the interreader reliability of the GEC being about 70%–80%.
We used a data-driven approach and an external anchor relevant to routine practice to estimate the MIC for spinal and SI joint inflammation as measured by the SPARCC MRI indices in patients with AS. This can facilitate the identification of responders to therapeutic intervention and predictors of response based on MRI. It may also contribute to the further assessment of MRI as a prognostic indicator for structural damage in patients with AS.
Acknowledgment
The authors thank members of the M03-606 study group [Mary Jane Bell (Toronto), Denis Choquette (Montreal), Robert Inman (Toronto), Edward C. Keystone (Toronto), William O. Martin (Calgary), Wojciech P. Olszynski (Saskatoon), Proton Rahman (St. John’s), and Kamran Shojania (Vancouver)], as well as Benjamin Wolfe, PhD, of Abbott, for editorial assistance with the drafting and revision of this report.
Footnotes
-
Funded by Abbott. Dr. Maksymowych has received research grants and/or consulting fees or other remuneration from Abbott, Merck, and Pfizer. Dr. Lambert has received consulting fees from Abbott and Perceptive Informatics. Dr. Pangan and Mr. Brown are current and former employees of Abbott, respectively, and may hold Abbott stock or stock options. Dr. Maksymowych is a Scientist of the Alberta Heritage Foundation for Medical Research.
-
Full Release Article. For details see Reprints/Permissions at jrheum.org
- Accepted for publication May 10, 2012.
Free online via JRheum Full Release option


