
Abstract
Objective. Rheumatoid arthritis (RA), a condition with a strong genetic etiology, is associated with excess cardiovascular disease (CVD). Dyslipidemia in RA may be driven by inflammation and genetic factors. Apolipoprotein E (ApoE) is important for the regulation of lipid levels and CVD risk and immune function in the general population. We compared the frequency of 2 ApoE single-nucleotide polymorphisms (SNP) in patients with RA and controls, and studied the relationship of ApoE genotypes with lipids and inflammation in RA.
Methods. A total of 387 patients with well-characterized RA and 420 non-RA controls were studied. Two ApoE SNP, rs7412 (ApoE2) and rs429358 (ApoE4), were identified.
Results. Genotypic (p = 0.908) and allelic (p = 0.894) frequencies did not differ between RA and controls. Within RA, the E2 allele was associated with the lowest and E4 allele with the highest levels of total cholesterol (p = 0.007), low-density lipoproteins (p = 0.004), and apolipoprotein B (p = 0.009). The E4 allele was also associated with lower C-reactive protein (p = 0.007), erythrocyte sedimentation rate (p = 0.001), and Disease Activity Score (p = 0.015) compared to the E3 allele. E2 or E4 alleles were not associated with CVD in RA, although a trend was observed (p = 0.074).
Conclusion. The frequency of ApoE polymorphisms did not differ between patients with RA and controls. ApoE genotypes are strongly linked to inflammation and lipid levels in RA, raising interest in the prognostic implications of ApoE genotypes.
- RHEUMATOID ARTHRITIS
- APOLIPOPROTEIN E
- SINGLE-NUCLEOTIDE POLYMORPHISMS
- DYSLIPIDEMIA
Rheumatoid arthritis (RA) is a complex autoimmune disease that primarily presents with peripheral joint pain and swelling; it is also associated with excess cardiovascular morbidity and mortality, which account for up to half of all RA deaths1,2,3. The pathogenesis of cardiovascular disease (CVD) in RA is multifactorial, involving traditional risk factors, such as hypertension4,5, dyslipidemia6, obesity7,8, and physical inactivity9, as well as novel factors, including systemic inflammation10.
The lipid profile in RA is characterized by low levels of total cholesterol (TC), high-density lipoproteins (HDL), and low-density lipoproteins (LDL)11,12,13, and an increased atherogenic index (TC:HDL ratio)12,14,15. Systemic inflammation is thought to drive many of these changes through alterations in enzymatic activity and cytokine/acute-phase protein-mediated effects on lipid metabolism6. However, multiple other factors may also contribute. For example, in the general population genetic polymorphisms have been shown to be fundamental for both the regulation of lipid levels and the development of CVD16,17,18,19,20,21,22. In RA, a condition with a strong genetic etiology23,24,25,26,27, the frequency and role of genetic polymorphisms regulating lipid metabolism are unknown.
Apolipoprotein E (ApoE) is synthesized by the liver, in brain tissue, and by macrophages resident in atherosclerotic plaques, and is essential for the catabolism of triglyceride (TG)-rich lipoproteins28,29 and plays an important role in cardiovascular disease30 and immunoregulation31,32,33. Of particular interest, ApoE has been shown to affect macrophage oxidative status34 and inhibits T lymphocyte proliferation31. There are 3 different isoforms of ApoE (ApoE2, ApoE3, and ApoE4). ApoE3 is the parent form, while ApoE2 and ApoE4 occur as a result of 2 single-nucleotide polymorphisms (SNP) at residue 158 and 112, respectively35. These isoforms exhibit different pathophysiological/phenotypic properties in the general population: ApoE2 associates with lower serum ApoE, TC, and LDL levels, while ApoE4 produces the opposite effect, increasing serum ApoE, TC, and LDL levels, as well as CVD risk30. Although the alterations in the lipid profile can partly explain the link between ApoE and CVD, other mechanisms may also contribute. Serum ApoE levels are inversely associated with levels of high sensitivity C-reactive protein (hsCRP) in the general population36,37, a known independent risk factor for CVD38. The E2 allele associates with higher levels and the E4 allele with lower levels of CRP37.
In our study we aimed to assess the frequency of the ApoE genotypes in patients with RA versus healthy controls, and to assess the relationship of ApoE genotypes with lipid levels and systemic inflammation in patients with RA.
MATERIALS AND METHODS
Study populations
The study was approved by the local Research Ethics Committee and Research and Development Directorate and all participants gave written informed consent, according to The Declaration of Helsinki39.
For the purposes of this cross-sectional study, 2 populations were assessed. The first included 387 patients fulfilling the 1987 American College of Rheumatology criteria for RA40, recruited from routine rheumatology out-patient clinics held at the Dudley Group of Hospitals National Health Service Foundation Trust, between August 1, 2004, and July 31, 2006. The comparator population consisted of 420 local general population non-RA controls identified from a previously collected anonymized DNA biobank.
Data recorded on the patients with RA included basic demographics (age, sex, height, weight, waist circumference), a full medical history (including specific details regarding RA and CVD), current disease activity using the 28-joint Disease Activity Score (DAS28)41 and physical function using the Health Assessment Questionnaire (HAQ)42. All current medications were documented, including antirheumatic drugs, analgesics, and cardiovascular drugs such as statins and antihypertensives. All patients with RA also gave fasting blood samples for routine tests including full blood count, urea and electrolytes, liver function, CRP, erythrocyte sedimentation rate (ESR), lipid profile, and thyroid function tests. Estimated glomerular filtration rate (eGFR) was calculated according to the Modification of Diet in Renal Disease equation43. Detailed descriptions of the RA population have been published by our group44,45. CVD was defined as a positive history of any of the following: myocardial infarction, angioplasty, coronary artery bypass grafting, peripheral vascular disease, stroke or transient ischemic attack, or positive Rose questionnaire46 on assessment. Dyslipidemia was defined by the US National Cholesterol Education Program guidelines: i.e., TC ≥ 6.2 mmol/l or HDL < 1.03 mmol/l or LDL ≥ 4.13 mmol/l or TG ≥ 1.7 mmol/l47. Data available on the local population controls were limited to age and sex. All subjects provided DNA samples stored for subsequent genetic analysis.
Genotyping
The 2 ApoE SNP were identified simultaneously using the Roche LightCycler 480 System and a Roche ApoE mutation detection kit (cat. no. 03004716001). Polymerase chain reaction was performed with a reaction volume of 20 μl containing 2 μl DNA, 12 μl sterile water, 2μl Lightcycler reaction mix, and 4 μl Lightcycler ApoE mutation detection mix containing an anchor probe specific for both codons 112 and 158, labeled at the 3′ end with fluorescein, and 2 sensor probes specific for codons 112 and 158 labeled at the 5′ end with Lightcycler Red 640 and Lightcycler Red 705, respectively.
The cycle conditions were as follows: 1 cycle of 95°C for 10 min, programmed ramp rate of 4.4°C/s; 35 cycles of 95°C for 6 s, 53°C for 15 s, and 72°C for 10 s each with a temperature transition rate of 4.4°C/s, 2.2°C/s, and 4.4°C/s, respectively; then melting curve analysis for 1 cycle of 95°C for 5 s and 40°C for 30 s, each with a transition temperature rate of 4.4°C/s and 2.2°C/s, respectively, and then rising to 75°C at 0.11°C/s, continuous with 5 acquisitions per 1°C. By combining the melting curve analysis from the genotyping of codon 112 and codon 158 the allelic structure of the analyzed samples was determined, e.g., E2E2 (Table 1).
Assignment of genotypes following combination of the melting curves from rs7412 (ApoE2) and rs429358 (ApoE4).
A negative (water) control and a positive heterozygous control were included in each run.
Statistical analysis
Data analysis was carried out using SPSS 15.0 (SPSS Inc., Chicago, IL, USA).
Genotype and allele frequencies were compared using the chi-square test in the total populations, before and after adjustment for age and sex. The Kolmogorov-Smirnov test was used to establish the distribution of each parameter. The variation of clinical characteristics across the genotypes was analyzed using chi-square, ANOVA, and Kruskal-Wallis tests for categorical, normally distributed, and non-normally distributed variables, respectively. ANCOVA was used to assess the association between lipid and inflammatory variables with the different genotypes and all results were adjusted for multiple comparisons.
When analyzing the association of ApoE genotypes with lipid levels and inflammatory markers, patients receiving lipid-lowering therapy, e.g., statins, were excluded due to the confounding effects of such treatment on lipid levels and inflammatory markers. In addition, the E2E4 genotype was excluded due to its potential to exert mixed phenotypic effects relating to the E2 and E4 allele.
The study had 80% power at the 5% significance level to detect a 6% difference in the prevalence of the rs7412 genotype and a 7% difference in the prevalence of the rs429358 genotype between RA and controls. Within patients with RA, the study had 80% power at the 5% significance level to detect a difference of at least 0.52 mmol/l in TC and 0.53 mmol/l in LDL between the E2 and E3 alleles, and a difference of 0.42 mmol/l in TC and 0.41 mmol/l in LDL between the E4 and E3 alleles. For non-normally distributed variables the values were logged; this demonstrated that the study had 80% power at the 5% significance level to detect a difference of 13.2% in HDL, 21.3% in TG, 52.1% in CRP, and 53.5% in ESR between the E2 and E3 alleles, and a difference of 10.2% in HDL, 16.1% in TG, 38% in CRP, and 39.3% in ESR between the E4 and E3 alleles.
RESULTS
Genotypic and allelic frequencies of the ApoE gene
Patients with RA were significantly older than the controls (p < 0.001), with a median age of 62.2 years [interquartile range (IQR) 53–69.1] compared to 51 years (IQR 39.75–61), respectively. Sex distribution also differed, with a higher proportion of females among patients with RA (73% vs 60.1%; p < 0.001). The ethnic split of the 2 populations was comparable, with 97% of patients with RA and 97.2% of controls being white.
The genotypic (p = 0.908; Table 2) and allelic frequencies (E2, 59 vs 64; E3, 604 vs 659; E4, 111 vs 117; p = 0.894) were not different between patients with RA and controls, and remained so following adjustment for age and sex (p = 0.910 and p = 0.900, respectively). Genotype frequencies were found to be in Hardy-Weinberg equilibrium.
Frequency of apolipoprotein E (ApoE) genotypes in patients with rheumatoid arthritis (RA) and healthy controls.
Differences in clinical characteristics of patients with RA according to ApoE allele (Table 3)
Clinical characteristics across the ApoE alleles (excluding patients taking statins). Results expressed as percentages, median (25th–75th percentile values), or mean ± SD as appropriate.
Age (p = 0.061) and sex (p = 0.331) did not significantly differ according to the presence of the E2 or E4 allele. Methotrexate use was significantly lower in patients with the E2 allele compared to those with the E3 or E4 allele (39.5% vs 62.5% vs 60.3%, respectively; p = 0.021). Dyslipidemia was least prevalent in patients with the E2 allele and highest in patients with the E4 allele (E2, 33% vs E3, 61.2% vs E4, 73.1%; p < 0.001). No significant differences were observed in the prevalence of other CVD risk factors such as hypertension (p = 0.537), diabetes mellitus (p = 0.962), body mass index (BMI; p = 0.739), or smoking (p = 0.596). The metabolic syndrome (defined by the 2009 joint consensus criteria48) was lower in patients with 1 or more E2 or E4 alleles than in the parent form, E3E3 [E2, 18 (10.5%), E4, 54 (31.4%) vs E3E3, 100 (58.1%); p = 0.035]. Prevalent CVD did not differ across the genotypes (p = 0.970). However, if high-risk patients (those receiving lipid-lowering therapy) were included in the analysis, a trend was observed with the prevalence of CVD lowest among patients with the E2 allele and highest among patients with the E4 allele (E2, 16.3% vs E3, 20.4% vs E4, 28.1%; p = 0.074).
Association between ApoE alleles and lipid levels in RA
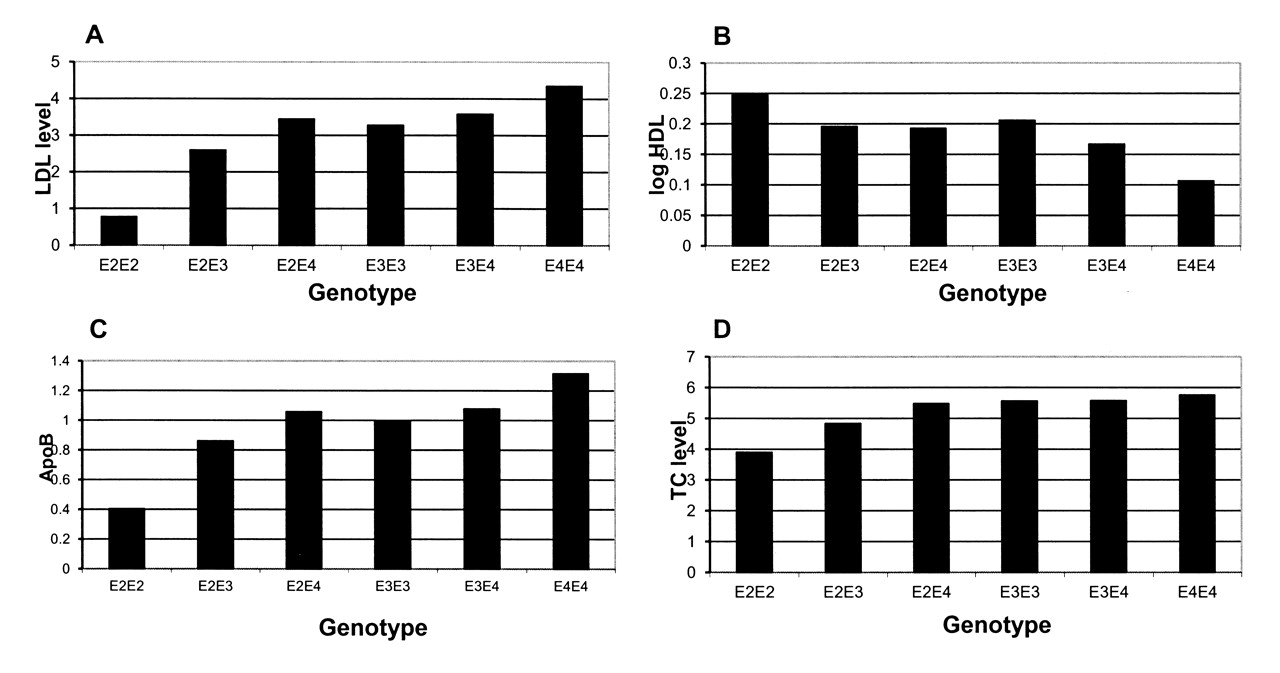
Univariate analyses demonstrated significant differences in lipid levels according to the ApoE allele present (Figure 1). TC (p < 0.001), LDL (p < 0.001), and ApoB (p = 0.004) were all lower in patients with the E2 allele (E2E3, E2E2) compared to those with the parent E3 allele (E3E3). ApoB levels were significantly higher in patients with the E4 compared to the E3 allele (p = 0.034), with a trend for LDL also to be higher among patients with the E4 compared to the E3 allele (p = 0.066; Table 3).

Lipid levels across the apolipoprotein E (ApoE) genotypes in patients with rheumatoid arthritis (excluding patients receiving statins). A. Low-density lipoprotein levels according to genotype. B. High-density lipoprotein levels according to genotype. C. ApoB levels according to genotype. D. Total cholesterol levels according to genotype.
After adjustment for potential confounders [age, sex, RA characteristics (CRP, HAQ, rheumatoid factor status), BMI, glucose levels, and antirheumatic medication (methotrexate, sulfasalazine, hydroxychloroquine, leflunomide, anti-tumor necrosis factor therapy, prednisolone)] in a general linear model, TC (p = 0.001), LDL (p = 0.009), and ApoB (p = 0.001) levels remained significantly lower in patients with the E2 allele (E2E3, E2E2), while LDL (p = 0.009) and ApoB (p = 0.009) remained significantly higher in patients with the E4 allele (E3E4, E4E4) compared to those with the E3 (E3E3) allele (Table 4).
Multivariate analysis demonstrating associations of lipid measures and inflammatory markers with the ApoE genotypes. Bold text indicates statistically significant result (p < 0.05).
These findings were replicated in allele dose analyses.
Associations between ApoE alleles and inflammatory markers
Univariate analyses demonstrated that E4 heterozygotes (E3E4) or homozygotes (E4E4) had significantly lower levels of CRP (p = 0.005), ESR (p = 0.002), and DAS28 scores (p = 0.024) compared to patients with the E3 (E3E3) allele. No significant differences in CRP, ESR, or DAS were found between the E2 and E3 alleles. However, allele dose analyses not only confirmed the above findings for the E4 allele but also demonstrated CRP to be significantly higher among patients with 1 or more E2 alleles compared to patients with no E2 alleles (p = 0.009).
After adjustment for potential confounders [age, sex, RA characteristics (HAQ, rheumatoid factor status), and medication (methotrexate, sulfasalazine, hydroxychloroquine, leflunomide, anti-tumor necrosis factor therapy, prednisolone)] in a general linear model, lower CRP (p = 0.007), ESR (p = 0.001), and DAS28 scores (p = 0.015) remained significantly associated with the E4 allele (Table 4). The association of the E2 allele with CRP in the allele dose-dependent analysis remained significant following adjustment for potential confounders (p = 0.044). No significant differences in ESR or DAS28 were found between the E2 and E3 allele.
Analysis of the data was repeated following the exclusion of data for ethnic minorities; however, the results remained unchanged (data not shown).
DISCUSSION
To our knowledge, this is the first study to assess the frequency and role of ApoE genotypes in patients with RA. We did not find significant differences in the frequency of ApoE genotypes between patients with RA and local population controls, but as expected from general population studies, ApoE genotypes were major determinants of lipid levels in patients with RA, too. We also demonstrate for the first time in a “high-grade” inflammatory condition, i.e., RA, that ApoE genotypes associate with the intensity of inflammation. The overall influence of ApoE genotypes on both articular and cardiovascular outcomes in RA requires further study.
For decades, lipid levels have been shown to be predictive of CVD risk49,50,51 and are widely used in CVD risk algorithms47,52,53. Our study demonstrates that ApoE genotypes are strongly linked to lipid levels in RA. The effects of the genotypes are similar to those seen in the general population, with the E2 allele associated with low levels of TC and LDL and the E4 allele associated with high levels of TC and LDL. Interestingly, one study has reported that the effects of ApoE on regression of atherosclerosis occurs independently of changes in lipid levels54. Irrespective of this we found that RA patients harboring the E4 allele are twice as likely to have dyslipidemia as those with the E2 allele, thus potentially increasing their risk for CVD.
Inflammation is fundamental to all stages of atherosclerotic plaque formation10 and is now recognized as an independent CVD risk factor38. ApoE is known to play a key role in “low-grade” subclinical inflammation55,56,57; however, its role in the context of high-grade systemic inflammation had not previously been studied. The association between ApoE genotypes and inflammatory markers appears to be amplified in RA. However, the pattern of allelic association mirrors that observed in the general population, with the E2 allele predicting the highest and the E4 allele the lowest CRP levels57. In RA, CRP is an important marker of disease activity and severity, thus it is possible that these ApoE genotypes may also have prognostic value for arthritis and functional outcomes. DAS28 and ESR were also significantly lower in patients with the E4 allele compared to the E2 or E3 allele, but there were no significant associations between ApoE genotypes and other markers of disease severity (HAQ scores or number of joints replaced). This may be due to lack of power to detect such associations. Further specifically designed studies are required to assess the effects of the ApoE genotypes on markers of disease severity and progression, for example, progression of erosive damage.
In the general population, it is well described that the E4 allele increases CVD risk30; whether the E2 allele is “protective” is less clear16. ApoE genotypes did not significantly associate with prevalent CVD in this RA cohort, probably due to insufficient power, but a trend was observed (p = 0.074). It is still feasible that polymorphisms of the ApoE gene contribute to atherosclerotic plaque formation in RA through inflammation-mediated suppression of gene transcription. At the level of the atherosclerotic plaque, ApoE is primarily produced by macrophages and it exerts antiatherogenic properties by facilitating reverse cholesterol transport. Interestingly, a recent study using lipopolysaccharide (LPS) treatment to mimic inflammatory stress has demonstrated that LPS levels repress ApoE gene expression in macrophages through its effects on inflammatory signaling pathways58. Such mechanisms are likely to be escalated in RA as a consequence of high levels of systemic inflammation, and this should be addressed in specifically designed studies.
The strengths of our study include the detailed clinical and laboratory characterization of patients with RA and use of a local control group for the genetic comparisons. The most important limitation of the study is its cross-sectional design, which does not allow definitive interpretation of the causality and directionality of the associations found. Due to the single timepoint data collection, we were unable to take into account biological variations in inflammatory or lipid measures that may also have affected the results. In addition, although this is by far the largest single study to assess the effects of ApoE genotypes on lipid levels and inflammatory markers, it may lack statistical power to detect associations with CVD or RA disease severity. Specifically designed large-scale longitudinal studies are required to confirm/refute our findings (e.g., longitudinal data collection, measurement of postprandial lipid levels59).
We found no differences in the genotypic or allelic frequencies of ApoE between patients with RA and local population controls. However, ApoE genotypes appeared to be strong predictors of TC, LDL, CRP, ESR, and DAS in RA. The ApoE gene may prove to be a useful prognostic marker for arthritis and vascular outcomes in RA, and this needs to be elucidated in further longitudinal studies.
Footnotes
-
Supported by an Arthritis Research Campaign Clinical Fellowship grant (grant 18848 to Dr. Toms) and an Arthritis Research Campaign infrastructure support grant (grant 17682 to the Dudley Group of Hospitals NHS Foundation Trust, Department of Rheumatology). Dr. Panoulas is supported by a PhD Scholarship from Empirikion Institute, Athens, Greece.
- Accepted for publication September 8, 2011.
REFERENCES
- 1.
- 2.
- 3.
- 4.
- 5.
- 6.
- 7.
- 8.
- 9.
- 10.
- 11.
- 12.
- 13.
- 14.
- 15.
- 16.
- 17.
- 18.
- 19.
- 20.
- 21.
- 22.
- 23.
- 24.
- 25.
- 26.
- 27.
- 28.
- 29.
- 30.
- 31.
- 32.
- 33.
- 34.
- 35.
- 36.
- 37.
- 38.
- 39.
- 40.
- 41.
- 42.
- 43.
- 44.
- 45.
- 46.
- 47.
- 48.
- 49.
- 50.
- 51.
- 52.
- 53.
- 54.
- 55.
- 56.
- 57.
- 58.
- 59.