

Abstract
Objective. We aimed to systematically review rheumatoid arthritis (RA) disease severity indices for use in administrative healthcare databases. We also provide an overview of alternative methods to control for RA disease severity in administrative database research.
Methods. We conducted a systematic review of studies that developed/validated an index for RA disease severity using variables in administrative databases, and compared the convergent validity/reliability of the index with a standard measure of RA severity.
Results. After reviewing 539 articles, 2 studies were included. The claims-based index for RA severity (CIRAS) was developed in one study. Components of the CIRAS included tests for inflammatory markers, number of chemistry panels/platelet counts ordered, rheumatoid factor test, number of rehabilitation and rheumatology visits, and Felty’s syndrome. The CIRAS correlated moderately well with a previously validated RA medical records-based index of severity. The second study assessed whether current and lifetime treatment with disease-modifying antirheumatic drugs and/or biologics accurately predicted RA severity, as measured by the patient-reported Patient Activity Scale (PAS). Treatment variables did not fully distinguish patients in the highest and lowest quartiles of PAS scores (67.2% correctly classified).
Conclusion. Two claims-based indices of RA severity were identified but have some limitations for routine use. A concerted effort from experts in the field is needed to define, develop, and validate a widely applicable measure of RA disease severity for administrative database research.
- RHEUMATOID ARTHRITIS
- PHARMACOEPIDEMIOLOGY
- SEVERITY OF ILLNESS INDEX
- INSURANCE CLAIM REPORTING
- DATABASE MANAGEMENT SYSTEM
Rheumatoid arthritis (RA) is a chronic autoimmune condition, primarily characterized by pain, swelling, and deformity of the joints1. RA severity may vary over time, and its heterogeneous clinical manifestations require complex management. Healthcare databases are increasingly used to examine population-based outcomes in RA. Patients with RA have an increased risk of adverse events including infections, malignancies, and cardiovascular diseases4,5,6. Many studies have linked this higher risk of comorbidities, at least in part, to disease-modifying antirheumatic drugs (DMARD) and biologic agents used to treat RA. For example, tumor necrosis factor-α (TNF-α) inhibitors are associated with infections like tuberculosis and invasive fungal disease7,8,9,10. TNF-α inhibitors and some traditional DMARD have also been related to an excess risk of lymphoma, although this remains controversial11,12,13.
An important limitation of these pharmacoepidemiological studies is the inadequate control for confounding by disease severity. In practice, disease severity is difficult to define but, as a construct, may reflect disease activity, damage, or both14. In most circumstances, the severity of RA determines the intensity of treatment. In observational studies, patients with RA who are selected to receive DMARD or biologic therapies are systematically different from those who are not treated with these agents15,16. Any increased harm found among the treated patients may be mistakenly attributed to the treatment, when in fact it may be the result of more active disease17. Indeed, confounding by disease severity may occur when a drug is preferentially prescribed to patients with a worse baseline prognosis18. If adjustment for RA severity is incomplete, an overestimation of the relationship between drug exposure and outcome may result19.
Administrative or healthcare claims databases (e.g., physician billing and hospitalization databases) were created notably to administer payments to healthcare professionals. These databases prospectively collect patient information such as demographics, hospitalizations, and physician visits, and often can be linked with prescriptions data, cancer, and birth-malformation registries20. Several administrative databases are currently available for observational studies in North America, including Canadian provincial healthcare databases (e.g., Québec and Ontario), different American health maintenance organizations (e.g., Kaiser Permanente and US Veterans Affairs), and Medicaid databases (e.g., Tennessee and New Jersey)20.
One advantage of these databases is that multiple drug exposures can be evaluated simultaneously. In addition, they offer population-based data and are thus more representative of the general population than drug trials. Also, the large sample sizes allow the assessment of relatively rare outcomes, such as malignancies21,22. Because these databases are created for reimbursement purposes, their major disadvantage is that they lack information on important clinical variables, such as the number of tender and swollen joints, which would traditionally be used to assess disease severity in RA20.
Administrative databases may, however, contain correlates of disease severity that could, theoretically, reduce bias due to confounding by disease severity. Surrogates, including the number of physician visits, acute-care hospitalizations, joint replacement surgeries, or dispensing of different DMARD or biologic agents, are typically indicative of more severe RA23,24. Thus, partial adjustment for disease severity may be possible in administrative databases.
The objective of this investigation was to systematically review the literature for studies that aimed to develop and/or validate a health claims-based index for RA disease severity. Studies that developed a tool using variables available in administrative databases and that compared its validity and/or reliability with a clinical measure of RA severity were included for review. We also discuss alternative methods to control for RA disease severity in administrative database research.
MATERIALS AND METHODS
This study was developed according to the Consort Group’s Preferred Reporting Items for Systematic Reviews and Meta-Analyses guidelines, and followed a protocol that prespecified study selection, eligibility criteria, quality assessment, and data abstraction25.
Search strategy
We conducted a systematic review of articles using the following electronic databases: PubMed (1950–July 2010), Embase (1980–July 2010), and Web of Science (1991–July 2010). No language restrictions were applied. We used Medical Subject Heading and free text terms adapted for each database (see Appendix 1 for complete list of search terms). We included search terms for (1) rheumatoid arthritis; (2) disease activity, disease severity, or disability; and (3) administrative database. All terms within each set were combined using the Boolean operator “OR” and then the 3 sets were combined using “AND”. We hand-searched reference lists and review articles for relevant articles not identified by the electronic searches. Any pertinent secondary references, including meeting abstracts, were also reviewed.
Study selection
Two independent reviewers (BK and EV) screened the titles and abstracts of all studies for eligibility. We included cohort studies of adult patients with RA (aged ≥ 18 years) that assessed disease severity using information from an administrative data source (or that would be routinely available in administrative databases). We also assessed the convergent validity or reliability (qualitatively or quantitatively) of the health claim-based severity index against at least 1 clinical measure of disease severity (see Appendix 2 for complete list). Any disagreement between the 2 reviewers was resolved by consensus, or if necessary, by a third party.
Data extraction
Two observers (BK and EV) independently extracted data on study type, patient population and baseline characteristics, components of the health claim-based index used, type of clinical comparator of disease severity used, and any reported measures of the strength of association/correlation between the index and clinical comparator.
Quality assessment
All included studies were independently assessed for methodological features most relevant to the control of bias in observational studies by using the quality assessment tool developed by Hayden, et al26. Before data extraction and quality assessment were finalized, any remaining disagreements were resolved by consensus.
RESULTS
Studies included
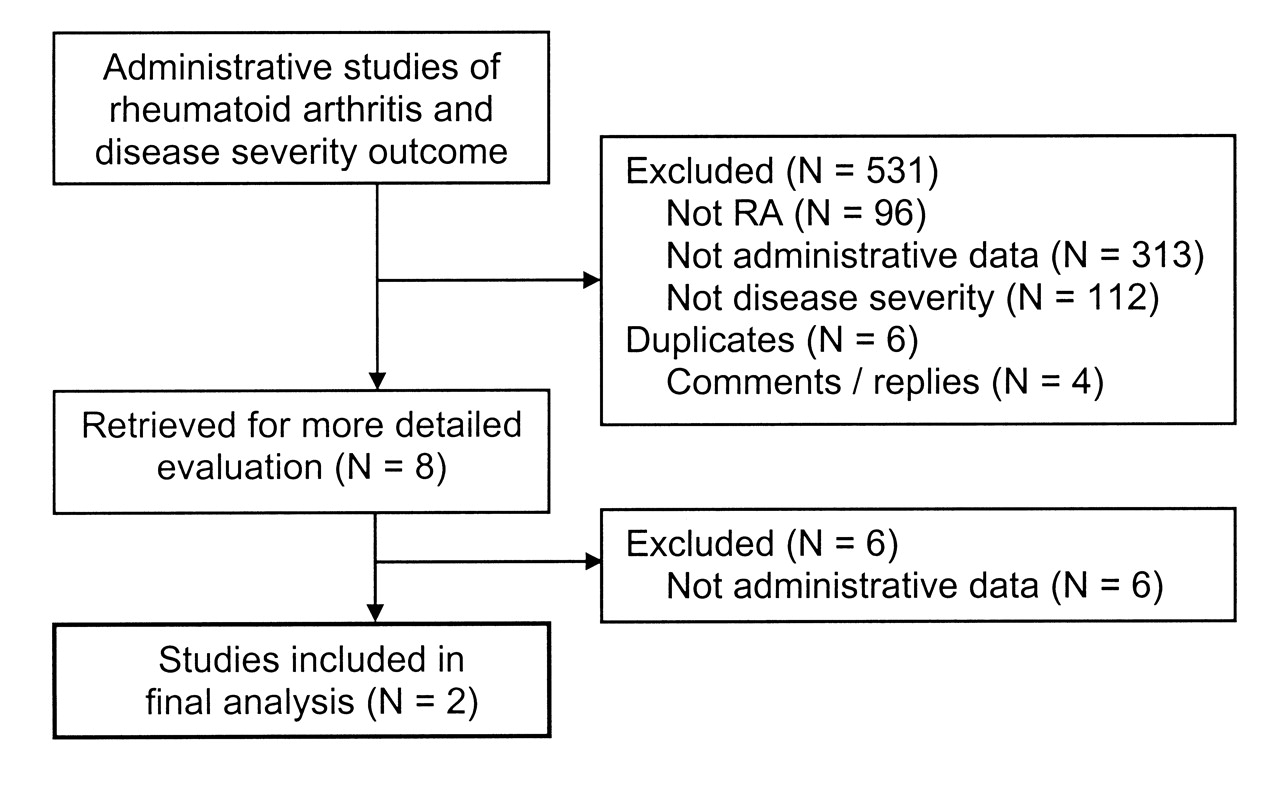
The literature search identified a total of 536 studies that matched the predefined search terms. Three were additionally identified by hand-searching reference lists. Of the potentially relevant studies retrieved, the majority were excluded because the data were not from and/or could not be derived from an administrative data source (Figure 1). A total of 2 studies were included in the final analysis and were judged to be of sufficient quality.

The selection process of studies evaluated for inclusion in the systematic review.
Study characteristics
Study 1
Ting, et al24 aimed to develop a healthcare claims index of RA severity, using a previously developed RA medical records-based index of severity (RARBIS). The RARBIS was based on ratings of potential indicators of RA severity commonly found in medical charts by a Delphi panel of 6 rheumatologists27. Indicators ranked as having strong or very strong association with RA severity were included in the RARBIS, and subjectively weighted by the panel based on the perceived association with disease severity. The RARBIS includes items pertaining to the following categories: radiological and laboratory results, surgeries, extraarticular manifestations, clinical and functional status, and medications. The RARBIS has been shown to correlate moderately well with RA treatment intensity and the 28-joint Disease Activity Score (DAS28) in a cohort of US Veterans Administration (VA) patients28.
The population studied by Ting, et al comprised patients from the New England VA Health System who had at least 2 recorded visits with a diagnosis of RA (International Classification of Disease, 9th ed, code 714.0) and at least 2 hospital outpatient visits between July 1999 and June 2001, with sufficient evidence of RA from their medical record. One hundred twenty patients were included and their characteristics are summarized in Table 1.
Characteristics of the patients in the 2 studies included for review.
The authors developed the claims-based index of RA severity (CIRAS) by using linear regression models. Modeling the RARBIS as a function of different administrative data variables, they used diverse model selection procedures to obtain the best model, as defined by the highest model R2. The CIRAS was composed of the administrative variables present in the best model, which included the following variables assessed over the preceding year: age, sex, Felty’s syndrome, number of rheumatology visits, rehabilitation visits (physical and occupational therapy), rheumatoid factor (RF) testing, and the number of platelet counts, inflammatory markers and chemistry panels ordered. Each of these items was weighted by its regression coefficient. For each patient in the study, both the CIRAS and RARBIS (with and without the medication subscale) were calculated using data from the administrative database and the medical charts over the past year. Then, the investigators examined the correlation between the claims-based RA severity variables (CIRAS) and the RARBIS using the Spearman correlation coefficient. The mean score for the RARBIS with the medication subscale was 4.4 (range 0–11) and without medications was 3.0 (range 0–8), and the mean CIRAS score was 4.38 (range 1.18–8.11). The Spearman correlation coefficients between the composite CIRAS score and the RARBIS with the medication subscale was 0.56, and without the medication subscale was 0.51 (both with p < 0.0001), indicating moderate correlation with the RARBIS29. The individual variables were weakly correlated with the RARBIS. Table 2 shows the adjusted correlation coefficients for each proposed variable. The authors’ suggested scoring of the CIRAS is found in Table 3.
Characteristics of the included studies.
Suggested scoring method for claims-based index of rheumatoid arthritis severity (CIRAS) by Ting, et al24.
Since the CIRAS was moderately correlated with the RARBIS, the authors concluded that this index could potentially be used for adjustment of RA severity in studies using claims data, but urged future studies to examine its validity in other samples.
Study 2
Wolfe, et al30 assessed whether current treatment with DMARD and/or biologics (i.e., infliximab, etanercept, adalimumab, or anakinra) and lifetime number of DMARD and/or biologics accurately predicted severity among patients with RA. To assess severity, they used the Patient Activity Scale (PAS), which is composed of the Health Assessment Questionnaire (HAQ), a visual analog scale (VAS) for pain, and a VAS for global severity. This patient-completed scale has been shown to be strongly correlated with disease activity and severity, and is reported on a 0–10 scale by multiplying the HAQ by 3.33, and then dividing the sum of the VAS pain, VAS global, and HAQ by 331.
The investigators studied patients with RA enrolled in the National Data Bank for Rheumatic Diseases (NDB) longitudinal study of RA outcomes. Participants in the NDB cohort are recruited from rheumatologists’ practices in the US and are prospectively followed with semiannual questionnaires, recording information such as demographic and treatment variables. For the present study, the authors included patients with RA who had completed at least 1 semiannual questionnaire between January 2002 and December 2004. They excluded patients who were participants in a safety registry. For each patient, a single visit was randomly selected in the specified time interval. Although the study population did not originate from an administrative database, this study was included in our review because it used treatment information available in administrative databases as a surrogate of disease severity, and specifically assessed the validity of this surrogate.
Characteristics of the 7541 patients included in the study are presented in Table 2. Similar to the study by Ting, et al24, information on baseline variables typically associated with more severe disease was not reported. The majority of patients (81.7%) were currently using a DMARD and/or a biologic, 74.2% were using a DMARD, 33.1% a biologic, and 18.3% were taking neither DMARD nor biologics. The median PAS score was 3.4. The greatest median PAS scores were found in patients not taking a DMARD or biologic [PAS 3.7, interquartile range (IQR) 1.7–5.7], and in those who were currently using a DMARD and biologic (PAS 3.7, IQR 2.0–5.4).
Wolfe, et al assessed the ability of treatment variables to predict PAS by calculating the area under the receiver-operating characteristic (ROC) curve and the percentage correctly classified for 2 logistic regression models. Both models used the same independent variables to predict PAS group: current treatment with each individual DMARD and/or biologic, the lifetime number of DMARD and/or biologics ever used, age, sex, and RA disease duration. In the first model, the authors measured the predictive ability of treatment variables to correctly classify patients with PAS scores above or below the median PAS value for the entire cohort. In the second model, they aimed to adequately predict patients with a PAS score in the fourth quartile compared to the first quartile. The area under the ROC curve was 0.64 for the first model, and the percentage correctly predicted was 60.5%. In the second model, the area under the ROC curve was 0.70 and the percentage properly classified was 67.2% (Table 1).
In their conclusion, the authors determined that the sole use of DMARD/biologics and demographic variables in administrative data does not distinguish disease severity groups with adequate sensitivity and/or specificity.
DISCUSSION
Through this systematic review, we found 2 studies that aimed to develop or validate an RA disease severity index for use in administrative database research.
Ting, et al24 built a complex RA severity index, the CIRAS, as a function of a previously developed medical records-based severity index, RARBIS. Although the CIRAS was derived from the selection of the best model predicting the RARBIS, it offered only a moderate correlation with the RARBIS. Their study has some limitations. The investigators used as their reference standard the RARBIS, previously shown to correlate only moderately with disease activity, and for which the reliability has not been thoroughly assessed. Moreover, they used their reference standard to develop the new index. In doing so, and by using the same group of patients in which the new index was developed, some correlation between both indices was expected32. Moreover, variables included in the CIRAS were selected because they were part of the best model identified through diverse selection procedures, not because of an a priori hypothesis that they were related to disease severity, although most variables (extraarticular involvement, RF testing) would be expected to correlate with clinical disease, and so they do provide face validity to the CIRAS. Some have questioned whether components of the RARBIS are appropriate measures of disease severity (e.g., joint surgery) or whether they principally represent aspects of irreversible damage, although joint surgery is obviously likely a correlate of prior disease activity and overall disease severity14. Although the CIRAS index may allow adjustment of some aspects of RA disease severity, further research is required.
Wolfe, et al30 studied a large RA cohort to determine if treatment variables could predict disease severity30. Their model (including current use of a specific DMARD and/or biologic and lifetime number of these drugs) only partially discriminated patients with high disease severity from those with low severity, as defined by the PAS. Patients with high severity scores were found at both ends of the therapeutic spectrum: those not currently taking a DMARD or a biologic, and those currently taking both a DMARD and a biologic. Again, some limitations might be noted; most importantly, the reference standard was a patient-reported measure, which likely led to significant misclassification of disease severity. It is unclear why the authors decided to exclude patients enrolled in a safety registry. They stated that this was done to prevent selection bias and avoid including participants in a registry who typically have more severe disease. Since patients in the NDB cohort came from the general practice of US rheumatologists, this exclusion criterion may have prevented the investigators from evaluating the full range of disease severity ideal for validation of an index. Further, the study findings may not be generalizable to other countries where a larger proportion of the population is covered by a government medication plan and must satisfy strict clinical criteria (often based on disease severity) to be reimbursed for biologic agents. Thus, it is possible that, in other settings, the use of demographic and treatment variables may better distinguish RA severity.
While performing our systematic search, we found 1 study that assessed the relationship between the number of visits to a rheumatologist and the changes in functional disability (measured by the HAQ) in a community-based cohort of 127 patients with RA33. The study by Ward, et al was not included in our final set of articles because it did not specifically aim to develop a measure of disease severity and did not use an administrative data source. However, this study is of particular interest since it offers the opportunity to examine if rheumatology visit frequency is a good correlate of disease severity, as measured by the HAQ. Adjusting for potential confounders, the investigators observed a U-shaped relationship between the average visit frequency and the rate of progression of functional disability (the minimum rate of progression corresponded to a visit frequency of 7 visits per year). Although that study was conducted before the biologics era — and at a time when many visits to rheumatologists were for intramuscular gold injections — it emphasizes the complex relationship between medical visits and RA severity. On one hand, infrequent visits may reflect inactive disease, but may also occur among noncompliant patients, who are more likely to have worse disease. Similarly, frequent visits may indicate high adherence to medical management or may represent poorly controlled symptoms that warrant close monitoring. Therefore, more work is needed to assess whether or how visit frequency can independently be used as a correlate of disease severity in health-claims databases. Interestingly, comparison of unadjusted and adjusted risk ratios from observational data do suggest that “proxy” measures of disease severity (like rheumatology visits or orthopedic interventions) may partly correct for biases like channeling34.
An alternative to an RA severity index is the use of propensity scores. This is a method for producing treatment effects adjusted for nonrandom assignment, which is a problem in observational RA studies, since presumably treatment is preferentially used in more severe disease. A propensity score is based on the conditional probability of receiving a particular treatment given certain patient characteristics; patients with the same propensity score have theoretically the same probability of receiving treatment16. In contrast to other approaches to address confounding by indication, including restriction, stratification, matching, or multivariate adjustment, which are limited by the number of variables that can be controlled for simultaneously, the propensity score method can handle a large number of covariates35. This method creates a single variable (the propensity score) that represents the combined effect of each of the variables considered upon treatment initiation, which can be used for restriction, stratification, matching, or modeling35.
For example, unadjusted results from an observational study of the effect of anti-TNF therapy on malignancy very likely suffer from confounding by indication, which is difficult to control for completely because the number of variables that potentially differ between treated and untreated patients is large. As mentioned, one approach to address confounding by indication is the use of a matched cohort design, in which unexposed subjects with a specific covariate level (or pattern of covariates) are matched to exposed subjects with the same characteristic. However, matching works well with only a few variables and becomes more difficult as the numbers of matched variables increase. Since the reasons for allocation of anti-TNF agent may be complex and based on numerous variables (e.g., not only disease severity but also potentially history, healthcare access, etc.), it is likely that attempts at exact matching on all these variables will fail to find appropriate matches despite large sample sizes obtained from administrative databases (and failure to match on all relevant variables will result in residual confounding). Propensity scores avoid this by combining all the covariates into a single value that can serve as a matching variable, providing excellent balance between treated and untreated groups with respect to the covariates at hand35.
The propensity score model can include multiple variables that are not related to disease severity. Indeed, a propensity score is tailored to the treatment-outcome relationship under study, compared to a “one-size-fits-all” index of severity. It makes use of all available variables present in the database under study that predict treatment exposure (and outcome), as opposed to an index of severity designed for widespread use, which would rely only on variables available in most administrative databases. Moreover, propensity scores developed within an administrative database can provide a relatively detailed picture of a patient’s healthcare use, allowing integration of healthcare use variables such as counts of physician visits, hospital stays, and laboratory tests performed35. As noted, these measures of healthcare use may represent proxies for factors influencing medical decisions, including disease severity.
Although propensity score methods have the advantage of producing “quasi-randomization” in observational studies through the use of rich exposure models, the generalizability of their results is limited and they do not provide adjustment for unobserved confounders16. The propensity score can control only for known confounders that are measured and available in the dataset in question. Further, certain types of variables entered into the propensity score model can actually introduce more bias, so careful consideration is required during the variable selection process16,34. Because of these limitations, the use of propensity scores is not a “magic bullet” to completely eliminate confounding by disease severity. Hence, some authors prefer to continue to adjust for factors that are known or believed to be confounders, as opposed to using propensity score adjustment.
Instrumental variable analyses are another tool that could be used to deal with confounding by indication36. This method has the potential to adjust for both measured and unmeasured confounders of the exposure-outcome association under study. The concept is the following: the effect of an exposure on an outcome can be identified by making use of a relationship between the exposure and another variable, the instrumental variable (IV). However, to produce unbiased estimates, strict assumptions have to be fulfilled: (1) the IV must be strongly associated with the exposure; (2) the IV must not have a direct effect on the outcome; and (3) the IV must be independent of the exposure-outcome confounders37. The difficulty with RA disease severity is to find a perfect surrogate variable, satisfying the required assumptions for IV. Indeed, it has been argued that although IV can be useful in case of moderate confounding, they are less useful in the case of strong confounding, which is presumably the case for disease severity, because strong instruments are not always available, and the required assumptions are often violated38. Traditionally, well-recognized IV have been genetic markers, which are obviously not available in administrative databases. Thus, to date this approach has not been used to address confounding by RA disease severity in administrative database research, and one can arguably ask if good candidates for IV actually exist in most administrative databases.
Our systematic review highlights the absence of a comprehensive claims-based index of RA severity, and the paucity of studies aiming to develop one. In administrative database research, it is crucial to adequately measure RA activity/severity to reduce bias from confounding by disease severity. To date, only a few investigators have addressed this challenge, and we applaud their efforts. Further concerted effort from experts in the field is needed to define, develop, and validate a widely applicable measure of RA disease severity for use in administrative databases research. Such a measure could be used by different investigators to perform sensitivity analyses of the influence of confounding by disease severity on their effect estimates, which would enhance the validity and usefulness of the study findings. In the future, results obtained through this approach could eventually be compared with those alternatively obtained with a propensity score model using a minimal set of included covariates. As administrative database research has many advantages, particularly in relatively rare conditions such as RA, it is likely that this area of rheumatic disease research will fuel a lot of interest in the next few years. Until existing methodological gaps are filled, authors can only adjust for disease severity using 1 or more of the available methods, and must always include in their discussion the direction and magnitude of potential effects of residual confounding.
APPENDIX 1
Search terms used, according to electronic database.
PubMed
-
rheumatoid arthritis[tw] OR arthritis, rheumatoid[MeSH Terms] OR RA OR inflammatory arthritis[tw] OR early arthritis[tw]
-
administrative*[tw] OR database*[tw] OR database management systems[MeSH Terms] OR pharmacoepidemiology[MeSH Terms] OR insurance claim review[MeSH Terms] OR insurance claim reporting[MeSH Terms] OR health maintenance organizations[MeSH Terms] OR claim*[tw] OR billing code*[tw] OR claims-based ind*[tw] OR CIRAS[tw]
-
severity of illness index[MeSH Terms] OR disease activity[tw] OR disease severity[tw] OR disease disability[tw] OR DAS[tw] OR DAS28[tw] OR CDAI[tw] OR SDAI[tw] OR RARBIS[tw] OR HAQ[tw] OR global assessment[tw] OR VAS[tw] OR antirheumatic agents[MeSH] OR disease-modifying antirheumatic drug[tw] OR DMARD[tw]
EMBASE
-
rheumatoid arthritis/ or rheumatoid arthritis.mp. or RA.mp. or inflammatory arthritis.mp. or early arthritis.mp.
-
administrative*.mp. or data base/ or database*.mp. or database management systems.mp. or pharmacoepidemiology/ or health insurance/ or insurance claim review.mp. or insurance claim reporting.mp. or claim*.mp. or billing code*.mp. or claims-based ind*.mp. or CIRAS.mp.
-
severity of illness index.mp. or disease activity/ or disease severity/ or disability/ or disease disability.mp. or DAS.mp. or DAS28.mp. or CDAI.mp. or SDAI.mp. or RARBIS.mp. or HAQ.mp. or global assessment.mp. or VAS.mp. or antirheumatic agent/ or disease-modifying antirheumatic drug.mp. or DMARD.mp.
Web of Science
-
rheumatoid arthritis OR RA OR inflammatory arthritis OR early arthritis
-
administrative* OR database* OR database management system OR pharmacoepidemiology OR insurance claim review OR insurance claim reporting OR medicare OR health maintenance organizations OR claim* OR billing code* OR claims-based index OR CIRAS
-
severity of illness index OR disease activity OR disease severity OR disability OR disease disability OR DAS OR DAS28 OR CDAI OR SDAI OR RARBIS OR HAQ OR global assessment OR VAS OR antirheumatic agent OR disease-modifying antirheumatic drug OR DMARD
APPENDIX 2
Clinical measures of disease severity considered for analysis.
-
Disease Activity Score
-
Disease Activity Score in 28 Joints
-
Simplified Disease Activity Index
-
Clinical Disease Activity Index
-
Health Assessment Questionnaire
-
Physician Global Assessment of Disease
-
Patient Global Assessment of Disease
-
Visual Analogue Scale Pain or Severity
-
Rheumatoid Arthritis Medical Records-Based Index of Severity
-
Disease-modifying Antirheumatic Drug Use
-
Patient Activity Scale
Footnotes
-
Supported by the Canadian Arthritis Network. Dr. Vinet is the recipient of a Canadian Institutes for Health Research (CIHR) Fellowship; Dr. Bernatsky is the recipient of a Fonds de Recherche en Santé du Québec Career Award and a CIHR Junior Investigator Award.
- Accepted for publication June 29, 2011.


