

Abstract
Objective. Urate may have effects on vascular remodeling and atherosclerosis. We had shown an association between serum uric acid (SUA) and carotid atherosclerotic plaques. Inflammation and vascular remodeling in atherosclerosis promote coronary artery calcification (CAC), a preclinical marker for atherosclerosis. Here, we examined whether SUA is associated with CAC, using the same study sample and methods as for our previous carotid atherosclerosis study.
Methods. The National Heart, Lung, and Blood Institute Family Heart Study is a multicenter study designed to assess risk factors for heart disease. Participants were recruited from population-based cohorts in the US states of Massachusetts, North Carolina, Minnesota, Utah, and Alabama. CAC was assessed with helical computed tomography (CT). We conducted sex-specific and family-cluster analyses, as well as additional analyses among persons without risk factors related to both cardiovascular disease and hyperuricemia, adjusting for potential confounders as we had in the previous study of carotid atherosclerosis.
Results. For the CAC study, 2412 subjects had both SUA and helical CT results available (55% women, age 58 ± 13 yrs, body mass index 27.6 ± 5.3). We found no association of SUA with CAC in men or women [OR in men: 1.0, 1.11, 0.86, 0.90; women: 1.0, 0.83, 1.00, 0.87 for increasing categories of SUA: < 5 (referent group), 5 to < 6, 6 to < 6.8, ≥ 6.8 mg/dl, respectively], nor in subgroup analyses.
Conclusion. Replicating the methods used to demonstrate an association of SUA with carotid atherosclerosis did not reveal any association between SUA and CAC, suggesting that SUA likely does not contribute to atherosclerosis through effects on arterial calcification. The possibility that urate has divergent pathophysiologic effects on atherosclerosis and artery calcification merits further study.
Gout and hyperuricemia have been linked to adverse cardiovascular events1,2, but the biological mechanism is not clear. Persons with gout have an increased risk for cardiovascular disease (CVD) and increased prevalence of associated comorbidities1,3,4, including obesity, diabetes, dyslipidemia, hypertension, and coronary heart disease4,5,6,7,8. Despite these concurrent comorbidities, it remains possible that urate itself may play a role in the development of cardiovascular disease.
We have demonstrated that serum urate (SUA) was independently associated with carotid atherosclerosis, a preclinical marker of cardiovascular disease, even among individuals without cardiovascular comorbidities9, suggesting a possible direct role for urate in atherosclerosis. These findings are supported by in vitro data that have pointed toward potential vascular effects of soluble urate. In the presence of urate concentrations seen in vivo in human plasma, levels of vasodilatory nitric oxide are suppressed10, and vascular smooth-muscle cells proliferate, migrate, and express inflammatory mediators, as do cultured endothelial cells11,12,13,14. Elevated SUA in rats in vivo appears to promote hypertension, partly by effects on the renin-angiotensin system and afferent glomerular arteriolopathy11,15,16.
Coronary artery calcification (CAC) is a marker for early preclinical coronary artery disease17, and the extent of intimal artery calcification correlates with the extent of atherosclerosis18,19. CAC has been associated with death from coronary disease and all-cause mortality20,21,22, which may be mediated by the capacity of hydroxyapatite crystals deposited in the calcified intima to promote low-grade inflammation in the artery wall23. Prior studies have examined the association of carotid atherosclerosis or CAC with various risk factors for cardiovascular morbidity and mortality, but few have evaluated the relation of hyperuricemia to CAC, with conflicting results24,25. In this light, not all vascular calcification is related to atherosclerosis. For example, aging, endstage renal disease, and diabetes mellitus can cause nonatherosclerotic artery tunica media calcification. With respect to reported vascular effects of soluble urate, by suppressing nitric oxide levels in the artery, urate theoretically has the potential to suppress ectopic osteoblastic differentiation of vascular smooth-muscle cells26, which in theory could result in less vascular calcification than otherwise predicted in a disease such as atherosclerosis.
To further address potential effects of SUA on arterial disease, we sought to repeat our previous studies’ analytic methods using the same dataset, the National Heart, Lung, and Blood Institute (NHLBI) Family Heart Study, to evaluate the association between SUA and CAC. Using the same methods, and analyzing the same dataset that showed an association between SUA and carotid atherosclerosis, we now observed no significant association between SUA and CAC.
MATERIALS AND METHODS
Study population
The NHLBI Family Heart Study is a multicenter study designed to assess genetic and nongenetic determinants of heart disease27,28. The details have been published elsewhere9. In brief, participants were recruited from population-based cohorts: The Framingham Heart Study in Framingham, Massachusetts; the Atherosclerosis Risk in Communities cohorts in North Carolina and Minnesota; the Utah Health Family Tree Study in Salt Lake City; and the Hypertension Genetic Epidemiology Network in Alabama. Participants had clinical examinations, filled out questionnaires, had blood taken, and had imaging procedures at a followup visit at a central location. Because there were only 31 nonwhite participants, we limited our study sample to whites.
Outcome variables
CAC was assessed on cardiac computed tomography (CT) examinations carried out using GE Health Systems LightSpeed Plus and LightSpeed Ultra (GE Healthcare Technologies, Waukesha, WI, USA) or Philips MX 8000 Systems (Philips, Cleveland, OH, USA), using the same protocol as another NHLBI study29. CT images from all sites were sent electronically to the central reading center at Wake Forest University Health Sciences, Winston Salem, NC. CAC was measured with a standardized protocol by trained readers using dedicated hardware and software. An Agatston score was computed by summing the calcium score for each of the epicardial arteries (left main, left anterior descending, diagonals, circumflex, and right coronary). CAC was determined as being present if the Agatston score was ≥ 100, as has been used in previous studies28,30. This cutpoint has been associated with a sensitivity of 89%–95% and specificity of 79% for ≥ 75% stenosis by angiography, and to be predictive of cardiovascular events30.
Exposure variable
Serum uric acid (SUA) was measured in fasting blood using the Ortho Clinical Diagnostics (Rochester, NY, USA) Vitros thinfilm clinical analyzer method, which is an absorptiometry method31. Fasting blood was collected, processed at the Family Heart Study field centers27, and analyzed at the Family Heart Study Central Laboratory at the Fairview-University Medical Center in Minneapolis, MN.
Covariates
Information on smoking [never, former, current (including number per day)], alcohol intake (average number of drinks consumed per week on average over the past 12 months), comorbidities, and education was obtained by interview during the clinic visit. Use of medications was assessed using a questionnaire and medication inventory. Anthropometric data were collected while the participants were wearing scrub suits, with body weight measured on a balance scale and height measured with a wall-mounted vertical ruler. Cholesterol (total, high-density lipoprotein, low-density lipoprotein, triglycerides), creatinine, and glucose were measured using standard assays after a 12-h fast. Persons were asked if they ever had evidence of coronary artery disease, defined as myocardial infarction, percutaneous angioplasty, or coronary artery bypass graft surgery, and stroke. Hypertension was defined as the average of the second and third measurements (of 3) of a systolic pressure ≥ 130 mm Hg, diastolic pressure ≥ 85 mm Hg, or using antihypertensive medication. Diabetes/hyperglycemia was defined as having a fasting blood sugar ≥ 6.1 mM (110 mg/dl) or being on dietary or pharmacologic therapy for physician-diagnosed diabetes. Renal insufficiency was defined as creatinine clearance ≤ 60 ml/min. Aspirin use was categorized as none, ≤ 325 mg/day, or > 325 mg/day. Smoking was categorized as never, former, < 20/day, or ≥ 20/day. Education was categorized as ≤ 11 years, 12 years, > 12 years but ≤ 16 years, and > 16 years.
Statistical analysis
We repeated our previous analyses that we performed in evaluating the association of SUA with carotid atherosclerosis9. We divided serum uric acid (SUA) into 4 groups: < 5 (referent group), 5 to < 6, 6 to < 6.8, and ≥ 6.8 mg/dl. Individuals taking urate-lowering drugs were considered to be in the highest category of SUA. We used 6.8 mg/dl as one cutpoint as it is the concentration that meets or exceeds the limit of urate solubility, and is generally the SUA concentration used to define hyperuricemia32. The additional cutpoints were chosen for the target of < 6 mg/dl in the treatment of chronic gout33, while there is a theoretical concern that low SUA levels may be associated with adverse effects34. We also repeated analyses with sex-specific quartiles and by defining hyperuricemia as > 6.8 mg/dl as the threshold to categorize this dichotomously. We computed the sex-specific prevalence of CAC for each SUA category. We examined the relation of SUA and prevalence of CAC for men and women separately using logistic regression with generalized estimating equations35 to account for correlation among members of a family in our study. In the multivariable regression model, we adjusted for age, body mass index (BMI), smoking, alcohol intake, education, low-dose aspirin use, hypertension and its treatments (including diuretics), diabetes and its treatments, renal insufficiency, HDL:total cholesterol ratio, and study center. Sensitivity analyses were conducted with CAC defined as being present at a cutpoint of > 0 and ≥ 300, respectively.
To assess whether the association of SUA and CAC is modified by particular cardiovascular risk factors known to be associated with SUA, we performed further analyses stratified by such factors36. Specifically, we stratified by presence or absence of hypertension (and adjusted for mean arterial pressure in this analysis), of renal insufficiency, and of diabetes, respectively, as well as age (divided at the median age of 55 years) and BMI [obese (BMI ≥ 30 kg/m2) vs nonobese (BMI < 30 kg/m2)] to examine the association between SUA and prevalence of CAC within each strata and assessed effect-measure modification by each stratified variable. Further, we performed a stratified analysis by presence or absence of any of those 3 conditions (hypertension, renal insufficiency, and diabetes). We also repeated analyses restricted to postmenopausal women as premenopausal women tend to not have a wide range of SUA levels and a low prevalence of the outcomes of interest.
To account for the potential confounding effects of shared genetic or environmental factors within families, we performed a family-based case-control study to assess the relation of SUA and prevalence of CAC. Specifically, cases (i.e., participants with CAC) and controls (participants without CAC) within a family were matched by sex and by age within a 5-year interval (using the caliper method of matching). We then conducted sex-specific conditional logistic regression, adjusting for the same potential confounding factors as in the main analyses.
Finally, we also performed a quadratic spline regression37 to evaluate a dose-response relationship between SUA (as a continuous measure) and CAC. The knots were defined by the 10th, 25th, 50th, 75th, and 90th percentiles of SUA. We used linear regression for < 10th and > 90th percentiles and quadratic functions between those percentiles. Because of the correlated data, standard methods could not be employed for generating confidence bands.
A 2-sided p value < 0.05 was considered to be statistically significant. All analyses were performed using SAS 9.1 (SAS Institute Inc., Cary, NC, USA).
RESULTS
There were 2412 individuals who had both an SUA and a calcification assessment; their mean age was 57.9 years and about 54.9% were women. Twenty-six percent of men and 5.2% of women had SUA concentrations ≥ 6.8 mg/dl. The mean SUA in men was 6.1 (SD 1.9) μM and in women the mean SUA was 4.7 (SD 1.5) μM. Participant characteristics for men are presented in Table 1A and for women in Table 1B. The CAC sample was slightly older than the carotid plaque sample9.
Coronary artery calcification sample: participant characteristics according to serum uric acid levels in men.
Coronary artery calcification sample: participant characteristics according to serum uric acid levels in women.
The presence of CAC was not associated with SUA in men or women, after adjusting for potential confounders. In men, compared with those in the lowest SUA category (< 5 mg/dl), those with SUA levels of ≥ 5 to < 6 mg/dl, ≥ 6 to < 6.8 mg/dl, and ≥ 6.8 mg/dl had prevalence OR of 1.11, 0.86, and 0.90, respectively (p = 0.5 for the linear trend; Table 2). Similarly, women had prevalence OR of 1.0 (referent), 0.83, 1.00, 0.87, respectively (p = 0.7 for the linear trend). When analyses were limited to postmenopausal women only, hyperuricemia was associated with a prevalence OR of 1.11 (95% CI 0.57–2.14) for the presence of CAC. Overall, hyper uricemia was associated with a prevalence OR of 0.93 (95% CI 0.62–1.39, p = 0.7) for men and 0.95 (95% CI 0.51–1.76, p = 0.9) for women for presence of CAC.
Sex-specific association of serum urate (SUA) and prevalence of coronary artery calcification (CAC).
When the sex-specific analyses were restricted to those without hypertension, to those without renal insufficiency, or to those without diabetes, respectively, no associations between SUA levels and presence of CAC were noted (Table 3). Further, for individuals who had none of those comorbidities, the prevalence OR for CAC were 1.0 (referent), 0.78, 0.64, and 0.89 for men, and 1.0 (referent), 0.55, 0.35, and 0.20 for women, respectively, again supporting no association with higher SUA levels and presence of CAC. In contrast, individuals who had at least 1 of these comorbidities had the following prevalence OR: 1.0 (referent), 2.21, 1.39, 0.98 in men (p = 0.3 for the linear trend); and 1.0 (referent), 1.25, 1.81, 1.71 in women (p = 0.1 for the linear trend). Participants with these individual comorbidities present had no consistent dose-response relationship.
Sex-specific association of serum urate (SUA) and prevalence of coronary artery calcification (CAC) among persons without hypertension, renal insufficiency, or diabetes.
Sensitivity analyses in which the definition of CAC was altered were also performed. At a cutpoint ≥ 300, which increases specificity of the outcome definition, the prevalence OR were 1.0, 0.86, 0.60, 0.69 (p = 0.1 for linear trend), respectively, in men, and 1.0, 0.89, 1.43, 1.17 (p = 0.4 for linear trend), respectively, in women, for the SUA categories of < 5 (referent group), ≥ 5 to < 6, ≥ 6 to < 6.8, ≥ 6.8 mg/dl, respectively. When the cutpoint for the definition was changed to > 0, which decreases specificity of the outcome definition, the prevalence OR were 0.91 for those men with SUA levels of ≥ 5 to < 6 mg/dl, 0.94 for those with SUA levels of ≥ 6 to < 6.8 mg/dl, and 1.90 for those with SUA levels ≥ 6.8 mg/dl compared with those with SUA levels < 5 mg/dl (p = 0.05 for linear trend), suggesting a possible increased prevalence of minimal CAC in those men with the highest levels of SUA. However, this definition of CAC is unlikely to be clinically relevant. For women, the corresponding prevalence OR were 1.0 (referent), 1.09, 0.77, and 1.69 (p = 0.6 for linear trend).
The sex-specific family-matched case-control study approach yielded similar results to the original analysis. The CAC study participants were drawn from 545 families (median 4 persons/family). This approach yielded effect estimates of 1.24 (95% CI 0.44–3.49), 0.90 (95% CI 0.29–2.81), and 3.21 (95% CI 0.96–10.66) for those men with SUA levels of < 5 to < 6 mg/dl, ≥ 6 to < 6.8 mg/dl, and ≥ 6.8 mg/dl, respectively, compared with those men with SUA levels < 5 mg/dl (p = 0.04 for linear trend), suggesting that men with the highest SUA levels may have an increased prevalence of CAC. In women, the respective prevalence OR were 1.03 (95% CI 0.48–2.19), 1.03 (95% CI 0.38–2.75), and 0.95 (95% CI 0.27–3.33), respectively, compared with those with SUA < 5 mg/dl (p = 1.0 for linear trend), again demonstrating no association between SUA and CAC in women.
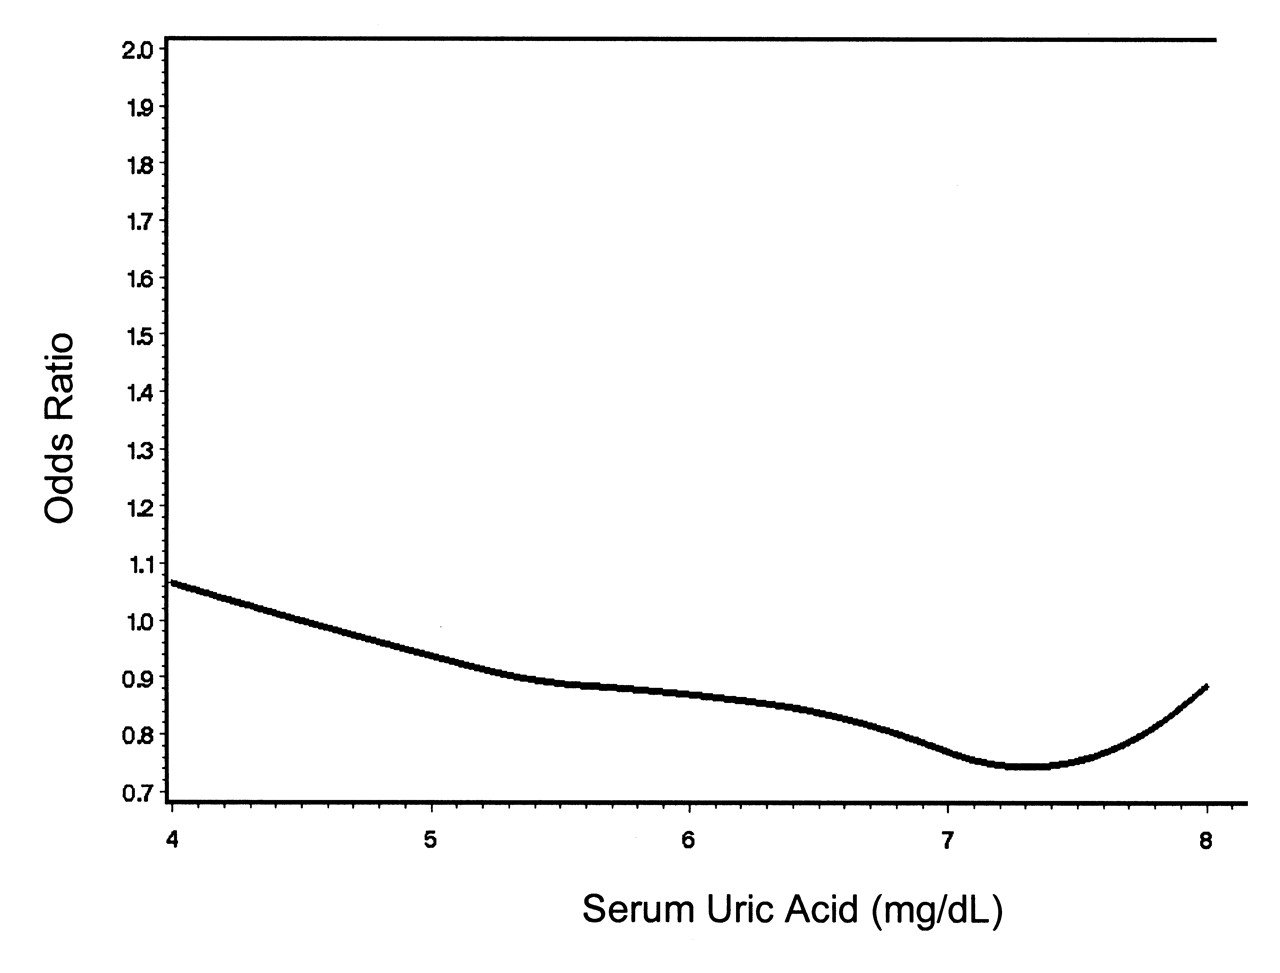
Finally, we performed a spline regression to further evaluate the relation of SUA with CAC and to assess whether there was a threshold effect despite not finding an association in our main analyses. No dose-response relation was seen, with the prevalence OR fluctuating near 1 for the entire range of SUA levels (Figure 1).

Spline regression depicting dose-response relation of serum uric acid and coronary artery calcification.
DISCUSSION
A complex set of environmental, genetic, and endogenous factors contribute to the etiology of preclinical cardiovascular disease, manifested by asymptomatic atherosclerosis. Carotid plaques and CAC noted on imaging are thought to be reflections of atherosclerosis. In contrast to our previous study, which demonstrated a clear association between SUA and carotid plaques9, the data in our current study did not support an association between SUA levels and CAC in men or women, including postmenopausal women, despite using the same analytic methods as in the NHLBI Family Heart Study.
Few studies have specifically evaluated the association of SUA and preclinical markers of coronary heart disease. In one study of CAC, there was no independent association of SUA levels24, similar to our results. Another study did find an association, but did not control for important confounders25. In our study, although the crude prevalence appeared to be higher among those with higher SUA levels, this was strongly confounded by age. While evaluating SUA dichotomously with the biologically relevant cutpoint of 6.8 mg/dl did not reveal any association with CAC, and the spline regression did not reveal a threshold effect, there was a suggestion in the family-matched case-control approach that men in the highest category of SUA (≥ 6.8 mg/dl) may have higher prevalence of CAC. As well, when the definition of CAC was loosened, using any non-zero Agatston score, there was a suggestion of increased prevalence of CAC among men. However, this finding must be interpreted cautiously as this definition of CAC has poor specificity38, and increasing sensitivity of the outcome introduces greater opportunity for misclassification bias.
The lack of convincing association of SUA levels with CAC is intriguing. While there are many potential mechanisms linking SUA to CVD through vascular remodeling and other risk factors, soluble urate has not been investigated as a potential direct inducer of arterial calcification. Soluble urate potentially decreases nitric oxide bioavailability through suppression of its production, promotion of its inactivation, and stimulation of its degradation11. This has potential implications for arterial calcification, since nitric oxide acts as a suppressor of ectopic osteoblastic transdifferentiation of vascular smooth-muscle cells26. Thus one may theoretically expect to see greater calcification in the presence of elevated urate concentrations. Despite this potential biologic system, we found no association between SUA and CAC.
It should be noted that CAC reflects hydroxyapatite deposition and can be seen in other conditions such as end-stage renal disease and diabetes, reflecting nonatherosclerotic medial calcification. Indeed, the prevalence of CAC was higher in those with these diseases in comparison to those without these diseases. With regard to atherosclerosis, soluble urate is held to play a pathogenic role in the vascular remodeling of cardiovascular disease by biologic mechanisms that include low-level uptake by endothelial and vascular smooth-muscle cells, induction of oxidative stress and inflammatory cytokine expression, and modulation of the renin-angiotensin system11,12,13,15,39,40. Thus, there may be different atherosclerotic phenotypes reflected by CAC compared to carotid plaques.
Several characteristics of our study are noteworthy. First, we repeated the same analytic techniques with the same dataset to demonstrate an association between SUA and carotid plaques. That we found an association of SUA with carotid plaques but not with CAC suggests that our findings regarding carotid plaques are unlikely to be related to residual confounding by risk factors related to coronary artery disease, because such residual confounding would have also been at play in the evaluation of CAC. Further, we were able to control for many known potential confounders, which were assessed according to standardized methods, thereby minimizing residual confounding. We performed additional separate analyses to specifically control for the presence of metabolic syndrome and the triglyceride:HDL ratio as an indirect marker of insulin resistance that did not alter the results. Second, we were able to assemble a large sample not only to examine the association between SUA and this marker of preclinical cardiovascular disease, but also to assess whether the association was modified by potential confounders. Further, there was sufficient prevalence of CAC in this sample to evaluate these associations in the context of these potential confounders. Thus our results are not likely related to insufficient power to detect an association. Finally, when we performed additional analyses to explore whether the relation of SUA with CAC may be explained by other mechanisms, such as potentially shared genetic or environmental factors, and sensitivity analyses for CAC cutoffs, the results remained similar. The results also did not change when we repeated separate analyses in which we excluded those on urate-lowering therapies (n = 31), and those who had previous coronary artery bypass graft surgery or percutaneous transluminal coronary angioplasty (n = 143).
Our study has some limitations. First, definitive conclusions about causality cannot be made, given that our findings are cross-sectional. Second, because multiple factors are likely to play a role in the development of CAC, residual confounding may still potentially account for our findings despite our various analytic strategies. Finally, any study attempting to detect a small or even null effect is likely to be underpowered. However, such a small effect, if it were to exist, is likely clinically unimportant, and further, our results suggest that, if anything, there is no increased risk of CAC with increasing levels of SUA.
SUA does not appear to be associated with arterial calcification under circumstances in which it was associated with atherosclerotic plaques. These results suggest that hyperuricemia may have divergent effects on phenotypes of atherosclerosis related to adverse cardiovascular outcomes, and warrant further study.
Footnotes
-
Supported by the National Institutes of Health (NIH) AR 47785; the National Heart, Lung, and Blood Institute (NHLBI) cooperative agreement grants U01 HL56563, U01 HL56564, U01 HL56565, U01 HL56566, U01 HL56567, U01 HL56568, and U01HL56569; NIH HL077360, NIH HL087252, and VA Research Service.
- Accepted for publication August 23, 2010.


