

Abstract
Objective. Studies have shown that obesity is associated with an increase in serum uric acid; and few data are available on the relationship between changes in measures of obesity and changes in uric acid concentrations. We investigated the relationship among percentage changes in waist circumference (%dWC), body mass index (%dBMI), and serum uric acid (%dUA).
Methods. The data of 3153 individuals [1968 men, 1185 women (536 premenopausal, 649 postmenopausal)] who underwent general health screening over a 2-year period and were not taking antihyperuricemic medication were analyzed.
Results. Stepwise multiple regression analysis showed that %dBMI was associated positively with %dUA in postmenopausal women and men, and the association retained statistical significance after adjustment for changes in blood pressure and in renal function. Association between %dBMI and %dUA was not significant in premenopausal women. In men, %dWC was a predicting factor for %dUA, although it did not remain significant when %dBMI was used as a covariate in the statistical model. Multivariate logistic regression analysis showed that the odds ratio of the association between the lowest %dBMI quartile (%dBMI < –1.86) and the lowest %dUA quartile (%dUA < –7.41) was 2.04 (95% CI 1.35–3.07) in postmenopausal women and 1.46 (95% CI 1.14–1.86) in men.
Conclusion. Weight loss may represent an effective nonmedical strategy for reducing serum UA levels, especially in postmenopausal women and men.
Obesity and serum uric acid (UA) are both associated with enhanced insulin resistance and incidence of metabolic syndrome1–3. In addition, measures of obesity have been reported to be positively associated with serum levels of UA4,5, an association that may be caused by impaired renal clearance of UA in the condition of obesity6. The finding that a reduction in weight, and thus in body mass index (BMI), may have a significant effect on serum UA7 and renal urate excretion6 suggests that changes in weight may play a role in the regulation of serum UA levels, although the reverse scenario might also be possible8. In our study, by analyzing individuals who underwent general health screening, we examined the influence of changes in waist circumference (WC) and BMI on changes in UA, and the dependency/independency on changes in either blood pressure or renal function, which is the possible critical factor affecting serum UA levels in healthy subjects9.
MATERIALS AND METHODS
Study population
The study was approved by The Ethical Committee of Mitsui Memorial Hospital. Between October 2005 and October 2006, 11,558 individuals underwent general health screening at our institute. Of these, 3326 individuals (2113 men, 1213 women) underwent general health screening during this period (first visit) and again the following year (second visit). Among these 3326 individuals, 3179 (1968 men, 1211 women) reported taking no antihyperuricemic drugs at either visit. Among the 1211 women, 1185 (98%) answered the questionnaire concerning whether they still had menstruation, and were enrolled for study. Therefore, we analyzed data of 3153 individuals (1968 men, 1185 women). The mean ± standard deviation (SD) interval between the 2 visits of the individuals enrolled was 356.2 ± 51.7 days. WC, BMI, UA, systolic blood pressure, and estimated glomerular filtration rate (eGFR) at the first visit were designated WC1, BMI1, UA1, BPs1, and eGFR1, respectively, and at the second visit WC2, BMI2, UA2, BPs2, and eGFR2.
The percentage differences between values of WC1 and WC2, BMI1 and BMI2, UA1 and UA2, BPs1 and BPs2, and eGFR1 and eGFR2 were designated %dWC, %dBMI, %dUA, %dBPs, and %deGFR. All participants were seen after an overnight fast. Height and weight were determined, and BMI was expressed as weight (kilograms) divided by the square of height (meters). With the subject standing, waist circumference was measured at the umbilical level to the nearest 1 cm by trained physicians and technicians10.
Laboratory analysis
Blood samples were taken after an overnight fast. Serum levels of low density lipoprotein (LDL), high density lipoprotein (HDL) cholesterol, and triglycerides were determined enzymatically. Serum UA was measured by the uricase-peroxidase method, and hemoglobin A1C by latex agglutination immunoassay. Creatinine was measured by TBA-200FR (Toshiba Medical Systems, Tochigi, Japan) using a commercial kit. Accuras Auto CRE (Shino-test, Tokyo, Japan) eGFR was calculated by the equation: eGFR = 194 × (serum creatinine)–1.094 × (age)–0.287 (× 0.739 if female)11. This equation was recently determined by a multicenter study, and differs from the equation12 that we used in previous studies13–15. Blood pressure was measured after about 10 min of rest with an automated sphygmomanometer.
Statistical analysis
Data are expressed as the mean ± SD unless stated otherwise. Analyses of variance with trend analysis and stepwise multiple regression analysis were conducted as appropriate to assess the statistical significance of differences between groups using SPSS II (SPSS Inc., Chicago, IL, USA). A value of p < 0.05 was taken to be statistically significant.
RESULTS
Baseline characteristics
We enrolled 536 premenopausal women, 649 postmenopausal women, and 1968 men for study. At the first visit the mean age of premenopausal women was 43.1 ± 5.51 years, postmenopausal women 59.1 ± 6.8 years, and men 53.3 ± 10.2 years. The sex-nonspecific range of the first to the fourth %dUA quartiles (maximum/minimum) was –47.2/–7.5, –7.4/–1.2, 0.0/7.1, and 7.2/77.8 (Table 1). A plot of WC1 and BMI1 compared to UA1 is shown in Figure 1. In both men and women, there was a statistically significant correlation between WC1 or BMI1 and UA1. The correlation coefficient between WC1 and BMI1 was 0.626 (p < 0.001) in premenopausal women, 0.563 (p < 0.001) in postmenopausal women, and 0.838 (p < 0.001) in men.
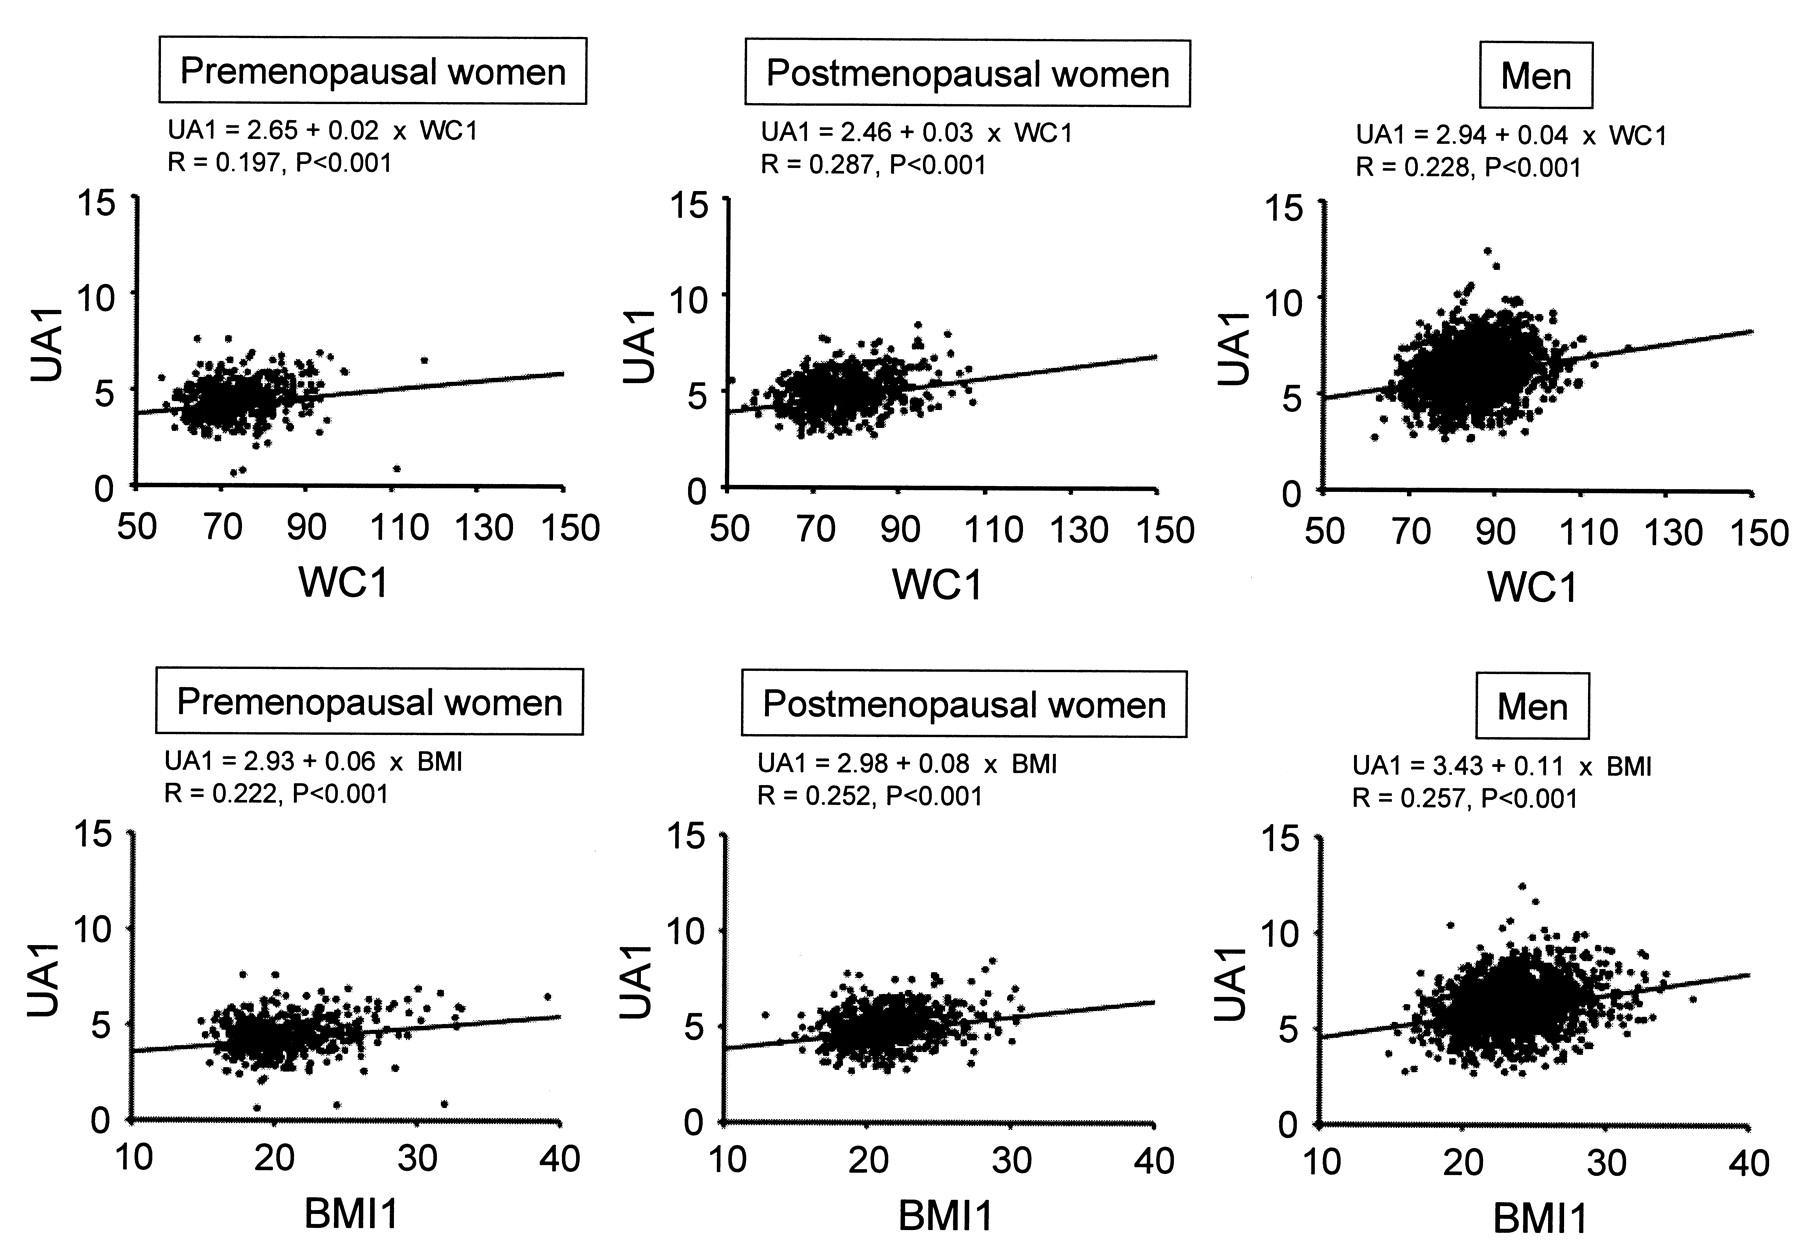
Scatterplot and linear regression between waist circumference at the first visit (WC1) and uric acid at the first visit (UA1) and those between body mass index at the first visit (BMI1) and UA1 in premenopausal and postmenopausal women and in men. Serum uric acid values were not adjusted for age or other possible confounders.
Baseline characteristics at the first visit according to %dUA quartiles.
Relationship between %dWC, %dBMI, and %dUA
The relationship between %dBMI and %dUA, although very weak, was significant in postmenopausal women and men, and the relationship between %dWC and %dUA was significant only in men (Figure 2). In premenopausal women, the relationships between %dWC and %dUA and between %dBMI and %dUA were not statistically significant. The correlation coefficient between %dWC and %dBMI was 0.267 (p < 0.001) in premenopausal women, 0.221 (p < 0.001) in postmenopausal women, and 0.484 (p < 0.001) in men.

Scatterplot and linear regression between percentage change in waist circumference (%dWC) and percentage change in uric acid (%dUA), and those between percentage change in BMI (%dBMI) and %dUA in premenopausal and postmenopausal women and in men. Serum uric acid values were not adjusted for age or other possible confounders.
We next performed stepwise multiple regression analysis (Table 2). In a model in which age, UA1, WC1, and %dWC were used as independent variables (model 1), %dWC was found to have independent predictive value for %dUA in men, but not in women. However, after adding BMI1 and %dBMI as independent variables, %dWC in men was no longer a predictor for %dUA (model 2). %dBMI was found to be a predictor for %dUA in postmenopausal women and men even after using either or both %dBPs and %deGFR as independent variables (models 3–5). On the other hand, in premenopausal women, %dBMI was not a significant predictor value for %dUA in any of these models. In addition, in a model in which age, UA1, BMI1, and %dBMI were used as independent variables, %dBMI again was not found to have significant predictive value for %dUA (data not shown). In model 5, variance inflation factor (VIF) scores of all the independent variables were less than 10 (data not shown).
Stepwise multiple regression analysis using %dUA as the dependent variable.
Logistic regression analysis
When the highest %dUA quartile (%dUA ≥ 7.25) was used as a dependent variable, logistic regression analysis showed that the highest %dBMI quartile (%dBMI ≥ 1.47) had a significant positive association in postmenopausal women and in men after adjusting for UA1 and BMI1 (Table 3, model 1). In these groups, statistical significance was retained even after further adjustment for %dBPs and %deGFR (model 2). On the other hand, in premenopausal women, the highest %dBMI quartile was, unexpectedly, negatively associated with the highest %dUA quartile, although statistical significance was lost after further adjustment for %dBPs and %deGFR. In all 3 subgroups tested, %deGFR was negatively associated with the highest quartile of %dUA.
Logistic regression analysis using the highest or lowest %dUA quartile as the dependent variable.
Logistic regression analysis showed that the lowest %dBMI quartile (%dBMI < –1.86) had a significant positive association with the lowest %dUA quartile (%dUA < –7.41) in postmenopausal women and men, and this remained statistically significant even after further adjustment for %dBPs and %deGFR (model 2). But in premenopausal women, association between the lowest %dBMI quartile and lowest %UA was not statistically significant regardless of this further adjustment.
DISCUSSION
Analyzing data of individuals who underwent general heath screening and who were taking no antihyperuricemic medication, we found that correlation between percentage changes in BMI (%dBMI) and in UA (%dUA) was statistically significant in postmenopausal women and in men, but not in premenopausal women.
Stepwise multiple regression analysis showed that %dWC is a significant independent variable for %dUA in men, where UA1, WC1, and %dWC was used as possible independent variables (model 1); however, the relationship lost statistical significance after further adjustment for BMI1 and %dBMI (Table 3). %dWC was not found to be a predictive value for %dUA in premenopausal or postmenopausal women. By contrast, %dBMI was found to be a predictor for %dUA, even after adjustment for WC1, %dWC, %dBPs, and %deGFR in postmenopausal women and men, although it was not significant in premenopausal women. In premenopausal women, %dBMI was not a significant predictive value for %dUA in the model in which age, UA1, BMI1, and %dBMI were used as independent variables; therefore, failure of %dBMI as a predictor for %dUA in premenopausal women may not fully be explained by the multicollinearity between %dWC and %dBMI. These findings collectively indicate that mode of association between change in BMI and change in UA differs between premenopausal and postmenopausal women.
There are several previous studies in which changes in obesity measures have been analyzed in relation to the changes in UA over a certain period of time. For example, Heyden, et al showed that there was a stepwise progression from decreased UA levels associated with maximum weight loss to increased levels with maximum weight gain16. In addition, Rathmann, et al7 analyzed the data of 1249 male and 1362 female subjects aged 17–35 years from the Coronary Artery Risk Development in Young Adults (CARDIA) Study who attended a 10-year followup. They reported that changes in BMI and WC were associated with changes in UA in a statistical model adjusted for age and baseline UA levels7. In contrast, we found that %dBMI was, but %dWC was not, significantly associated with %dUA in multiple linear regression (Table 2, models 2–5). This might be because statistical significance had been weakened after %dWC and %dBMI were simultaneously included into the statistical model; however, %dWC was not significantly associated with %dUA in women even before the adjustment for %dBMI (model 1). From our epidemiological study, we cannot determine what would have caused the different observations between the findings of Rathmann, et al7 and our own. However, considering that circulating insulin levels may have potential to regulate serum UA levels17, the difference might derive from the difference in insulin sensitivity18,19 and/or difference in the effect of obesity on insulin resistance20 among various ethnicities. This possibility should be investigated in future studies. Choe, et al found that mean changes in BMI, but not in WC, were statistically different between subjects who had decreased or had no change in UA and those with increased UA during a 1-year followup in men who underwent health promotion screening9. They also found that changes in serum creatinine levels, but not in systolic or diastolic blood pressure, were significantly different between subjects who had decreased or unchanged UA levels and those with increased UA9 — a finding that is, in one sense, in agreement with our observations.
What would be the possible underlying mechanisms that explain the difference in the mode of association between %dBMI and %dUA between premenopausal and postmenopausal women? It has been reported that certain alterations in UA metabolism may occur after the menopause; menopause leads to an increase in serum UA levels21,22, and this may be in part attributed to decreased estrogen production and subsequent reduction of the fractional excretion of UA23. In addition, a recent study suggested that association between insulin resistance and serum UA levels may be greater in postmenopausal women than premenopausal women24. Whether these phenomena are related to the difference in the mode of association between %dBMI and %dUA of premenopausal and postmenopausal women remains to be investigated.
We previously showed that obesity or overweight was significantly associated with chronic kidney disease14, and that changes in obesity measures may be associated with changes in eGFR and urinary excretion of albumin25. The strength of the current study was that we demonstrate that change in BMI was positively associated with change in UA in postmenopausal women and men independent of change in eGFR. In addition, we show that mode of association between %dBMI and %dUA was different between premenopausal and postmenopausal women, which may have relation with the fact that menopause causes the elevation of serum UA21,22,26. However, controlling BMI is neither unnecessary nor ineffective in keeping the metabolic measures in optimal ranges in "premenopausal" women, because weight gain may result in the reduced insulin sensitivity and aggravation of cardiovascular risk also in premenopausal women27.
Data for visceral fat volume measured by computed tomography were not available in our study. Recent reports showed that subcutaneous fat accumulation is related to impaired urinary UA excretion6, whereas visceral fat accumulation is linked closely to the overproduction of uric acid28, and that serum UA levels are increased both in individuals with subcutaneous fat obesity and in those with visceral fat obesity28. It remains to be determined whether changes of WC will lead to an increase in urinary UA excretion in our population, and whether there is a relationship between %dUA and change in visceral fat volume.
Our study has several potential limitations. First, we had no information on the extent to which modifications of lifestyle and dietary habits affected observed changes in general/abdominal obesity, as no program to reduce weight was conducted by our institute. Second, we did not take into account participants' level of alcohol consumption or number of cigarettes smoked; both may affect serum UA levels29,30. Third, blood samples were taken from individuals in fasting condition, which may have affected their serum creatinine levels, and thus eGFR.
In summary, during a 1-year period, percentage changes in BMI (%dBMI) were associated positively with percentage changes in serum UA levels (%dUA) in postmenopausal women and men, but not in premenopausal women. This relationship was, at least in part, independent of changes in blood pressure and renal function. Weight loss may represent an effective strategy to decrease serum UA levels without use of antihyperuricemic medications, especially in postmenopausal women and men.
Footnotes
-
Supported in part by a grant from Chiyoda Mutual Life Foundation, and by the St. Luke's Grant for the Epidemiological Research, Daiwa Securities Health Foundation, Gerontology Research Grant of Kowa Life Science Foundation, Foundation for Total Health Promotion, Gout Research Foundation of Japan, Kurozumi Medical Foundation, and a Grant-in-Aid from the Ministry of Health, Labour, and Welfare, Japan.
- Accepted for publication September 15, 2009.


