

Abstract
Objective. To investigate the stability over 2 weeks of ultrasonographic assessments of synovial thickness and vascularity in all 10 metacarpophalangeal joints of subjects with rheumatoid arthritis (RA) with a range of disease activities as measured by the validated Disease Activity Score-28 joint score (DAS28-ESR). And in subjects with severe disease activity, to compare the sensitivity of these measurements, acute-phase markers, and vascular endothelial growth factor to change in response to 2 weeks of oral prednisolone (7.5 mg daily).
Methods. A group of 38 subjects with RA were enrolled, 13 (mean DAS28 2.1), 14 (mean DAS28 5.2), and 11 (mean DAS28 5.7) meriting oral corticosteroid treatment. Synovial thickness and vascularity were assessed by ultrasonography at 3 timepoints. Images were ranked by semiquantitative scale. Vascularity was also measured by quantitative determination of the power Doppler area (PDA).
Results. In the whole RA cohort, baseline indices of synovial thickness and vascularity correlated with DAS28, as did PDA (r = 0.42, p < 0.05). In the RA groups on stable therapy, synovial thickness and vascularity showed little variation over 2 weeks. In the corticosteroid group, PDA had fold changes of −1.9-fold (p < 0.05) after 1 week and −2.2-fold (p < 0.05) after 2 weeks. These were the largest fold changes of all measured variables.
Conclusion. Ultrasonographic measures can differentiate disease severity in RA correlating closely with DAS28. Quantitative power Doppler signal was significantly reduced within 1 week of oral prednisolone, a rapid kinetic suggesting that PDA may have value as a sensitive early marker of therapeutic response.
- RHEUMATOID ARTHRITIS
- POWER DOPPLER ULTRASOUND
- CORTICOSTEROID
- GREY-SCALE ULTRASOUND
- METACARPOPHALANGEAL JOINTS
It is a general belief that persisting inflammatory synovitis correlates with joint damage. Synovium that is adherent to cartilage and locally invasive is termed pannus, and its development precedes destruction of cartilage and bone and is thus a key event in the pathogenesis of rheumatoid arthritis (RA)1. Pannus in the active phase of erosive disease is vascular2,3. Therefore imaging of this pathological structure may be of considerable value in RA.
The small joints of the hands are almost invariably involved in RA and so their evaluation is of considerable importance. Due to their relatively shallow depth they are easily amenable to evaluation with ultrasound utilizing higher frequencies that produce high resolution images. High-frequency (grey-scale) ultrasonography (HFUS) can reproducibly delineate synovial thickening in small joints of the hands in patients with active RA, but the analysis of such images does not necessarily demonstrate a clear relationship with clinical assessments of disease activity4. This observation probably reflects that HFUS identifies synovial thickening without differentiating actively inflamed or fibrous tissue.
Power Doppler (PD) ultrasonography encodes the amplitude of the power spectral density of the Doppler signal and is a sensitive method for demonstrating the presence of blood flow in small vessels. PD signal is actually a measure of the density of moving reflectors at a particular level, and thus of the fractional vascular volume5,6. PD is insensitive to flow in submillimeter vessels and is thus only an indirect surrogate for measurement of capillary flow.
Power Doppler ultrasound (PDUS) enables visualization of synovial hyperemia in the inflamed RA joint7,8. Magnetic resonance imaging (MRI) rates of early synovial enhancement after injection of gadolinium have been shown to correlate closely with the histological grade of synovitis9,10. In turn, the synovial vascular signal on PD is closely correlated with the rates of early synovial enhancement, calculated from dynamic contrast enhanced MRI on the same day, in RA metacarpophalangeal (MCP) joints11,12. PDUS signal intensity in rheumatoid knee joints has been compared directly with histological assessment of synovial membrane microvascular density13 and it correlated well. So there is considerable value in visualizing MCP joints of patients with RA using PDUS as a quick, noninvasive, and relatively inexpensive alternative to contrast enhanced MRI.
High frequency and PD ultrasonography in combination are sensitive and reproducible tools for determining joint effusions and synovitis and have been shown to be more sensitive than clinical scoring in determining disease activity14,15.
A number of recent clinical studies have explored the potential for HFUS and PD technology to measure synovial thickening and vascularity and thereby deliver a reliable synovitis signal early during the course of therapy that correlates with clinical outcome16,17,18,19,20.
We sought to determine the utility of HFUS and PDUS in subjects with a wider range of disease activity and severity. We also evaluated the stability of signal over a 2-week period. Moreover, we determined the kinetics of change of both measurements following the addition of a low dose of oral prednisolone to the patient’s standard therapy in a group of subjects with active disease over a shorter time period than in the previous studies (2 weeks).
MATERIALS AND METHODS
Patients
Thirty-eight adults with RA diagnosed according to the revised 1987 criteria of the American College of Rheumatology (ACR)21 were recruited into this pilot study. Stable doses of disease modifying antirheumatic drugs (DMARD) for 8 weeks prior to enrolment and stable doses of nonsteroidal antiinflammatory drugs (NSAID) for 4 weeks prior to enrolment were required. Subjects were excluded from recruitment if there was a previous or current treatment with tumor necrosis factor (TNF)-blocking agents. In addition, 12 subjects diagnosed with osteoarthritis (OA) according to the ACR diagnostic criteria22 were also enrolled as a control group; stable dose of NSAID for 4 weeks prior to enrolment was required.
Disease activity of the RA subjects was assessed by author KD at baseline using the 28-joint count Disease Activity Score (DAS28), the components of which evaluate various aspects of local and systemic inflammation such as the numbers of tender and swollen joints out of a discrete set evaluated, a measure of acute-phase response, and the subjects’ own global assessment of their condition scored on a visual analog scale. RA subjects were assigned to 3 different cohorts according to their baseline DAS28 scores and their requirement for corticosteroid treatment as follows: low/remission RA (DAS28 < 3.2) and no requirement for corticosteroid treatment (n = 13); high/moderate activity (DAS28 ≥ 3.2) and no requirement for corticosteroid treatment (n = 14); and subjects meriting initiation or an increase in corticosteroid treatment (7.5 mg oral prednisolone daily) with any disease activity (n = 11). Subjects meriting initiation or an increase in corticosteroid treatment were defined by subjects who, if not participating in the study, would have received corticosteroid as an interim measure while awaiting the benefit of an increase or change in DMARD in the clinic setting.
All participants gave informed written consent to participate in the study. The study design was performed according to the Declaration of Helsinki and approved by the institutional review board for human research.
Ultrasonographic imaging
An Esaote Technos Plus MPX ultrasound machine with a 13 MHz transducer (LA424 14–8) was used; subjects had an ultrasonographic assessment of all 10 MCP joints in the transverse plane over the dorsal surface at Day 1 (baseline), Day 8, and Day 15. To obtain the transverse plane image, the probe is first aligned in the longitudinal axis so that it is bisecting the joint. The probe is adjusted to place the maximum height of the dorsal triangular structure (an inverted triangular area whose margins are the metacarpal head, the phalangeal base, and the joint capsule superiorly) in the center of the screen image. At this point the probe is rotated by 90° to achieve the transverse view. Scanning was performed in one room in which temperatures were maintained at a near constant level all year (20°C), with a delay of at least 10 minutes if subjects arrived from outside. This procedure was followed to avoid confounding effects from differences in ambient temperatures. Care was taken when scanning to avoid undue pressure with the probe in case this altered blood flow in the joint. This was achieved by maintaining a distance of at least 1 mm of gel between the probe and the subject as visualized on the US monitor. The time of day of the measurements at each visit was within 1 hour of the time of the baseline visit. The same sonographer (ML) scanned the joints of each patient at all visits to ensure consistency. ML was not blinded to the allocation of patients to their respective groups.
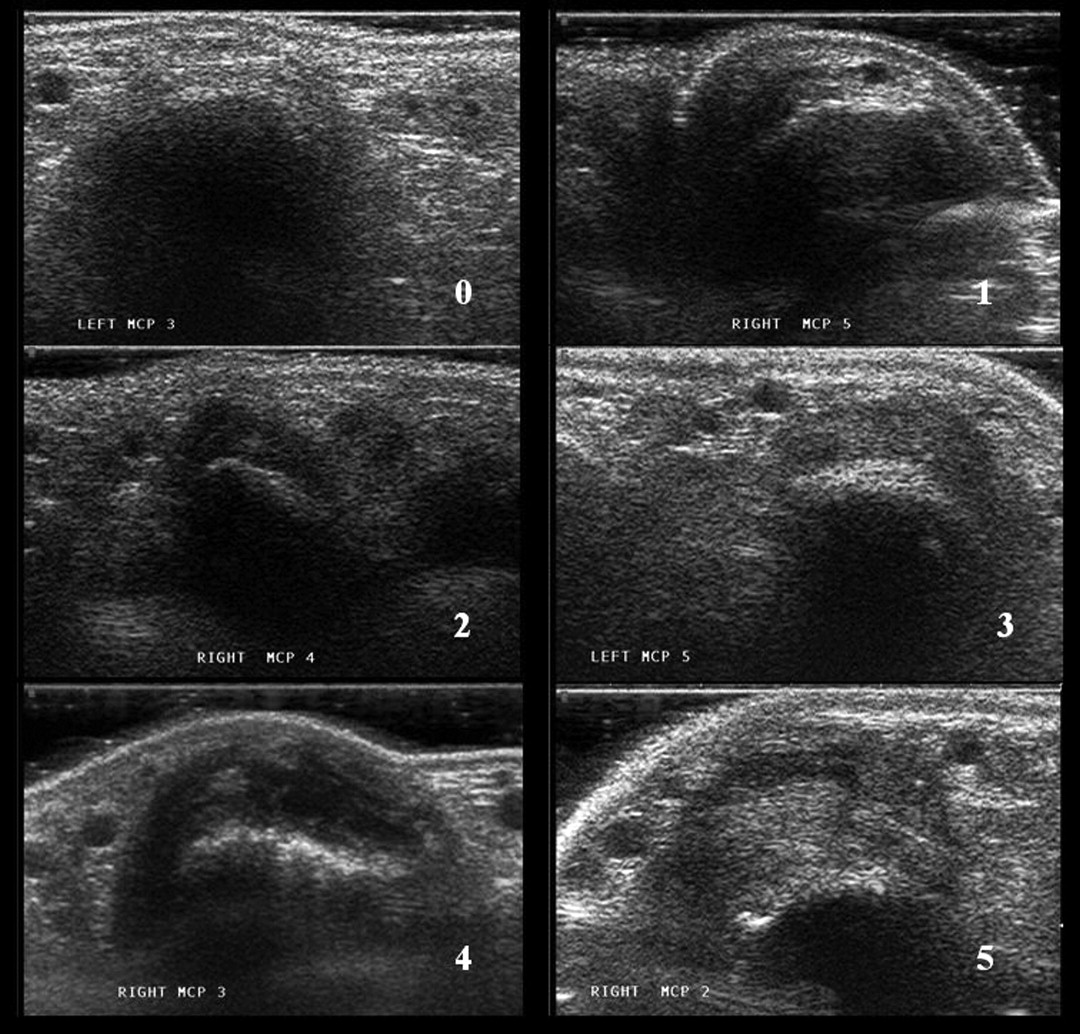
HFUS images were recorded for synovial thickness in the transverse plane for analysis. After all subjects had completed their study visits, the stored images were anonymized and then read by 3 investigators (ML, Rheumatology Research Fellow; AL, Consultant Radiologist; and PT, Consultant Rheumatologist) and together assigned a score of 0–5 by consensus. The 0–5 scale was a semiquantitative scale of synovial thickness relating to hypoechoic areas, as follows: grade 0, normal; grade 1, minimal; grade 2, mild ; grade 3, moderate; grade 4, marked; and grade 5 maximal (Figure 1). The total synovial thickness score (index) was calculated as the sum of individual joint scores (with a minimum score of 0 and a maximum of 50).

Semiquantitative ultrasound scale of synovial thickness (0–5) relating to hypoechoic areas: grade 0, normal; grade 1, minimal; grade 2, mild; grade 3, moderate; grade 4, marked; grade 5, maximal.
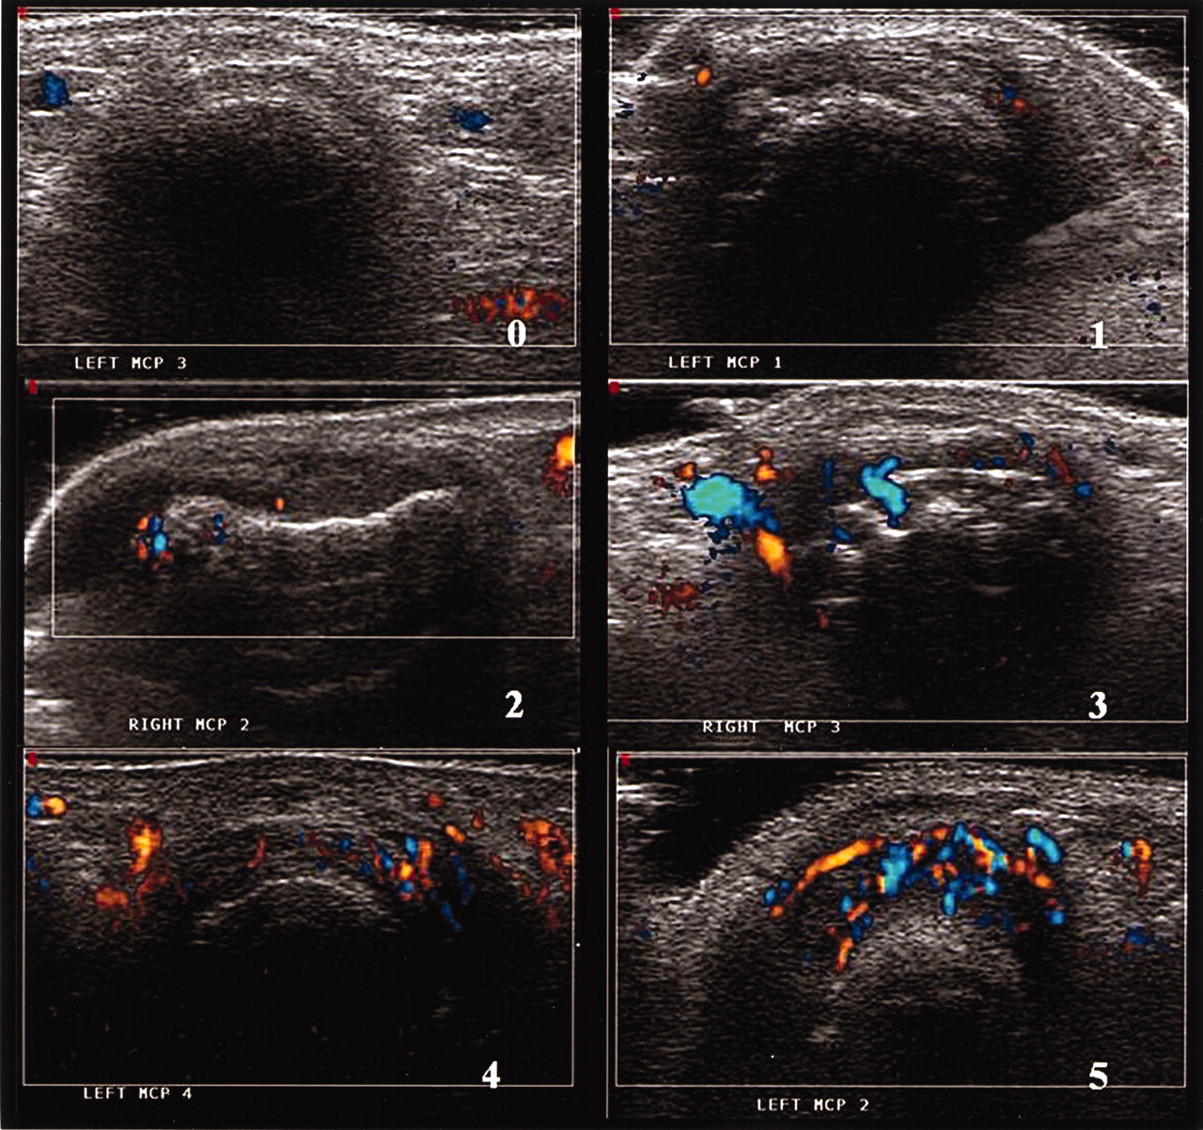
All MCP joints were also scanned in the transverse plane in the power Doppler mode (13 MHz) with a fixed PRF of 750 Hz, gain of 133, and medium wall filter. A 3-second digital film clip was recorded for each MCP joint because the power Doppler signal fluctuates with the cardiac cycle and the aim was to evaluate the maximum signal. After all subjects had completed their study visits, anonymized clips were read by 3 investigators (ML, AL, and PT) and images showing maximal synovial vascularity were assigned a score of 0–5 by consensus using the same semiquantitative scale relating to power Doppler signal: grade 0, normal; grade 1, minimal; grade 2, mild; grade 3, moderate; grade 4, marked; grade 5 maximal (Figure 2). The total vascularity score (index) was calculated as the sum of individual joint scores (with a minimum score of 0 and maximum of 50). In addition, the images were analyzed by author ML only, using in-house software written in MATLAB (The Mathworks, Waltham, MA, USA), allowing a rapid automated measurement of the number of color pixels in a region of interest (ROI). The ROI on each transverse power Doppler MCP image enveloped the MCP joint synovium from the upper margin of the joint capsule to the lowest point of the triangular structure, excluding digital vessels and reflection artefacts (Figure 3). This gave a quantitative value referred to as the power Doppler area (PDA). Semiquantitative 4-point scales (0–3) have been published for both synovial hypertrophy and power Doppler15,23,24. However, the aim of the 6-point scale was to explore the potential of improving the sensitivity of these ultrasonographic qualitative outcome measures. The ultrasonographic outcome measures in the transverse view were chosen, as these have previously shown their utility in differentiating 2 groups in a randomized placebo-controlled trial19.

Semiquantitative ultrasound scale of vascularity (0–5) relating to power Doppler signal: grade 0, normal; grade 1, minimal; grade 2, mild; grade 3, moderate; grade 4, marked; grade 5, maximal.

Metacarpophalangeal joint scanned in the transverse plane showing grade 4: marked synovial vascularity. The region of interest is within the red line. D: digital vessels; S: synovial vascularity.
Quantification of systemic inflammatory markers
Blood samples were collected at baseline (Day 1) and after 1 week (Day 8) or 2 weeks (Day 15) for determination of the erythrocyte sedimentation rate (ESR; Westergren method) and levels of serum C-reactive protein (CRP; laboratory Latex test) and vascular endothelial growth factor (VEGF). A commercial multiplex assay (Pierce Searchlight, Woburn, MA, USA) was used to measure serum concentrations of VEGF.
Statistical analysis
Due to the exploratory design of the study, the sample size was based on feasibility. As this was an open study, randomization of subjects was not performed. A repeated measures analysis of variance model was fitted in the corticosteroid group to assess changes of PDA over time, total vascularity score, total thickness score, CRP, ESR, and VEGF. Changes in measured variables are expressed as fold-change from baseline.
All statistical analyses were performed using SAS for UNIX, version 8.2 (SAS Institute, Cary, NC, USA).
RESULTS
Clinical and demographic characteristics of the study subjects are shown in Table 1. Subjects in the steroid group had a mean DAS28 at baseline of 5.7 (range 3.5–7.0), reflecting high disease activity levels. Methotrexate treatment was balanced across the 3 RA cohorts.
Clinical and demographic characteristics and treatment.
Two subjects in the low/remission RA group withdrew during the study period, one due to an adverse event (an exacerbation of a preexisting condition) and the other withdrew voluntarily. One subject in the high/moderate RA group withdrew during the screening period due to an adverse event (noncardiac chest pain). All 11 subjects in the corticosteroid treatment group completed the study. Of the 12 OA subjects, 11 completed the study; one subject withdrew voluntarily.
Synovial thickness
There was more variation in baseline indices of synovial thickness for the RA groups than for the OA group (Table 2). Baseline synovial thickness indices were closely correlated with baseline DAS28 scores (Pearson correlation coefficient r = 0.54, p < 0.001). A constant decrease in the geometric mean synovial thickness total score was observed from Day 1 to Day 15 in the oral corticosteroid group (Figure 4A); however, it did not reach the same level as in the other groups. The observed change in synovial thickness after 15 days of prednisolone treatment was moderate but significant compared to baseline (fold-change = −1.2, p = 0.014; Figure 5). The thickness score was relatively stable over time in all other groups, the score in the OA group being lowest at all visits (Table 2, Figure 4A).
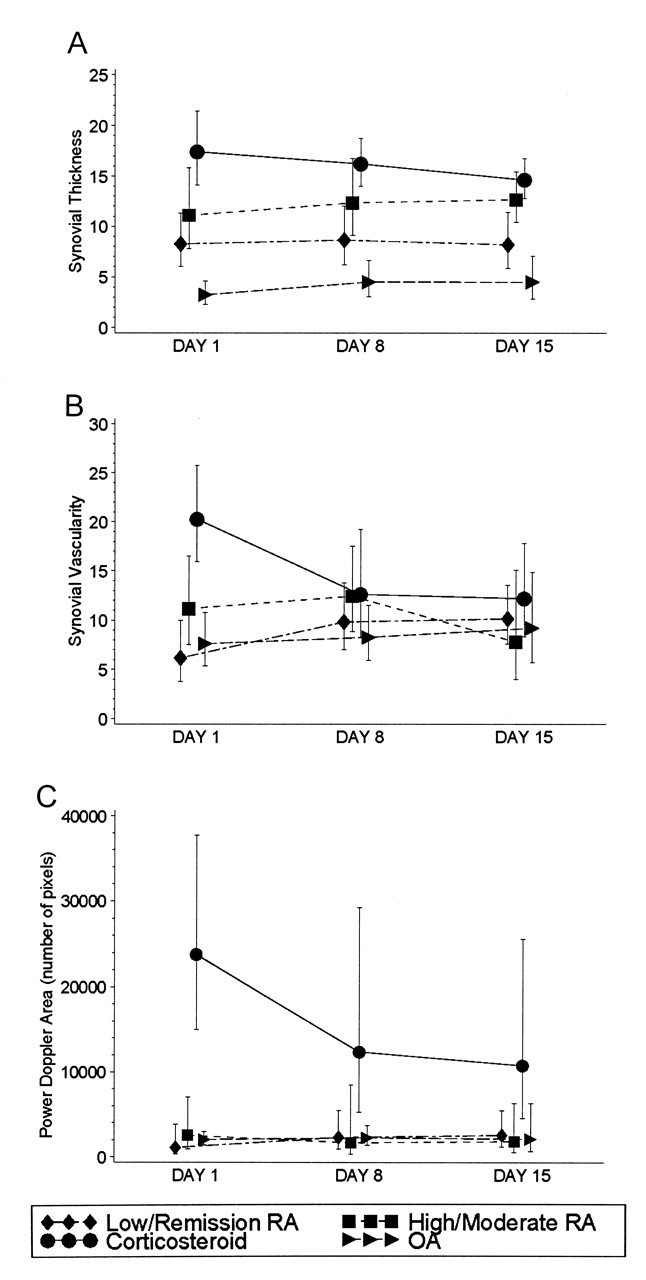
A. Plots of geometric mean high frequency ultrasound synovial thickness (95% CI) at baseline (Day 1), Day 8, and Day 15 by group. B. Plots of geometric mean power Doppler ultrasound synovial vascularity (95% CI) over time by group. C. Plots of geometric mean power Doppler area (95% CI) over time by group.
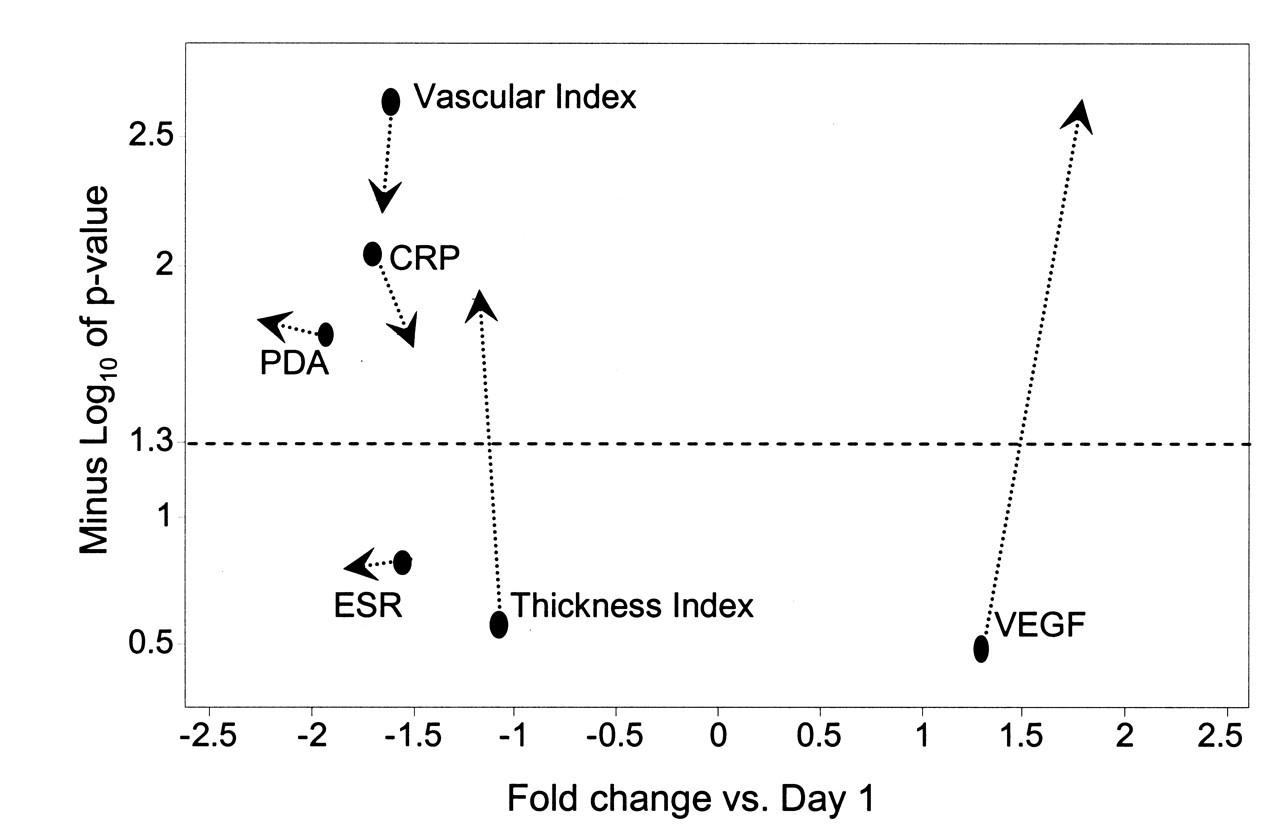
Volcano plot shows fold-change in levels of erythrocyte sedimentation rate (ESR), C-reactive protein (CRP), and synovial vascularity measured as power Doppler area (PDA) or as synovial vascularity index, synovial thickness index, and vascular endothelial growth factor (VEGF) levels after 8 days (circles) and 15 days (arrowheads) of oral prednisolone 7.5 mg daily versus baseline (Day 1). Statistical significance associated to the corresponding fold-changes is given in the y-axis, expressed as minus log10 of the p value. Statistically significant changes (p < 0.05) are located above the broken line indicating value 1.3 in the y-axis. Negative fold-changes indicate a reduction of clinical variables or biomarker levels.
Ultrasound and blood biomarker endpoints. Results are displayed as the geometric mean followed by the range (minimum–maximum) of the endpoints at baseline (Day 1), Day 8, and Day 15.
Synovial vascularity
Baseline synovial vascularity indices (Table 2) were closely correlated with baseline DAS28 scores (r = 0.51, p < 0.01). In the 3 groups who were not treated with additional oral corticosteroid, there were no significant changes over time in synovial vascularity indices; whereas, in the oral corticosteroid group there was a significant (p < 0.01) progressive decrease in the synovial vascularity index throughout the time-course of the study (Table 2, Figure 4B) with fold reductions of 1.6 and 1.7 after 8 and 15 days, respectively (Figure 5).
Power Doppler area
Quantitative assessment of PDA showed significant differences between groups at baseline (Table 2, Figure 4C). In the whole RA cohort of 38 subjects, baseline PDA correlated with DAS28 (r = 0.42, p < 0.05).
A progressive decrease in the PDA geometric mean was observed throughout the time-course of the study in the oral glucocorticoid group, with significant reductions of 1.9 (p =0.019) and 2.2 (p = 0.017) after 8 and 15 days of prednisolone treatment, respectively (Figure 5). These were the largest reductions of all the variables investigated. Surprisingly, the PDA in the OA group was not the lowest level at any of the timepoints (Table 2).
Inflammatory biomarkers
Mean baseline CRP concentrations were higher in the RA groups than in the OA group: low/remission group geometric mean 2.4 mg/l (range 1–23), high/moderate group 5.5 (range 2–20), corticosteroid group 9.6 (range 4–30), and OA group 1.6 (range 1–4; Table 2). In the corticosteroid group, serum CRP levels were significantly reduced (fold-change −1.7, p = 0.009) after 8 days of prednisolone treatment compared to baseline, from 9.6 mg/l (range 4–30) to 5.3 mg/l (range 1–26). Although the mean CRP subsequently rose to 6.4 mg/l (range 2–36) after 15 days of treatment, it remained significantly reduced from baseline (fold-change −1.5, p = 0.019; Table 2, Figure 5). CRP concentrations were relatively stable over time in the other disease activity groups.
There were no clinically significant differences between baseline serum VEGF levels in the different disease activity groups. Levels of this biomarker were not statistically significantly reduced after 1 or 2 weeks with oral prednisolone treatment.
There were no significant correlations between PDA and ESR, CRP, or VEGF at any timepoint in any of the groups, including the corticosteroid group, after the 2-week course of prednisolone.
DISCUSSION
Development of reliable and reproducible biomarkers is fundamental to both clinical assessment and drug development. Ultrasonography with power Doppler is a noninvasive method of determining both synovial thickening and increased vascularity in patients with RA.
Our study describes the stability of signal over time across a range of disease activities in RA and highlights changes in ultrasonographic findings following a 2-week course of low-dose corticosteroids. The results suggest that the use of quantitative power Doppler may be more sensitive than alternative laboratory surrogates of disease activity such as ESR, CRP, and serum VEGF levels.
Several studies have shown the utility of PDUS in determining changes in synovial vascularity following various treatments including intravenous corticosteroid25, intraarticular corticosteroid26,27, and methotrexate with and without infliximab19. However, our study is the first to describe kinetics of change in subjects treated with low-dose oral corticosteroid in contrast to the relatively stable signal in measurements made at the same timepoints in comparator groups of subjects in whom treatment is unchanged.
In our study, subjects with RA with varying disease activity could be differentiated on the basis of grey-scale and PDUS findings. Baseline indices of synovial thickness and vascularity as well as power Doppler area scores were related to DAS28. Further, in the 2 RA groups in whom treatment was not changed, there was stability in signal in terms of the ultrasonographic changes, while in those subjects treated with an additional 7.5 mg oral prednisolone, changes in vascular signal as assessed by both vascularity index and PDA in the MCP joints was significantly reduced in just 1 week, suggesting that the rapid kinetics of change may have value as an early objective marker of therapeutic response.
Serum VEGF levels were not helpful in determining differences between groups of subjects with varying disease activity or response to 2 weeks’ treatment of 7.5 mg prednisolone. This was an unexpected finding, as previous studies have indicated its potential as a marker of disease activity/severity28,29. Further, several studies have outlined inhibition of serum VEGF following treatment with biological agents such as TNF blockers and anti-interleukin 6 receptor antibodies30,31. A recent report described a reduction in VEGF staining in synovial biopsies of patients with inflammatory arthritides following a single intraarticular steroid injection32. Conversely, other investigators described a wide variation in serum VEGF levels and no correlation with disease activity33. We also found that there was a large range in serum VEGF levels in the groups studied (Table 2). Further there was no correlation between serum CRP and PDA, or VEGF and PDA. In our study the time period of 2 weeks may have been too short to observe VEGF reduction under low-dose systemic corticosteroid treatment.
Unsurprisingly, serum CRP levels were able to differentiate between groups of RA subjects with varying disease activity and between RA and OA subjects34. The reduction in CRP in response to corticosteroid was less impressive. There was only a 1.5-fold reduction in CRP after 15 days. PDA was reduced with a 2.2-fold change after 15 days compared to baseline. This was the greatest change of all the variables measured. PDA therefore seems to be a more sensitive tool for determining between-group differences.
This study has the limitations of an open-label design with relatively small numbers in the group in which treatment was changed. It would have been worthwhile to have written a validation protocol into the study to determine the interobserver and intraobserver variability of the ultrasonographic outcome measures. The OA cohort was selected as a comparator group in the expectation at the time the study was formulated that there would be a low or absent vascular signal on power Doppler scanning. However, we were surprised to observe vascular signal in the OA comparator group, an observation subsequently confirmed by others35,36.
PDUS reveals a measure of synovial fractional vascular volume and is highly related to proliferative synovitis, both central features of the pathobiology of RA. This study clearly indicates that PDUS has the potential to serve as a broadly applicable pharmacodynamic marker of synovial inflammation. It may also have the benefit of early identification of individual response to therapeutic change. Further studies will establish whether this technology has utility to better estimate treatment effects and improve dose selection in the early development of novel therapeutics for RA.
Footnotes
-
Supported by a grant from the Imperial College-GlaxoSmithKline ADI award. Imperial College investigators are also grateful for support from the NIHR Biomedical Research Centre funding scheme.
-
Dr. Larché and Dr. Seymour are joint first authors of this report.
- Accepted for publication July 30, 2010.


