

Abstract
Objective. A proteomic approach was applied to discover novel rheumatoid arthritis (RA)-specific proteins by comparing the expression profiles of synovial membranes from patients with RA, osteoarthritis (OA), and ankylosing spondylitis (AS).
Methods. Synovial tissues were collected from patients with RA (n = 10), OA (n = 10), or AS (n = 6), and healthy controls matched for age and sex. Proteins were separated by 2-dimensional polyacrylamide gel electrophoresis, and the proteins with significantly increased expression in the RA samples were subject to matrix-assisted laser adsorption-ionization time-of-flight spectrometry. Results were verified using Western blot and immunohistochemistry. Levels of the candidate proteins were measured within plasma and synovial fluids from the RA patients (n = 30), who had disease duration of 3–7 years, using ELISA. Levels were also measured within plasma from unmedicated RA patients (n = 41), who had disease duration of 1–6 months.
Results. Compared with the OA and AS tissue samples, the proteins Ig-kappa light-chain C region, PRDX4, SOD2, TPI, and TXNDC5 were found with increased expression in synovial tissues of RA patients. PRDX4, SOD2, TPI, and TXNDC5 had 2-fold or more increase in expression in some of the early RA plasma samples (58.55%, 31.7%, 26.8%, and 36.6%, respectively) as compared with the early OA samples and control samples. TXNDC5 had 2-fold or more increase in expression in 53.3% of blood samples and 73.3% of synovial fluid samples from patients with long disease duration of RA as compared with samples from OA and AS patients.
Conclusion. Functional classification indicated that these identified proteins were related with cell differentiation, glycol metabolism, immunoactivation, and endogenous antioxidant reaction.
- RHEUMATOID ARTHRITIS
- Ig-KAPPA LIGHT-CHAIN C REGION
- PRDX4
- SUPEROXIDE DISMUTASE-2
- TRIOSEPHOSPHATE ISOMERASE
- TXNDC5
- ANTIOXIDANT
- GLYCOL METABOLISM
Rheumatoid arthritis (RA), which affects 1% of the world population, is a systemic autoimmune disease characterized by chronic inflammation of the synovial joints, ultimately leading to joint cartilage destruction and permanent disability. This inflammatory disorder is initiated by self-attack from one’s own immune system, but the details of the pathological mechanism are unclear. Recently, genomic and proteomic technologies have dramatically extended our ability to investigate the pathogenic process of RA1,2. A series of reports compared “fingerprint” profiles of both disease and control states using a proteomic approach and found some RA-specific proteins including S100A9/A8, serum amyloid A, galectin, and ubiquitin-proteasome pathway components3–13. However, most of these studies were performed with peripheral blood, synovial fluid (SF), or cultured synovial cells from patients with RA. Few studies focused on the expression profile of the whole RA synovial tissue that contained many types of synoviocytes, despite the fact that most of these cell types contribute to the inflammatory joint disorders in RA14. In addition, these studies generally used tissues of patients with osteoarthritis (OA) and healthy patients as controls. Although both OA and RA are characterized by focal loss of cartilage due to upregulation of the catabolic pathways induced by proinflammatory cytokines, OA generally induces less inflammation than RA. Hence, comparative proteomic studies often detect elevated expression of inflammation-related proteins. Ankylosing spondylitis (AS), a form of chronic inflammation of spinal and sacroiliac joints, sometimes has symptoms similar to RA and was clinically classified as RA many years ago15.
We performed a proteomic analysis of RA synovial membranes and compared the results with the expression profiles of AS and OA synovial membranes. The proteins extracted from the synovial samples were separated by 2-dimensional polyacrylamide gel electrophoresis (2-DE), and the proteins with increased expression were then identified by mass spectrometry. The result was verified with Western blot analysis and immunohistochemistry. Levels of the candidate proteins were also investigated within the blood and SF of patients with RA. The purpose of our study was to find novel RA-specific proteins to further understand the pathogenic mechanism of RA.
MATERIALS AND METHODS
Patients and sample collection
Synovial tissue samples were collected during knee joint replacement surgery from patients with RA (n = 10, 7 female; 23–68 yrs old, mean 49 yrs), OA (n = 10, 6 female; 43–71 yrs old, mean 53 yrs), and AS (n = 6, 2 female; 14–48 yrs old, mean 35 yrs). The diagnosis of RA fulfilled American College of Rheumatology criteria16. The patients with RA had disease durations of 3–10 years and were classified as having erosive RA (Larsen class IV–V). They had high levels of C-reactive protein (CRP; 30–100 mg/l, mean 24 mg/l), anti-cyclic citrullinated peptide antibody (300–3000 U/ml), and rheumatoid factor (160–2560 U/ml). The patients with RA and AS took disease-modifying antirheumatic drugs (DMARD) before surgery. The patients with RA, OA, and AS were also medicated with nonsteroidal antiinflammatory drugs (NSAID), which reduce pain and swelling of joints and decrease stiffness.
The synovial samples were dissected from connective tissues and immediately stored at −80°C until use.
All patients were provided with informed consent and the study protocol was approved by the local institutional ethics committee.
2-DE and protein spot collection
Synovial tissue samples were homogenized in lysis buffer (urea 7 M, thiourea 2 M, CHAPS 4%, IPG buffer 2%, DTT 65 mM, PMSF 1 mM) along with Protease Inhibitor Cocktail (Sigma) on ice and then centrifuged at 14,000 g for 30 min. Protein concentrations were determined using the BCA protein assay kit (Pierce Chemical, Rockford, IL, USA). The cell lysates of RA, OA, and AS synovial tissues were pooled with equal protein contents, respectively. The sample pool was stored at −80°C until use.
Isoelectic focusing (IEF) was performed using Ettan IPGphor II (GE Healthcare, USA) with 24-cm length Immobiline Drystrips (NL, pH 3–10; GE Healthcare). After rehydration, 300 μg of protein were rehydrated with an appropriate quantity of rehydration buffer (7 M urea, 2 M thiourea, 4% CHAPS, 0.5% IPG buffer pH 3–10, with 0.001% bromophenol blue). IEF voltage was applied according to the following protocol: 30 V for 12 h, 150 V for 2 h, 3000 V for 30 min, 5000 V for 30 min, linear ramping to 8000 V over 1 h, and then run at 8000 V until 65,000 V-h was reached. Prior to 2-dimension separation, strips were equilibrated in 2 successive buffers [6 M urea, 2% sodium dodecyl sulfate (SDS), 50 mM Tris-HCl (pH 8.8), 30% glycerol, and a trace of bromophenol blue]. The first buffer contained 1% w/v DL-dithiothreitol, and the second contained 2.5% w/v iodoacetamide. Each equilibration was conducted for 15 min with continuous agitation. Strips were then rinsed in electrophoresis buffer (25 mM Tris base, 192 mM glycine, 0.1% w/v SDS), applied to 12.5% acrylamide gels (260 mm × 200 mm), and sealed with melted agarose (0.5% w/v agarose in electrophoresis buffer containing a trace of bromophenol blue). Electrophoresis was carried out using an EttanDalt 12 apparatus (GE Healthcare) with initial separation at a constant 0.2 W per gel for 1 h and followed by 17 W per gel until the dye front had migrated to the bottom at 25°C. The total run time was about 6 h.
After electrophoresis, proteins were visualized by staining with Coomassie Brilliant Blue R350 s solution overnight. The 2-DE gels were scanned with a UMAX Powerlook 2100XL (UMAX Technologies, Dallas, TX, USA). Digitized images were analyzed with ImageMaster 2D Platinum software v 5.0 (GE Healthcare). The 2-DE gels loaded with RA samples were compared to the gels run in parallel but loaded with OA and AS samples. To compensate for non-expression-related variation in spot intensity, the volumes for each spot in a gel were normalized by the total volume of all spots, and spot intensities were expressed as the percentage of the total sum of spot volumes. Image analysis was performed by comparing the quantity of matched spots in the experimental gels versus control gels. Significant variation was defined as more than a 3-fold change in spot density, and only those spots that had statistically significant (p < 0.01) expression levels were selected for further mass spectrometry identification. This experiment was repeated 3 times.
The differentially expressed spots were excised manually from the stained gels, washed in MilliQ water, destained in 50 mM ammonium bicarbonate/50% acetonitrile (ACN) buffer, dehydrated in 100% ACN for 15 min, and then completely dried by vacuum centrifugation. The dried pieces were suspended in trypsinization buffer (10 ng/μl trypsin, 25 mM NH4HCO3, pH 8.0) for 30 min at 4°C and incubated overnight in 10 ml 25 mM NH4HCO3 at 37°C. Finally, peptides were extracted with 5% trifluoroacetic acid (TFA)/50%ACN (v/v) and the extraction was lyophilized and redissolved in 0.1% TFA/30% ACN (v/v).
Matrix-assisted laser desorption/ionization time of flight/time of flight mass spectrometry (MALDI-TOF/TOF MS) analysis and protein identification
0.5 μl of peptide samples were mixed with equal volume of 5 mg/ml α-cyano-4-hydroxycinamic acid matrix (α-CHCA) in 0.1%TFA/50%ACN and spotted onto a standard 192-well plate (ABI, Sunnyvale, CA, USA). Six external standards (mass standard kit for the 4700 proteomics analyzer calibration mixture; ABI) were used to calibrate each spectrum to a mass accuracy within 50 ppm. Mass spectrometry analysis was performed using the ABI 4700 Proteomics Analyzer MALDI-TOF/TOF mass spectrometer in a batch-mode acquisition method. The spectra data were analyzed with the International Protein Index Human Database v 3.10 (57,478 sequences; 25,254,519 residues) using GPS Explorer software v 3.0 and MASCOT 2.0 software (Matrix Science, London, UK).
Western blot analysis
Total protein from synovial tissues of RA, OA, and AS samples was prepared as described above. Five micrograms of total protein were loaded and separated by sodium dodecyl sulfate–polyacrylamide gel electrophoresis (SDS-PAGE), transblotted onto nylon membranes and probed with the antibody against various candidate antigens. Antibodies were from Abcam (Cambridge, MA, USA). A Western blotting kit (KPL, Gaithersburg, MD, USA) was used to detect immuno-signals according to the manufacturer’s instructions.
Immunohistochemistry
RA, OA, and AS synovial tissues were collected as described. Samples were fixed in 10% neutral buffered formalin for 12 h at room temperature, embedded in paraffin, and sectioned by standard procedures. Tissue sections were deparaffinized and rehydrated using standard procedures. To increase immunostaining intensity, the sections were heated at 95°C for 10 min in citrate buffer (0.01 M, pH 6). Sections were incubated with the primary antibody overnight at 4°C. After incubation, tissue sections were washed 3 times for 3 min in PBS, and then processed with the UltraSensitive S-P kit (Maixin-Bio, Fuzhou, China) according to the manufacturer’s instructions. Immunoreactive signals were visualized using DAB substrate that stained the target protein with a yellow color. Tissue structure of the section was defined by counterstaining with hematoxylin. The intensity of immuno-signals was evaluated as described17. For each histological section, the percentage of positive cells was scored as 0 (0%), 1 (10%), 2 (10%–50%), 3 (51%–80%), and 4 (> 80%), and staining intensity was scored as 0 (negative), 1 (weak), 2 (moderate), and 3 (strong). The immunoreactive score (IRS) was obtained by multiplying the percentage of positive cells and the staining intensity. Immunohistochemical results with an IRS of 0–1 were considered negative, 2–4 weak, and 6–12 positive.
ELISA
SF were aspirated from joints of patients with RA (n = 30), OA (n = 30) and AS (n = 30), centrifuged at 3000 g for 10 min at 4°C, and stored at −80°C until use. Blood was collected from patients with RA (n = 30), OA (n = 30), and AS (n = 30) into Monovette tubes containing 3.8% sodium citrate. After centrifugation at 1000 g for 30 min, the supernatant of anticoagulated plasma was collected and stored at −80°C until use. Patients with RA had disease duration of 3–7 years and patients with OA or AS had disease duration of 3–5 years. The medical treatment for these patients was as described above. Blood samples and fluid samples were diluted 20-fold and 100-fold with 0.05 M carbonate–bicarbonate buffer (pH 9.6), respectively, and coated onto 96-well ELISA microplates (Costar, Cambridge, MA, USA) by overnight incubation at 4°C. After a brief wash with PBS containing 0.1% Tween 20 (PBST), the plate was blocked with 5% nonfat dry milk for 1 h at room temperature. The first antibodies obtained from Abcam were diluted 1000-fold with PBST and added to the plate, then incubated for 2 h at room temperature. After washing with PBST, the plate was incubated with a 15,000-fold dilution of anti-rabbit IgG alkaline phosphatase conjugate antibody (Sigma) for 30 min at room temperature. Following a wash with PBST, the signal was developed by adding alkaline phosphatase yellow (pNPP) liquid substrate system for ELISA (Sigma). Absorbance of the reaction was measured at 405 nm with a plate reader (Synergy HT, Bio-Tek).
To observe expression of the candidate genes with the effects of medication, plasma was collected from 97 patients who had arthritis of one or multiple joints for 1–6 months when they visited clinics for the first time. After 1–2 years of followup, the 41 patients with undifferentiated arthritis (UA) were finally diagnosed with RA (35 female, age 32–63 yrs, mean 41 yrs), and the other 55 patients with OA (27 female, age 45–69 yrs, mean 54 yrs); 90 blood samples were selected from the healthy controls, who were matched for sex and age to the experimental group.
RESULTS
In our study, comparative 2-DE polyacrylamide gel electrophoresis was used to differentiate protein expression levels in synovial membranes from RA and OA patients, and from RA and AS patients on a global level. The 2-DE gel patterns of the experiment were highly reproducible over 3 repeats. Following analysis, approximately 300 spots were visualized on each 2-DE gel. A 2-DE gel prepared with RA samples is shown in Figure 1. Compared to the OA and AS sample gels, spots that had a ≥ 3-fold increase in expression in the RA sample were selected for mass spectrometric identification. Among these, 4 spots (17, 21, 22, and 25 in Figure 1) showed a 3- to 5-fold higher expression in the RA sample than in the OA and AS controls. The other 6 spots (2, 10, 33, 48, 50, 74, Figure 2) in the RA gel showed a 3-fold increase compared to the gels prepared with OA and AS controls. Using MALDI-TOF MS, these protein spots were identified as actin cytoplasmic 2, Ig-kappa chain C region, ferritin light chain, peroxiredoxin 4 (PRDX4), retinal dehydrogenase 1 (ALDH1A1), sec1 family domain-containing protein 1 (SCFD1), superoxide dismutase [Mn] mitochondrial (SOD2), thioredoxin-dependent peroxide reductase mitochondrial precursor (PRDX3), triosephosphate isomerase (TPI), and thioredoxin domain-containing protein 5 (TXNDC5). Detailed information about these identified proteins is shown in Table 1.
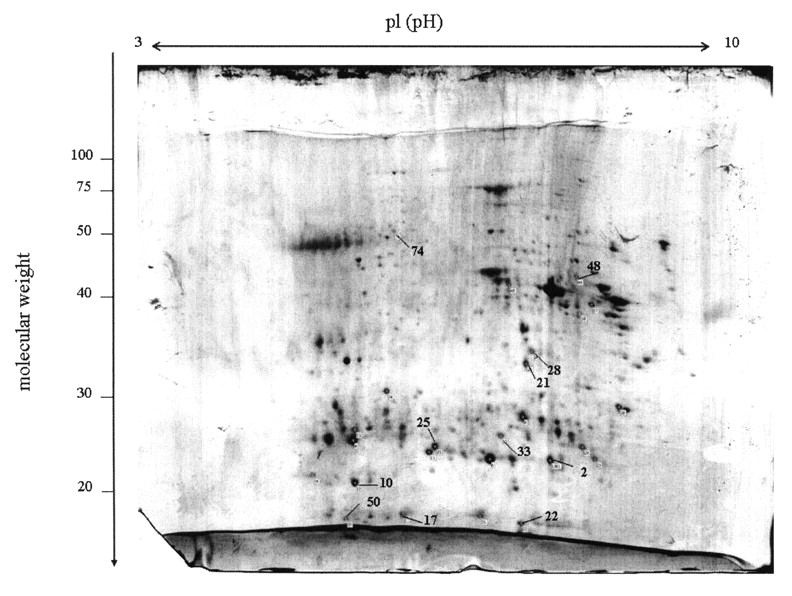
Two-dimensional polyacrylamide gel electrophoresis of the total proteins extracted from RA synovial tissues. Protein was visualized by staining with colloidal Coomassie Blue. Protein spots indicated by numbers were identified by MALDI-TOF MS.

Comparison of RA (column 1), OA (2), and AS (3) synovial proteins indicated by numbers in Figure 1. Total proteins extracted from RA, OA, and AS synovial tissues were separated by 2-DE. Protein spots from RA synovial tissue had 3- to 5-fold higher levels than the matched spots for OA and AS synovium (p < 0.05).
Identification of spots with significant overexpression in RA synovial membrane by proteome analysis.
Western blot analysis was performed with the antibodies against these candidate proteins, including ALDH1A1, Ig-kappa chain C region, PRDX3, PRDX4, SOD2, TPI, and TXNDC5. With GADPH as a reference, Ig-kappa chain C region, PRDX4, SOD2, TPI, and TXNDC5 showed significantly higher levels in RA synovial membranes than in the OA and AS samples (Figure 3). The result was observed in all synovial membranes tested. Because antibodies against actin cytoplasmic 2, ferritin light chain, and SCFD1 were not commercially available and were being prepared by ourselves, the analysis for these 3 candidate proteins will be performed later.
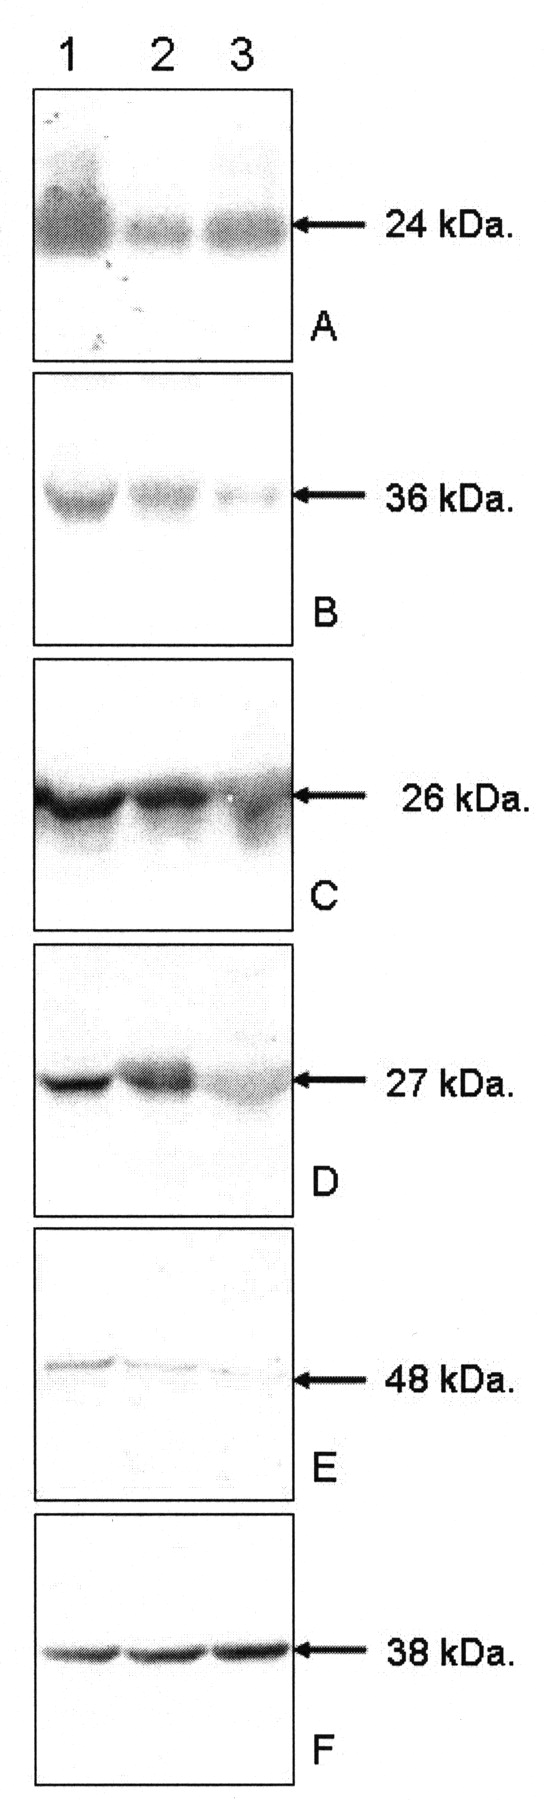
Western blot analysis of the proteins overexpressed in RA synovial membrane detected by proteomic analysis. Ig-kappa chain C region (panel A), PRDX4 (B), SOD2 (C), TPI (D), and TXNDC5 (E) had significantly higher expression in RA synovial tissue (column 1) than in OA (2) and AS (3) synovial tissues. Loading of samples was normalized using GADPH (E). Molecular weight is indicated with arrows.
Immunohistochemistry analysis located expression of Ig-kappa chain C region, PRDX4, SOD2, TPI, and TXNDC5 in all RA synovial tissues. Ig-kappa chain C region had significant expression in the thick lining layer and T cells of RA synovial membranes (immunoreactive score: 6–9) and the thin lining layer of AS synovial membranes (IRS: 2–3), but was a smear in OA synovial membranes (IRS: 1–2). PRDX4 had significant expression in the thick lining layer and T cells of RA synovial membranes (IRS: 6–9) and thin lining layer of OA (IRS: 1–3) and AS synovial membranes (IRS: 3–4). SOD2 had significant expression in thick lining layer of RA synovial membranes (IRS: 9–12) and thin upper layer of AS synovial membranes (IRS: 3–6), but was negative in OA synovial membrane (IRS: 0–1). TPI had significant expression in thick lining layer, T cells, and clustered B cells of synovial membranes from RA (IRS: 9–12) and thin lining layer of AS synovial membranes (IRS: 2–4), but was negative in OA synovial membrane (IRS: 0–1). TXNCD5 had significant expression in thick lining layer and T cells of RA synovial membranes (IRS: 9–12) and thin lining layer of AS synovial membrane (IRS: 3–4), but was negative in OA synovial membranes (IRS: 0–1). The result was observable in all synovial membranes we tested. Tissue distribution of these proteins is shown in Figure 4.
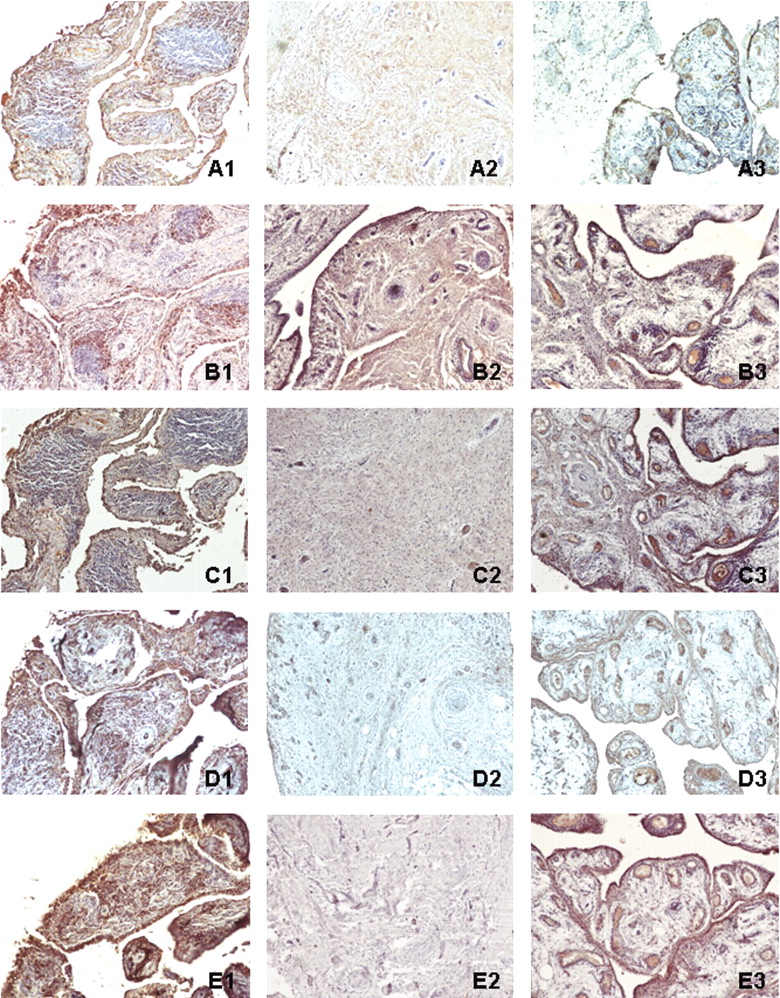
Immunohistochemistry of Ig-kappa chain C region (A), PRDX4 (B), SOD2 (C), TPI (D), and TXNDC5 (E) in synovial membranes of RA (1), OA (2) and AS (3). Ig-kappa chain C region, PRDX4, SOD2, TPI, and TXNDC5 had significantly higher expression in RA synovial tissue than OA and AS synovial tissues. Original magnification 100×.
In Western blot analysis and immunohistochemistry ALDH1A1 and PRDX3 showed no significant expression in synovial tissues.
ELISA was used to measure the levels of Ig-kappa chain C region, PRDX4, SOD2, TPI, and TXNDC5 in SF and plasma samples from patients with RA, OA, and AS at the chronic inflammation stage. Levels of Ig-kappa chain C region, PRDX4, SOD2, and TXNDC5 were significantly higher in RA fluids than in OA samples (p > 0.01), and the level of TXNDC5 was significantly higher in RA fluids than in AS samples (p > 0.01). TXNDC5 was also found to have significantly higher levels in RA plasma than in OA and AS samples (p > 0.01). Compared with average levels of the OA and AS samples, TXNDC5 had a ≥ 2-fold increase in expression in over half of the blood samples (16/30) and fluid samples (22/30) from RA patients with long disease duration. The levels of Ig-kappa chain C region, PRDX4, SOD2, and TPI were not significantly different among RA, OA, and AS blood samples at this stage. In blood samples from patients who had had arthritis of one or multiple joints for 1–6 months, PRDX4, SOD2, TPI, and TXNDC5 had ≥ 2-fold increases in expression in some of the early RA blood samples (15/41, 11/41, 13/41, and 24/41, respectively) as compared with average levels from the early OA and healthy control samples. Levels of Ig-kappa chain C region, PRDX4, SOD2, TPI, and TXNDC5 were not significantly different in the early OA and control samples. Measurements of blood and fluid samples are shown in Figure 5.

Scatter plots show levels of Ig-kappa chain C region (A), PRDX4 (B), SOD2 (C), TPI (D), and TXNDC5 (E) in synovial fluids (column 1); in plasma from patients with RA, OA, and AS of long duration (column 2); and in plasma from patients with very early stage RA and OA (column 3). Levels are indicated by optical density values of absorbance at 405 nm. Results are expressed as mean ± SEM. PRDX4, SOD2, TPI, and TXNDC5 had increased expression in early RA samples compared with samples from early OA and healthy controls. TXNDC5 had increased expression in blood and fluid samples from patients with long duration RA as compared with samples from patients with OA and AS.
DISCUSSION
We screened upregulated proteins in synovial membrane samples of patients with RA by comparing protein “fingerprints” of RA, OA, and AS tissue samples. We found that some novel proteins had significant overexpression in RA synovial tissues, and others were not observed in samples of patients’ peripheral blood, SF, or isolated synovial cells. Western blot analysis and immunohistochemistry confirmed the high levels of Ig-kappa chain C region, PRDX4, SOD2, TPI, and TXNDC5 and located them in synovial membranes of patients with RA. We also found some RA-related proteins such as vimentin, fibrinogen, MRP-8, CRP, and tubulin that had been reported by proteomic studies from others, when we compared the expression profiles of RA to OA and AS. However, when we compared data from the 3 diseases, it was found that increased expression of these proteins was not unique to RA. Some inflammation-related proteins identified by comparing expression profiles of RA to OA also had high expression in AS samples, and some cartilage metabolism-related proteins identified by comparing expression patterns in RA to those in AS also had high expression in OA. Thus, our results comparing expression profiles of 3 arthritic diseases could provide reliable and effective data to determine protein biomarkers specifically for RA.
TPI is an isomerizing enzyme catalyzing the reversible interconversion of d-glyceraldehyde 3-phosphate to dihydroxyacetone phosphate, an important reaction in glycolysis and gluconeogenesis. A deficiency of TPI in humans causes congenital nonspherocytic hemolytic anemia and severe neurological deficits18. Although there has been no report about involvement of TPI in the pathogenesis of RA, disturbance of glycol metabolism was confirmed to induce severe symmetrical peripheral polyarthritis19. We detected high concentrations of TPI in RA synovial tissues. Xiang, et al detected IgG-type anti-TPI autoantibodies in 6% of RA serum and SF samples19. Thus, it is possible that overexpressed TPI contributes to RA by disrupting the glycol metabolism of the synovium.
Using a combination of 2-DE and mass spectrometry, Wang, et al found that TXNDC5 was significantly upregulated in colorectal adenoma and cancer tissues20. Wei, et al also found that TXNDC5 expression was elevated in prostate cancer by reviewing the profiles of 26 prostate cancer samples21. Other evidence indicates that RA synovial membranes have many features in common with tumor tissues, including abnormal cell proliferation, extensive fibrin deposition, high coagulation activity, and extreme angiogenesis22,23. Hence, the increased expression of TXNDC5 in synovial membrane, blood, and SF of patients with RA suggests similarities between RA pathogenesis and carcinogenesis.
Living cells maintain a delicate balance between oxidizing and reducing species. Oxidative stress with increased production of reactive oxygen species (ROS) in rheumatoid inflammation, due to insufficiency of antioxidant defense systems and the acceleration of oxidative reactions, has an essential role in the etiology of RA24–26.Within RA synovial membranes, we detected upregulation of antioxidant enzymes including PRDX4 and SOD2. Peroxiredoxins are a family of multifunctional antioxidant thioredoxin-dependent peroxidases that protect cells against oxidative stress and regulate cell proliferation by modulating intracellular signaling cascades with hydrogen peroxide as a second messenger molecule27. Superoxide dismutases (SOD), including copper, zinc, and Mn SOD (SOD2), convert superoxide to hydrogen peroxide that is then removed by glutathione peroxidase or catalase. Thus, SOD can prevent the formation of highly aggressive ROS such as peroxynitrite or the hydroxyl radical. In addition, TXNDC5 contains a thioredoxin domain. Thioredoxin is an antioxidant protein and protects cells from oxidative stress28. The high levels of antioxidant factors including PRDX4 and SOD2 as well as TXNDC5 in RA synovial tissues seem contrary to the high oxidative activity detected by others26. Much evidence reveals that oxidative stress can trigger a cellular stress response characterized by induction of antioxidants29. It is possible that, with the progression of RA, the accelerated oxidative stress stimulated endogenous antioxidant proteins to protect tissue from oxidative stress. Some studies correspond to our findings about upregulation of antioxidative factors in RA synovial tissues. Karasawa, et al detected autoantibodies to recombinant PRDX1 and PRDX4 by ELISA and Western blotting, and found that 19% and 17% patients with RA possessed autoantibodies to PRDX1 and PRDX4, respectively30. Kim, et al, using a proteomic approach, found high level of expression of PRDX2 in RA plasma31.
PRDX4, SOD2, TPI, and TXNDC5 were found at increased concentrations in some plasma samples from patients with RA at a very early stage. The levels of PRDX4, SOD2, and TPI were considerably decreased compared to the normal levels of RA patients with long disease duration. The result provided 2 possibilities: levels of PRDX4, SOD2, and TPI are suppressed following medication, or these genes contribute to the early pathogenesis by increasing their expression — although the detailed mechanism remains unknown. TXNDC5 remained at high levels in RA blood and SF samples in the early and chronic stages of inflammation, suggesting that TXNDC5 plays an important role during the pathogenic process, and that medication with DMARD and NSAID does not affect expression of this gene.
We detected some novel proteins with overexpression in RA synovial membranes by applying proteomic surveillance to compare the overall profile of RA to that of OA and AS. Western blot and immunohistochemistry confirmed the high concentrations and tissue distributions of these proteins in the RA synovial tissues. Functional classification indicated that these identified genes were related to cell differentiation, glycol metabolism, and immunoactivation. Some of these novel proteins are antioxidative factors, suggesting that activation of endogenous antioxidant reactions is an important function during the pathogenic process of RA.
Footnotes
-
Supported by the National Natural Science Foundation of China (NTFC; 30671949), Shandong Scientific Instrument Equipment Promotion Transformation Project (2006GG1108097-41, 2007GG2TC02050), and Shandong Outstanding Project Leaders of Medicinal Sciences.
- Accepted for publication December 30, 2008.


