

Abstract
Objective. Sequence variation in gene promoters is often associated with disease risk. We tested the hypothesis that common promoter variation in the APOH gene (encoding for ß2-glycoprotein I) is associated with systemic lupus erythematosus (SLE) risk and SLE-related clinical phenotypes in a Caucasian cohort.
Methods. We used a case-control design and genotyped 345 women with SLE and 454 healthy control women for 8 APOH promoter single-nucleotide polymorphisms (SNP; –1284C>G, –1219G>A, –1190G>C, –759A>G, –700C>A, –643T>C, –38G>A, and –32C>A).Association analyses were performed on single SNP and haplotypes. Haplotype analyses were performed using EH (Estimate Haplotype–frequencies) and Haploview programs. In vitro reporter gene assay was performed in COS-1 cells. Electrophoretic mobility shift assay (EMSA) was performed using HepG2 nuclear cells.
Results. Overall haplotype distribution of the APOH promoter SNP was significantly different between cases and controls (p = 0.009). The –643C allele was found to be protective against carotid plaque formation (adjusted OR 0.37, p = 0.013) among patients with SLE. The –643C allele was associated with a ~2-fold decrease in promoter activity as compared to wild-type –643T allele (mean ± standard deviation: 3.94 ± 0.05 vs 6.99 ± 0.68, p = 0.016). EMSA showed that the –643T>C SNP harbors a binding site for a nuclear factor. The –1219G>A SNP showed a significant association with the risk of lupus nephritis (age-adjusted OR 0.36, p = 0.016).
Conclusion. Our data indicate that APOH promoter variants may be involved in the etiology of SLE, especially the risk for autoimmune-mediated cardiovascular disease.
Systemic lupus erythematosus (SLE) is a prototypic autoimmune inflammatory disease that can affect virtually any organ system. It primarily affects premenopausal women (female:male ratio = 9:1) and is characterized by a plethora of clinical manifestations, including glomerulonephritis, arthritis, pleuritis, pericarditis, and vasculitis1. Nephritis is a predictor of poor prognosis and a major cause of death in patients with active SLE2. The serological hallmark of SLE is the production of autoantibodies directed against components of the cellular nucleus. Antiphospholipid antibodies (aPL) represent a group of heterogeneous antibodies [anticardiolipin antibodies (aCL), lupus anticoagulant (LAC), and anti-ß2-glycoprotein I (anti-ß2-GPI)] that are detected in a variety of conditions, including SLE. aPL are found in ~1%–10% of a general Caucasian US population versus 30%–70% in patients with SLE and antiphospholipid syndrome (APS)3-5. APS manifests clinically with arterial and venous thrombosis, recurrent pregnancy loss, and thrombocytopenia6. Premature coronary heart disease is a major cause of morbidity and mortality in patients with SLE, and is more pronounced in younger women (35–44 yrs) for whom the estimated risk is more than 50-fold7. Genetic factors play an important role in SLE susceptibility, as reflected by heritability of up to 66%8 and a 20–80 times greater risk for family members9.
Human apolipoprotein H (APOH), also known as ß2-glycoprotein I, is a 50-kDa single-chain plasma glycoprotein (in this report, we will use APOH to refer to the gene as used in human genome databases and ß2-GPI to refer to the protein as commonly used in the rheumatology literature). APOH spans 18 kilobases (kb) on chromosome 17q23–24 and is composed of 8 exons that encode for a protein of 345 amino acid residues including 19 amino acids in the signal peptide10–12. Complete DNA sequence analysis of APOH13 has identified ~150 single-nucleotide polymorphisms (SNP), including 4 in the coding region (Ser88Asn, Val247Leu, Cys306Gly, and Trp316Ser). Significant structural homology of ß2-GPI across several mammalian species indicates evolutionarily conserved regions in the protein that may be critical for its function14,15.
Several functions have been implicated for ß2-GPI, including a role in lipid metabolism16 and blood coagulation17, binding with oxidized low-density lipoproteins (oxLDL) to form oxLDL/ß2-GPI complexes18, and being a cofactor necessary for the binding of certain aPL to anionic phospholipids in patients with autoimmune disorders19–21. Previously, 2 coding variants (Trp316Ser and Val247Leu) of APOH have shown association with the occurrence of aPL in different studies4,22–24. The presence of autoantibodies to phospholipid-free ß2-GPI has also been reported in patients with primary APS, indicating that there may be 2 epitopes on ß2-GPI targeted by autoantibodies25–27.
The association of genetic variation in the coding region of APOH with SLE risk has been examined by us23; however, a comprehensive analysis of APOH promoter SNP has not been reported yet. Since variation in promoter region could affect gene expression and disease risk, the objective of our study was to examine the association of APOH promoter SNP with SLE risk and/or SLE-related clinical phenotypes in Caucasian SLE cases and controls. For this purpose, all 8 APOH promoter SNP previously reported to be present in Caucasians (–1284C>G, –1219G>A, –1190G>C, –759 A>G, –700C>A, –643T>C, –38G>A, and –32C>A)13 were examined.
MATERIALS AND METHODS
Subjects
Peripheral blood samples were obtained from 345 Caucasian women with SLE and 454 Caucasian healthy control women. Subjects with SLE were derived from the Pittsburgh Lupus Registry and were 18 years of age or older (mean age ± standard deviation = 43.45 ± 11.40 yrs), and met the 198228 and the 1997 revised29 American College of Rheumatology (ACR) classification criteria for definite or probable SLE. The spectrum of ACR criteria was as follows in our Caucasian patient population: skin (malar rash and discoid rash) 55%, photosensitivity 59%, oral ulcers 54%, arthritis 91%, serositis 45%, renal involvement 30%, neurologic involvement 9%, hematologic involvement 52%, immunologic involvement 72%, antinuclear antibody 98%. Blood samples from Caucasian control subjects (mean age ± SD = 45.28 ± 13.14 yrs) with no history of SLE were obtained from Central Blood Bank of Pittsburgh. A second cohort of Caucasian women with SLE (n = 109) and controls (n = 81) from the Chicago SOLVABLE (Study of Lupus Vascular and Bone Longterm Endpoints) study was used to replicate the most significant SLE disease association and the most significant carotid plaque association (cases only) detected in the Pittsburgh cohort. Detailed description of the Chicago study population is reported elsewhere30. Our study was approved by the University of Pittsburgh Institutional Review Board and all participants provided written informed consent.
Diagnosis criteria for lupus nephritis among patients with SLE was based on the presence of either (1) renal biopsy showing lupus nephritis, (2) at least 2 readings of proteinuria > 0.5 g/24 h or 3+ protein by dipstick, or (3) red blood cell casts. Two main clinical measures that were used to define subclinical cardiovascular disease (CVD) in a subgroup of patients with SLE (n = 245) were the measurements of carotid intima-media thickness (IMT) and carotid plaque index. B-mode carotid ultrasound was performed using a Toshiba SSA-270 A scanner (Toshiba, Tustin, CA, USA) equipped with a 5-mHz linear array imaging probe as described31. Sonographers scanned the right and left common carotid artery, carotid bulb, and the first 1.5 cm of the internal and external carotid arteries. Plaque was defined as a distinct area protruding into the vessel lumen that was at least 50% thicker than the surrounding areas. The average carotid IMT was measured across 1-cm segments of both the right and left sides of the near and far walls of the distal common carotid artery and the far wall of the carotid bulb and internal carotid artery. Values from each location were then averaged to produce an overall measure of carotid IMT31.
Measurement of antiphospholipid antibodies
Serum samples were screened in duplicate for the presence of aCL (IgG aCL positivity defined as > 15 IgG phospholipid units, IgM aCL positivity defined as > 10 IgM phospholipid units; kits obtained from Incstar, Stillwater, MN, USA), LAC (by partial thromboplastin time or Russell’s viper venom time with mix), and anti-ß2-GPI (Quantalite ß2GPI screen; INOVA Diagnostics, San Diego, CA, USA). Additional information regarding the methods that were used to measure these 3 aPL is provided elsewhere14,23.
Genotyping
QIAamp kit (Qiagen, Chatsworth, CA, USA) was used to isolate genomic DNA from buffy coat. The 8 APOH promoter SNP numbered in relation to the translation start site (–1284C>G, –1219G>A, –1190G>C, –759A>G, –700C>A, –643T>C, –38G>A, and –32C>A) were amplified as 3 separate polymerase chain reaction (PCR) fragments. Two of the amplicons, each containing 3 APOH promoter SNP, were genotyped by pyrosequencing using the universal biotinylated primer tag (5’ – Biotin – GCT GCT CCG GTT CAT AGA TT - 3’). The PCR primers used to amplify these 2 fragments were: Fragment I (–1284C>G, –1219G>A, –1190G>C): forward (F) = 5’ TCT CCC TGA CAG ATG GAG ATT 3’ and reverse (R) = 5’ CAC ACC TGA AGC CTT TCC 3’, Fragment II (–759A>G, –700C>A, –643T>C): F = 5’ CGA ACC CTC TCA AGC A ACA 3’ and R = 5’ - TTG CAA GCT CCT ATA GCT CCA 3’. Fragment III contained 2 promoter SNP (–38G>A and –32C>A) and the primers used for PCR were F = 5’ - BioGTG GGT CTC AGA GTT CCA TTC AA 3’ and R = 5’ CCT GAC ATA TAC GAA GGG GTT GGA 3’.
Transient DNA transfection and dual-luciferase assay
The wild-type APOH plasmid construct containing the ~1.4-kb 5’ region of the putative APOH promoter was cloned into the luciferase reporter vector (pGL3- Basic). This wild-type construct contained the major alleles at all of the APOH promoter SNP (wild-type haplotype). Site-directed mutagenesis of this wild-type clone was performed using Stratagene’s QuikChange® Site- Directed Mutagenesis Kit (Stratagene, La Jolla, CA, USA) following the manufacturer’s protocol. We prepared APOH promoter-pGL3-Basic luciferase constructs bearing minor allele only at SNP –643T>C (H3 haplotype) and minor alleles at SNP –643T>C, –1190G>C, and –759A>G (H7 haplotype). For the –643T>C mutation, the forward and reverse mutagenic primers, 5’ GAC AGA TCC AAG ACA TAC TAA GAA TGG ATG AGG AGG 3’ and 5’ CCT CCT CAT CCA TTC TTA GTA TGT CTT GGA TCT GTC 3’, were designed to incorporate the desired base-pair change. The –1190G>C and –759A>G mutations were introduced using the forward and reverse mutagenic primers, 5’GAG CTT GCT ATA GCA AGG GAG GCA GC 3’, 5’ CTG CCT CCC TTG CTA TAG CAA GCT C 3’, 5’ CAG CAC TGG CCC ATT GTC TTA TCC TAC TCA AG 3’, and 5’ CTT GAG TAG GAT AAG ACA ATG GGC CAG TGC TG 3’, respectively. Transfection of the COS-1 cells was carried out with Lipofectamine 2000 reagent (Invitrogen, Carlsbad, CA, USA) following the manufacturer’s instructions. The wild-type and mutant H3 and H7 haplotype pGL3-basic firefly luciferase reporter vectors (Promega, Madison, WI, USA) harboring the ~1.4-kb region of the putative APOH promoter were used to transiently cotransfect COS-1 cells along with the Renilla luciferase control vector (pRL-TK; Promega). Transfected cells were lysed with the dual-luciferase lysis buffer 48 h after the transfection, and luciferase light outputs were measured through the TD-20/20 Luminometer (Turner Design, Sunnyvale, CA, USA). In each well, the ratio of firefly luciferase to Renilla luciferase activity was calculated after normalization against the transfection reference vector (promoter-less pGL3-Basic) to yield data reflecting fold-activity increase over baseline levels. Each experiment was performed in triplicate (intra-experiment variation) and was repeated at least 3 times (inter-experiment variation).
Electrophoretic mobility shift assay (EMSA)
EMSA was performed for the –643T>C site. Two double-stranded 30-mer oligonucleotides corresponding to the wild-type (5’-GAC AGA TCC AAG ACA TAT TAA GAA TGG-3’ and 3’-CCA TTC TTA ATA TGT CTT GGA TCT GTC-5’) and mutant allele (5’-GAC AGA TCC AAG ACA TAC TAA GAA TGG-3’ and 3’-CCA TTC TTA GTA TGT CTT GGA TCT GTC-5’) were prepared as described32. The wild-type T oligonucleotide was 5’-end-labeled with α- 32P ATP and purified by means of the QIAquick Purification kit (Qiagen). Equally concentrated, nonradioactive competitor DNA was added in 1×, 5×, 20×, 50×, 100×, 200×, and 400× excess volumes of the labeled probe. The mixture of unlabeled and labeled oligos was incubated with 2 μl (5 μg) of human HepG2 cell nuclear extracts for 20 min at room temperature in 5× gel shift binding buffer [1 mmol/l MgCl2, 0.5 mmol/l EDTA, 0.5 mmol/l dithiothreitol, 50 mmol/l NaCl, 10 mmol/l Tris-HCl (pH 7.5), 20% glycerol]. The DNA-protein complexes were then separated on 5% nondenaturing polyacrylamide gel at 120 volts for 2 h, and the gel was dried and autoradiographed overnight.
Statistical analysis
Allele frequencies were determined by direct allele counting. Concordance of the genotype distribution to Hardy-Weinberg equilibrium was tested using chi-squared goodness-of-fit test for each polymorphism. Linkage disequilibrium (LD) pattern was determined using the Haploview version 3.32 (http://www.broad.mit.edu/mpg/haploview/). To control for multiple testing concerns, we performed 2 types of “gatekeeper” analyses to determine whether there was evidence that any of these SNP influenced risk of SLE: (1) multiple regression incorporating all SNP and (2) haplotype analyses. The multiple regression analysis was performed under an additive model for genotypic effects, that is, major allele homozygote = 0, heterozygote = 1, minor allele homozygote = 2. Subsequent to observing associations with SLE risk, we performed additional analyses to determine if any of the promoter SNP also influenced specific clinical manifestations of SLE to gain insights into possible mechanisms of action. Again, to control for multiple testing concerns, we initially assessed possible associations of all SNP with clinical variables assessed in patients only (the cases who were negative for these variables were treated as controls) using a multiple regression analysis. In these analyses, the genotypic effects were modeled as dominant (i.e., major homozygote vs heterozygote + minor homozygote) because of the small sample size. For only those SNP that showed significant association in multiple regression analysis, we performed followup single-site analysis of the genotype (using Fisher’s exact test or analysis of deviance when adjusting for covariates) and allele frequencies (standard Z-test of 2 binomial proportions). Carotid plaque was categorized as plaque-positive (degree of plaque ≥ 1) and plaque-negative (degree of plaque = 0). The carotid IMT data were transformed to reduce the effects of non-normality. The covariates considered for analysis of variance, multiple regression analysis, and odds ratio (OR) calculation were age, body mass index (BMI), ever smoking, lipid profile (high-density lipoprotein cholesterol, low-density lipoprotein cholesterol, total cholesterol, and triglycerides), and C-reactive protein levels whenever they were significant for a given phenotype. All computations were performed using the R statistical software package (version 2.3.1, http://www.r-project.org). The haplotype analysis was performed using both EH (Estimate Haplotype-frequencies; version 1.2, http://linkage.rockefeller.edu/ott/eh.htm) and Haploview programs to check for overall haplotype distribution differences and individual haplotype associations, respectively. A p value < 0.05 was considered as suggestive evidence of association. Student’s t-test was used to determine statistical significance of the expression difference between the wild-type and mutant constructs. Power analysis was performed using the Quanto software (http://hydra.usc.edu/GxE).
RESULTS
APOH promoter polymorphisms and SLE
Minor allele frequencies (MAF) of the APOH promoter SNP that we observed in our control population (–1284G: 0.1%, –1219A: 9.9%, –1190C: 37.6%, –759G: 24.1%, –700A: 24.4%, –643C: 13.8%, –38A: 2.5%, –32A: 6.2%) were similar to those reported in the literature13 and/or in public databases. Due to its rare presence (MAF < 0.01), –1284C>G SNP was excluded from further analyses. Pairwise LD analysis using 7 SNP showed similar patterns in cases and controls (data not shown), therefore only the results from combined case + control cohort are presented in Figure 1. There was a strong LD with high correlation (D’ = 0.92, r2 = 0.79) between –759A>G and –700C>A SNP, hence one of these SNP (–700C>A) was excluded from subsequent multiple regression and haplotype analyses.

Pairwise linkage disequilibrium analysis of APOH promoter SNP showing r2 (× 100) values. The intensity of gray is proportional to r2, with the darkest gray being the highest r2 value.
Multiple regression analysis (Table 1) of the remaining 6 SNP showed significant association of the –1219G>A and –643T>C SNP with SLE risk after adjusting for age (p = 0.016 for each). However, the followup single-site analysis for the difference in genotype distribution and allele frequencies showed a significant association for only –643T>C; the genotype distribution of –643T>C in cases/controls was 68.8%/74.6% for TT, 26.2%/23.2% for TC, and 5.0%/2.2% for CC (age-adjusted p = 0.020); the –643C allele frequency was 18.1% in cases with SLE versus 13.8% in controls. The age-adjusted OR for the –643C allele under the additive model was 1.41 (95% confidence interval 1.07–1.86, p = 0.014). In order to replicate the –643 finding, we genotyped an independent sample from Chicago (109 SLE cases, 81 controls). No association/trend for association was observed in the Chicago group (p = 0.919); the genotype distribution of –643T>C in cases/controls was 73.3%/73.8% for TT and 26.7%/26.3% for TC. When the data from both cohorts were combined and analyzed by adjusting for the recruitment site, the association became less significant despite the increase in sample size and power [combined adjusted OR was 1.33 (95% CI 1.04 –1.70, p = 0.025)]. This suggests that the association of –643 with SLE risk may not be real.
Multiple regression* analysis of APOH promoter variants for SLE disease status, nephritis, and subclinical cardiovascular disease [carotid plaque and intima-media thickness (IMT)].
Six-site haplotype analysis identified a total of 9 haplotypes with a frequency of > 1% (Table 2). Using the EH program, the overall haplotype distribution was found to differ significantly between cases and controls (p = 0.009). Using the Haploview program, one particular haplotype (H7) was found to be present predominantly in cases (chi-squared = 19.151, p = 1.21 × 10⁻⁵). This haplotype harbored the minor alleles for the –1190G>C, –759A>G, and –643T>C SNP. When we carried out a permutation test for haplotypes in Haploview (permutation number = 1000), none of the permutations exceeded the highest observed chi-squared, confirming that the observed association of H7 was not just by chance.
Six-site haplotype analysis* of APOH promoter polymorphisms in SLE cases and controls.
APOH promoter polymorphisms and lupus nephritis
Because we obtained significant evidence that APOH promoter SNP influenced SLE risk, we next investigated whether these SNP influenced specific clinical manifestations of SLE. Multiple regression analysis in patients with lupus stratified by the presence (n = 103) or absence (n = 241) of renal disease showed significant association with –1219G>A (p = 0.014) after adjustment for age (Table 1). The –1219A allele frequency was 4.4% in SLE cases with nephritis versus 9.0% in SLE cases without nephritis. The age-adjusted OR for the –1219A allele under the dominant model was 0.36 (95% CI 0.16–0.83, p = 0.016).
APOH promoter polymorphisms and subclinical cardiovascular disease (carotid plaque and carotid IMT)
Multiple regression analysis of 6 SNP in patients with lupus stratified by the presence (n = 81) or absence (n = 164) of carotid plaque revealed significant associations with –643T>C (p = 0.003), –38G>A (p = 0.022), and –32C>A (p = 0.033) SNP after adjustment for age and lipid profile (Table 1). Subsequent single-site analyses (adjusted for age and lipid profile) revealed significant genotype differences between the 2 groups for –643T>C and –32C>A SNP but not for –38G>A. The –643C allele frequency was 8.6% in SLE cases with carotid plaque versus 18.4% in patients without plaque; the age- and lipid profile-adjusted OR for the –643C allele carriers (TT vs TC + CC genotypes) was 0.37 (95% CI 0.17–0.81, p = 0.013). The –32A allele frequency was 8.6% in SLE cases with carotid plaque versus 5.8% in patients without plaque; the adjusted OR for the –32A allele carriers (CC vs AA + CA genotypes) was 2.63 (95% CI 1.09–6.35, p = 0.031). Multiple linear regression analysis of carotid IMT using the same model as for plaque demonstrated a significant association only for –643T>C after adjustment for age and lipid profile (p = 0.036; Table 1), which was not observed in the single-site analysis.
Because –643T>C SNP was found to be associated with both carotid plaque and IMT in multiple regression analysis, we also genotyped this SNP in our Chicago SLE sample. The association of the –643T>C SNP with carotid plaque was confirmed in this independent sample of patients with SLE from Chicago (37 with carotid plaque vs 72 without carotid plaque). The age and lipid profile-adjusted OR for the –643C allele carriers (TC + CC vs TT genotypes) was 0.22 (95% CI 0.06–0.78, p = 0.019). When the data from both Pittsburgh and Chicago cohorts were combined and analyzed by adjusting for the recruitment site, the adjusted OR was 0.35 (95% CI 0.18–0.67, p = 0.002), suggesting a protective effect of –643C allele against developing carotid plaque.
APOH promoter polymorphisms and the occurrence of aPL
We categorized subjects into “aPL-positive” and “aPL-negative” groups. The aPL-positive group included participants positive for any of the following 3 antibodies: aCL (IgG and/or IgM), anti-ß2-GPI (IgA and/or IgG and/or IgM), and LAC. The aPL-negative group contained individuals negative for all aPL. None of the APOH promoter SNP was found to have a significant association with the presence of aPL in controls in multiple regression. However, in cases, the distribution of the –38G>A SNP differed significantly between aPL-positive and aPL-negative groups in both multiple regression (p = 4.57 × 10⁻⁴) and single-site analyses (p = 0.004). It is important to note that –38G>A is a relatively rare variant and was only detected in aPL-positive patients (MAF = 0.027) but not in aPL-negative patients. The significant difference in –38G>A genotype distribution was also observed when the comparison was subcategorized between aCL-positive versus aPL-negative (p = 0.018), LAC-positive versus aPL-negative (p = 0.001), and anti-ß2-GPI-positive versus aPL-negative (p = 0.002) cases using multiple regression under the dominant model.
Reporter gene expression and EMSA
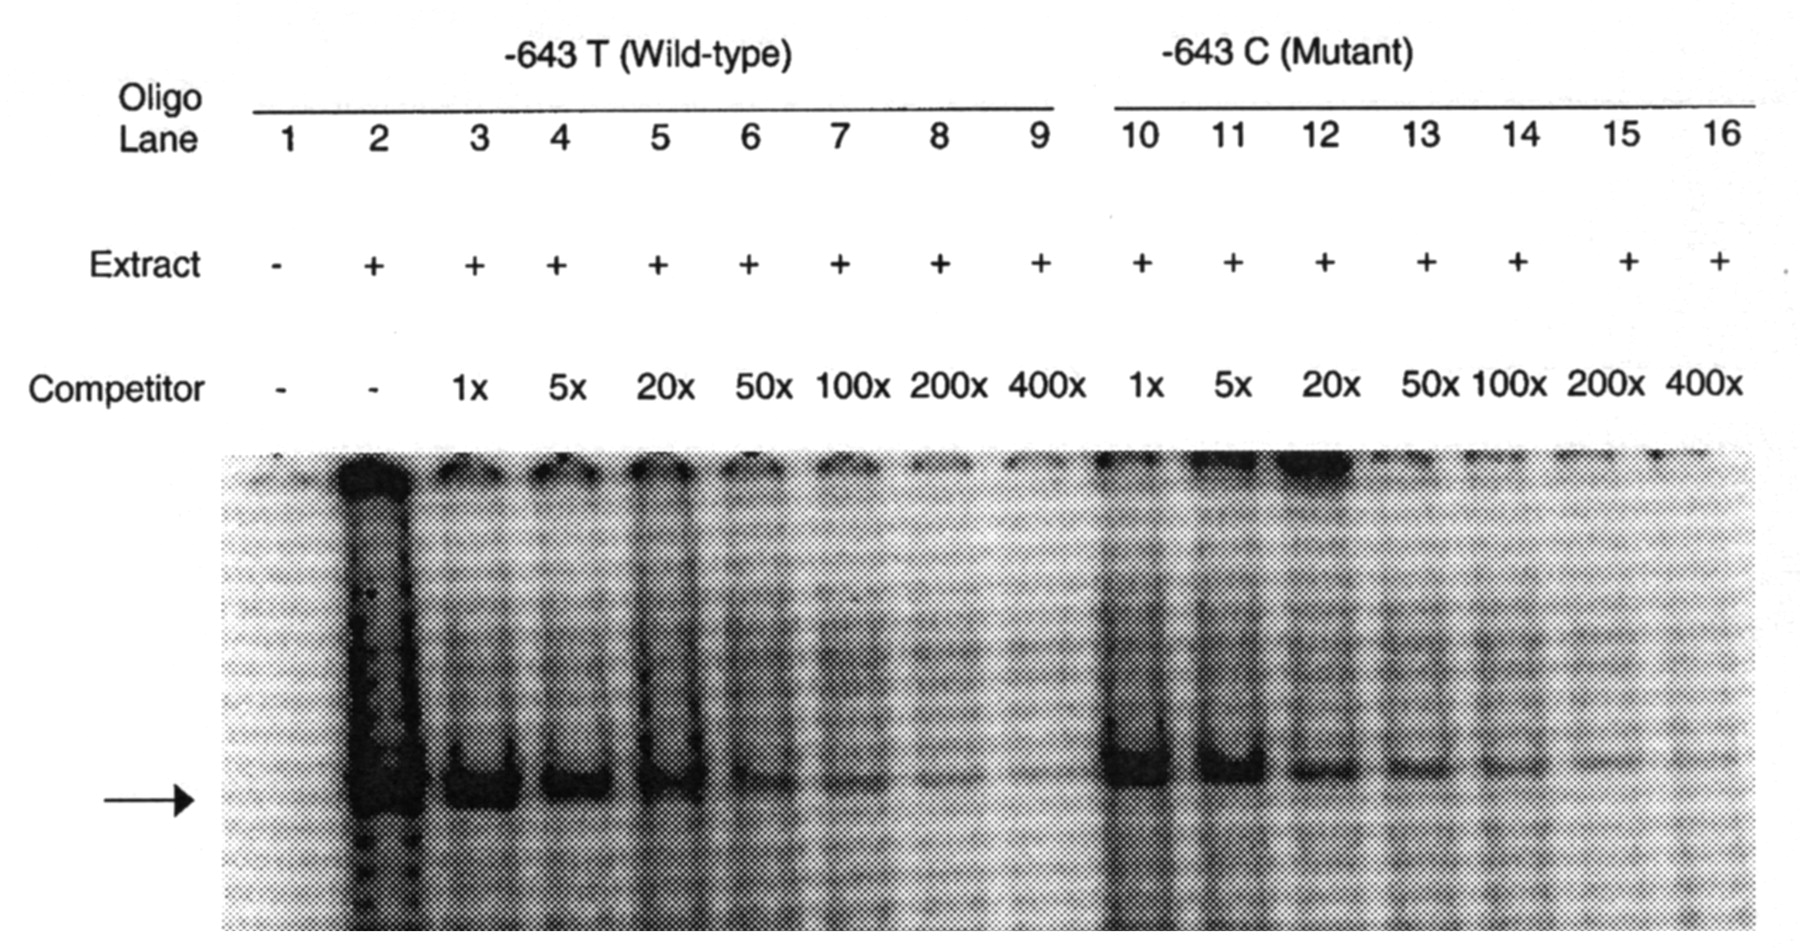
Since the –643T>C SNP was found to be consistently associated with carotid plaque in 2 independent samples, we hypothesized that it might harbor a binding site for transcription factor and also affect APOH expression. In order to determine whether –643T>C polymorphism affects the binding of putative transcription factors, EMSA was performed using allelespecific consensus oligonucleotide probes. Upon incubation of radiolabeled oligonucleotides specific for –643T and –643C alleles with HepG2 nuclear extracts, both oligonucleotides formed a DNA-protein complex (Figure 2), indicating that a nuclear factor(s) binds to this sequence. However, competition assays using increasing amounts of unlabeled wild-type (T allele) or mutant (C allele) oligonucleotides showed no allele-specific differences. To determine if the wild-type (–643T) and the mutant (–643C) alleles had different promoter activities, we created wild-type and mutant APOH promoter-firefly luciferase reporter constructs. As shown in Figure 3, our results of reporter gene assays showed a significant decrease in promoter activity associated with the mutant allele (–643C or H3 haplotype) as compared to the wild-type allele (mean ± SD 3.94 ± 0.05 vs 6.99 ± 0.68; p = 0.016). Although the –643C allele appears to be functional, in the 2 haplotypes (H3 and H7 in Table 2) that carry –643C, only H7 showed significant association with SLE risk. This suggests that other variants in the H7 haplotype might also be important in affecting APOH expression. To test this hypothesis, we mutated the defining alleles in H7 haplotype (–1190G>C, –759A>G, –643T>C) and compared its gene expression with the wildtype and H3 haplotypes. As shown in Figure 3, the H7 haplotype had the lowest luciferase activity as compared to the H3 (mean ± SD 3.33 ± 0.14 vs 3.94 ± 0.05; p = 0.002) and the wild-type haplotype (mean ± SD 3.33 ± 0.14 vs 6.99 ± 0.68; p = 0.001).

EMSA result for –643T>C polymorphism: each sample contains a mixture of 5 μg of nuclear extract derived from human HepG2 cell nuclear extract and 30xmer 32P-labeled wild-type oligonucleotide containing T allele. Arrow indicates specific DNA-protein complex associated with the –643T>C polymorphic site. Lane 1, labeled oligonucleotide without nuclear extract from HepG2 cells; lane 2, labeled oligonucleotide with nuclear extracts. Competition assay was performed by adding excess cold oligonucleotides containing either the –643 T allele (lanes 3 to 9) or the C allele (lanes 10 to 16). Lanes 3 to 9 have increasing amounts of T oligo competitor (1×, 5×, 20×, 50×, 100×, 200×, and 400×, respectively); lanes 10 to 16 have increasing amounts of C oligo competitor (1×, 5×, 20×, 50×, 100×, 200×, and 400×).
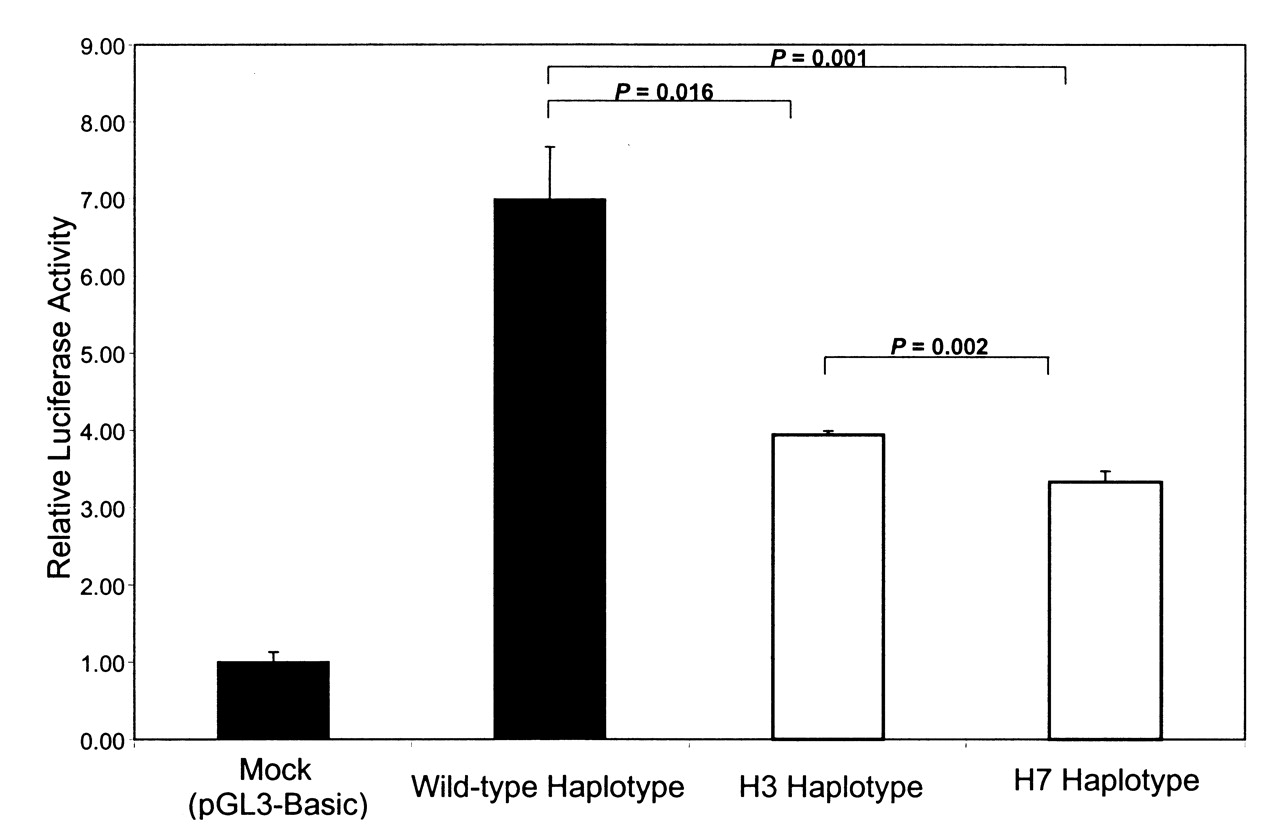
Dual-luciferase reporter gene expression: the effect of wild-type and mutants were measured as the mean of the firefly luciferase levels, which were normalized by the Renilla luciferase activity, which served as the reference for the transfection efficiency. Results are from 1 out of 2 independent experiments. The wild-type haplotype contains the major alleles at all sites. While the H3 haplotype is defined by minor allele at SNP –643T>C, H7 haplotype is defined by minor alleles at SNP –643T>C, –1190G>C, and –759A>G.
DISCUSSION
Because of the important role of ß2-GPI in the production of aPL and the observation that ß2-GPI-mediated immune response in patients with autoimmune diseases may lead to atherosclerosis18, it is important to understand the role of APOH genetic variation in relation to autoimmune diseases and associated premature CVD. A priori, one might expect that genetic variation in elements that control APOH expression (promoter region) can be associated with the disease risk. Promoter sequences are potential sources of polymorphisms affecting gene expression and phenotypic variation33. Promoter variants may potentially alter the affinities of existing protein-DNA interactions or recruit new proteins to bind to the DNA, altering the specificity and kinetics of the transcription process. To our knowledge, this is the first study to evaluate the role of APOH promoter SNP in relation to SLE and related phenotypes, including lupus nephritis and subclinical CVD.
Our study revealed a significant association for the –643T>C SNP with SLE risk in the Pittsburgh sample (p = 0.014). However, this association was not confirmed in a second relatively small sample from Chicago (p = 0.919) and further, the significance level decreased in the combined Pittsburgh + Chicago sample (p = 0.025), despite increase in the sample size and power. This suggests that either the effect of the –643T>C SNP on SLE risk is small, which is difficult to reproduce in all samples, or this association is due to chance. The latter assumption was confirmed in the haplotype analysis where one haplotype that carried the defining –643C allele (H3 haplotype in Table 2) was not associated with SLE risk. On the other hand, our 6-site haplotype analysis yielded a significant difference in overall haplotype distribution between SLE cases and controls (p = 0.009). The haplotype (H7 haplotype) with the most striking difference between cases and controls (p = 1.21 × 10⁻⁵) had a frequency of less than 2% in the total sample, suggesting that only a small number of individuals were predicted to carry this haplotype. Notably, while no example of this haplotype was observed in 888 control chromosomes based on the EH program analysis, 4.5% of the patients carried this haplotype. H7 haplotype was not defined by a particular allele, although it carried the minor alleles for 3 APOH promoter SNP (–643T>C, –1190G>C, and –759A>G). The minor alleles at these 3 SNP do not appear to be causative, as the presence of the –643C allele in H3 haplotype alone or the presence of the –1190C and –759G alleles together in H2 and H5 haplotypes did not demonstrate significant association. It appears that the simultaneous presence of these 3 alleles affects the risk of SLE in an additive fashion, as demonstrated by the H7 haplotype. The apparently additive effects of these alleles were also obvious in the gene expression assay, where the H7 haplotype was associated with greatest effect on luciferase activity. Alternatively, the unique H7 haplotype is a marker for a functional variant present in APOH or a nearby gene. Sequencing of the individuals who carry the haplotype H7 may help to identify putative functional variant(s).
The –643T>C SNP showed convincing association with the presence of carotid plaque among patients with SLE, as it was found to be associated in 2 independent samples from Pittsburgh and Chicago. In the combined Pittsburgh + Chicago SLE sample the association was more significant than observed in individual samples from each site (adjusted OR 0.35, p = 0.002). The accumulation of oxLDL is believed to initiate the process of atherosclerosis and ß2-GPI is known to inhibit the uptake of oxLDL by macrophages in vitro, while it promotes the influx of oxLDL in the presence of aPL33. Several lines of evidence suggest that autoimmune vascular inflammation and oxidative stress may promote the formation of oxLDL/ß2-GPI complexes in the arterial wall as seen in patients with SLE andAPS18. Since many patients with SLE are positive for aPL, it is likely that low ß2-GPI expression associated with the –643C allele may retard the influx of oxLDL to macrophages in the presence of aPL, and thus provide protection against plaque formation. Alternatively, there may be another mechanism underlying the effect of –643C allele on carotid plaque formation or it may simply be in strong LD with another variant, especially given that another APOH promoter variant (–32A allele), which is also associated with low APOH expression24, was associated with increased risk for carotid plaque after adjusting for covariates (OR 2.63, p = 0.031). Additional studies in large data sets may help to delineate the role of APOH promoter SNP in relation to carotid plaque formation.
Renal disease is a major cause of morbidity in patients with SLE. Some studies reported an increased production of aPL in patients with lupus nephritis, including anti-ß2-GPI and anti-oxLDL34–36. We found that –1219G>A SNP may potentially affect the lupus nephritis risk (age-adjusted OR 0.36, p = 0.016) and this effect seems to be independent from occurrence of aPL, given that this SNP did not show significant association with any of the aPL examined in our sample. Rather, we found significant association of the –38G>A SNP with the occurrence of aPL (p = 4.57 × 10⁻⁴), aCL (p = 0.018), LAC (p = 0.001), and anti-ß2-GPI (p = 0.002) in cases with SLE, but not in controls, using multiple regression under the dominant model. It is possible that the –38G>A SNP may be interacting with other factors that are involved in SLE etiopathogenesis to show its effect on aPL in an autoimmune background. It is reasonable to expect that some factors would specifically show their effects on aPL in association with disease status, thus contributing to the increased prevalence of aPL in patients with autoimmune diseases as compared to the general population. Alternatively, the APOH variants may have modest effects on the occurrence of aPL, which may be difficult to reproduce in all samples. Finally, given the very low MAF of –38G>A SNP, we cannot exclude the possibility of its spurious association.
The power for most of the SNP examined in our study was adequate to detect SLE disease-related risk. For 4 SNP (–1190G>C, –759 A>G, –700C>A, –643T>C), we had 80% power to detect odds ratios between 1.50 and 1.55. For the –1219G>A and –32C>A SNP, we had 80% power to detect an OR of 1.61 and 1.75, respectively. The power for the less common SNP (–1284C>G and –38G>A) with MAF < 0.05 was low.
We present evidence that individual APOH promoter SNP as well as haplotypes may be involved in the etiology of SLE and especially the risk for autoimmune-mediated CVD. Our results merit further investigation of APOH in independent large SLE case-control samples with subclinical phenotype information.
Acknowledgments
We thank Bonnie Kane, BS, and Beverly Smulevitz, BS, for their technical assistance.
Footnotes
-
Supported by the National Heart, Lung, and Blood Institute Grant HL 54900; grants from the National Institutes of Health F32-AR51681, K23- AR054418, and Mary Kirkland Center for Lupus Research and Rheuminations, Inc.; K24-AR02318, P60-AR30692, P60-AR48098, NCRR/GCRC M01-RR00048.
-
Dedicated to Prof. Robert E. Ferrell on his 65th birthday.
- Accepted for publication September 4, 2008.


