

Abstract
Objective. To assess the influence of biologic treatment patterns on healthcare costs for patients with rheumatoid arthritis (RA) initiating tumor necrosis factor-α (TNF-α) antagonist therapy.
Methods. Patients with 2 RA diagnoses (International Classification of Diseases, 9th ed, 714.xx), and without psoriasis or Crohn’s disease, were identified in a US employer-based insurance claims database. A sample of 2545 was constructed based on an index event of initiating TNF-α antagonist therapy and 30 months of continuous enrollment. Baseline characteristics were assessed in the 6-month pre-index period and treatment patterns were determined during the 12-month post-index period. Medical service and prescription drug costs were analyzed for Months 13–24 using multivariate regression analysis to control for baseline characteristics and time-varying confounding associated with treatment and disease severity.
Results. In the first year after TNF-α initiation, 89% used a single TNF-α antagonist; only 9% and 2% had switched TNF-α antagonists or received non-TNF biologic disease-modifying antirheumatic drugs, respectively. Descriptive analyses revealed pairwise differences between groups (p < 0.05) in baseline characteristics (comorbidities, RA-related procedure use, and prescription drug use). Controlling for observed baseline characteristics, costs were greater for those treated with multiple vs single TNF-α antagonists: annual RA-related prescription drug costs ($8,340 vs $7,058; p = 0.012), RA-related healthcare costs ($15,048 vs $13,312; p = 0.008), and total healthcare costs ($26,697 vs $21,381; p < 0.001).
Conclusion. In this sample, the majority of patients with RA were treated with a single TNF-α antagonist over the first year on therapy. For those who switched therapy, Year 2 RA-related and total direct healthcare costs were higher, adjusting for claims-based measures of RA disease severity.
Rheumatoid arthritis (RA) is a chronic, progressive autoimmune disease that attacks the synovial membranes in hand, wrist, and feet joints in a symmetrical pattern1. RA is an incurable but treatable disease that affects about 1% of the US population2. It is more common in women than men, and prevalence increases with age. Several therapeutic options for the treatment of RA are available, including nonbiologic and biologic disease-modifying antirheumatic drugs (DMARD). In 1998, the first 2 biologic DMARD, both tumor necrosis factor-α (TNF-α) antagonists, were introduced in the United States for treatment of RA. Subsequently, 4 other biologic DMARD, including a third TNF-α antagonist, were introduced between 2001 and 2006.
Treatment guidelines from the American College of Rheumatology now present recommendations for biologic DMARD in addition to nonbiologic DMARD according to disease duration interval, features of poor prognosis, and level of disease activity3. TNF-α antagonist therapies (infliximab, etanercept, and adalimumab) are recommended in early RA for those who have never received DMARD and have high disease activity. In the case of intermediate-duration and longer-duration RA, TNF-α antagonists are recommended for patients with moderate disease activity and poor prognostic features after inadequate response to prior methotrexate (MTX) monotherapy. They are also recommended for patients on the basis of high disease activity alone, irrespective of prognostic features. In addition, the guidelines also recommend TNF-α antagonist therapy when moderate residual disease activity is present in patients who have experienced an inadequate response to prior treatment with MTX in combination with another nonbiologic DMARD, or after sequential nonbiologic DMARD, also irrespective of prognostic features. Abatacept and rituximab, 2 non-TNF biologic DMARD, are recommended after inadequate response for patients treated with MTX in combination with biologic DMARD or sequential administration of other nonbiologic DMARD with at least moderate (abatacept) or high (rituximab) disease activity and indicators of a poor prognosis3. The recently published European League Against Rheumatism treatment guidelines recommend that patients should receive another TNF-α inhibitor or non-TNF biologic after inadequate response to an initial TNF-α inhibitor4.
Three recent studies examined TNF-α antagonist use among RA populations over time. The first study, a sample of privately insured RA patients in an administrative claims database initiating TNF-α antagonist therapy, found a relatively high percentage of patients continuing on therapy over time (2000–2005)5. That study also documented decreased continuation on initial TNF-α antagonist use and switching more quickly to a second TNF-α antagonist during the 2003–2005 time frame. Using the same administrative claims database, the second study found high mean continuation on TNF-α antagonist therapy over 12 months among RA patients initiating TNF-α antagonist therapy in combination with MTX6. High 1-year treatment persistence for initial TNF-α antagonist and diminished annual persistence for second and third TNF-α therapies have been observed in a sample of patients enrolled in the Spanish national registry of patients with different forms of chronic arthritis initiating TNF-α antagonist therapy between 2000 and 2004, of whom 68% had RA7.
Costs associated with RA, both direct and indirect, have been documented in an array of studies and with varying methodological approaches8. Among the most recent studies, an international survey estimated that annual burden of illness to society associated with RA exceeds $58 billion (2006 US dollars, current exchange rate) in the United States and 45.3 billion (2006 Euros) in Europe9. Two of the most recent studies of privately insured RA patients receiving TNF-α antagonist therapy documented total direct healthcare costs ranging from $23,941 to $28,351 (2005 US dollars)10 and mean total direct healthcare costs of $18,269 (2005 US dollars)6. Another recent study, using 3-year longi tudinal medical service and prescription drug use data of RA patients in the National Databank for Rheumatic Diseases (N = 7527), estimated mean total direct healthcare costs of RA patients at $9,519 (2001 US dollars) when costing services at Medicare reimbursement rates and drugs at median wholesale price11. Direct and indirect costs of RA to an employer have been estimated by comparing costs of RA patients to matched controls, with 1997 annual total costs associated with medical, pharmaceutical, and work loss expenditures for RA patients estimated to be about twice those for matched controls12. Estimates of indirect costs (primarily wage losses) are double or triple direct healthcare costs associated with RA12,13. Across all studies published since 2000, the share of total costs associated with prescription drug costs varies substantially: 53.9% (1987, 1994, 1995–96)8; 66.4% (1999–2001)11; 58.8% (2000–2004)10; and 80.8% (2000–2004)6.
Despite extensive research on direct and indirect costs associated with RA, little is known about the relationship between treatment patterns in actual clinical practice and total healthcare costs. The purpose of this investigation was to analyze the implications of biologic treatment patterns on direct healthcare costs in a sample of patients initiating TNF-α antagonist therapy. Specifically, using administrative claims data, we stratify diagnosed and treated patients by 12-month treatment pattern after initiating TNF-α antagonist therapy and analyze observed direct healthcare costs in a subsequent 12-month period, controlling for clinical and demographic patient characteristics that may be identified in these data.
MATERIALS AND METHODS
Data
The data used for this study are from a de-identified employer-based health insurance database of administrative claims for medical services and prescription drugs provided between 1999 and 2007. The database contained claims for over 8.9 million individuals who are either employees or covered dependents at 40 large companies with operations throughout the United States. These individuals are generally representative of the population with employer-provided health insurance. Medical and pharmacy claims submitted for insurance reimbursement are included in the database, and eligibility records include information on age, sex, and periods of coverage eligibility. Each medical service claim includes information on type of service, procedure code, date of service, resulting diagnoses, and reimbursed amount. Pharmacy claims include information on drug prescribed, National Drug Code (NDC), days of supply, and reimbursed amount.
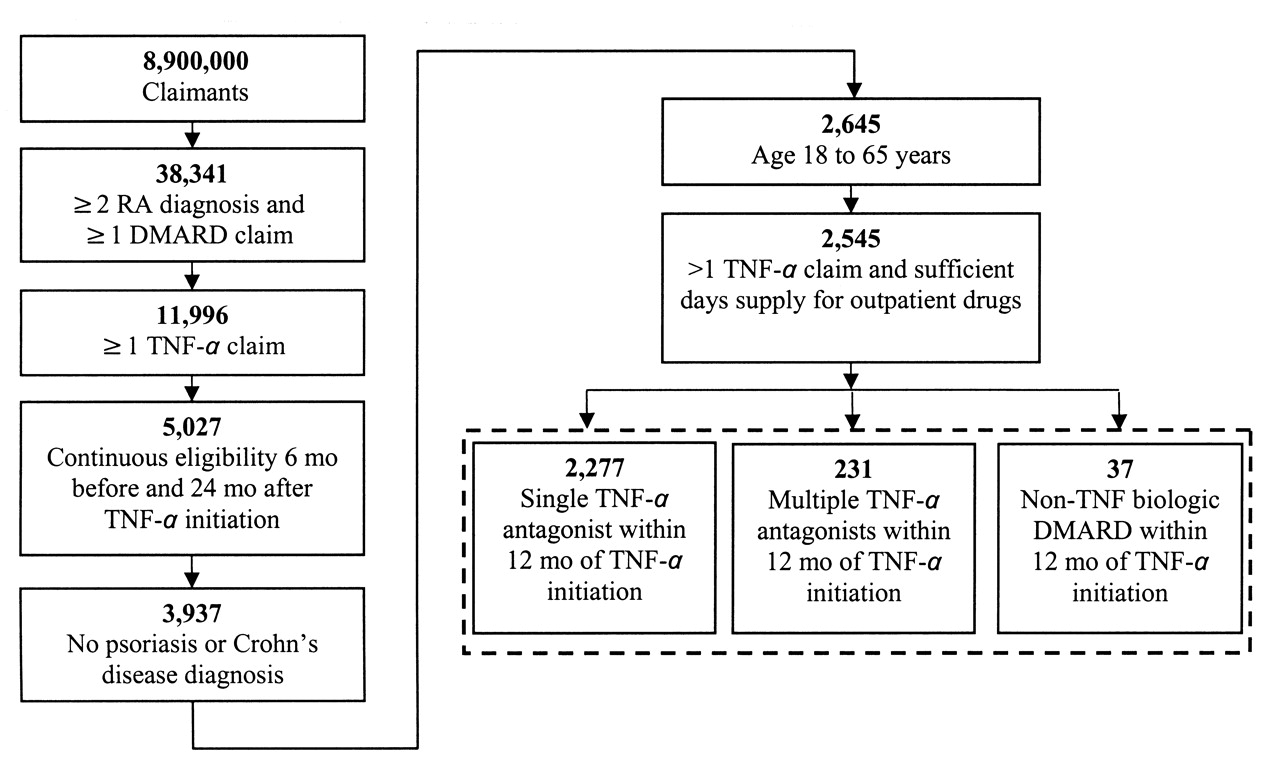
The study sample was based on 2 key inclusion criteria: (1) at least 2 diagnoses (primary or secondary) for RA (ICD9 code 714.xx) recorded in medical service claims; and (2) at least 1 claim for a TNF-α antagonist therapy identified using J-codes on medical claims (provider-administered drugs) and NDC codes on pharmacy claims (self-administered drugs). The sample was refined with criteria for continuous insurance plan eligibility, including 6 months of eligibility prior to initiation of TNF-α antagonist and 24 months of continuous eligibility after initiation of TNF-α antagonist. To ensure that the study focused on typical RA treatment patterns and outcomes, we excluded all patients with a medical claim including a diagnosis (primary or secondary) for comorbid psoriasis (ICD9 code 696.xx) or Crohn’s disease (ICD9 555.xx). We also excluded patients aged below 18 or above 65 years during the continuous eligibility period and patients without complete prescription drug records. Figure 1 shows the sample selection algorithm.

Sample selection and patient counts. RA: rheumatic arthritis; DMARD: disease-modifying antirheumatic drugs; TNF-α: tumor necrosis factor-α.
Baseline, treatment pattern definition, and cost analysis periods
Initiation of TNF-α antagonist was defined as the index event for the analyses of treatment patterns and subsequent direct healthcare costs (Figure 2). We defined the 6-month period prior to the index event as the baseline period, and the 24-month period following initiation of TNF-α antagonist as the study period. The study period was divided into two 12-month segments: the treatment pattern definition period (Months 1–12) and the cost analysis period (Months 13–24). Patients are classified to a treatment pattern according to observed treatments in Months 1–12, and their costs are analyzed for observed costs during Months 13–24. Accordingly, all analyzed costs are subsequent to definition of treatment pattern and classification of claimants.

Initiation of TNF-α antagonist was defined as the index event for analyses of treatment patterns and direct healthcare costs. TNF-α: tumor necrosis factor-α.
Treatment patterns
We defined 3 treatment patterns based on biologic therapy for the treatment of RA during the first 12 months after initiation of TNF-α antagonist. The 3 treatment patterns were constructed using claims for prescribed outpatient and provider-administered prescription drugs, including 6 biologic DMARD for RA — the 3 TNF-α antagonists (adalimumab, etanercept, infliximab) and 3 non-TNF biologic DMARD (abatacept, anakinra, and rituximab). Biologic therapies were identified using medical procedure codes (Healthcare Common Procedure Coding System, J-codes) and prescription drug codes (NDC).
The first treatment pattern was characterized by use of a single TNF-α antagonist, the initial TNF-α antagonist claim identified as the index event. The second treatment pattern was characterized by use of at least one other TNF-α antagonist without use of a non-TNF biologic DMARD within 12 months of initiating TNF-α antagonist therapy. The third treatment pattern was characterized by use of a non-TNF biologic DMARD within 12 months of initiation of a TNF-α antagonist. By construction, these treatment patterns are mutually exclusive.
Covariates
To control for observed factors that potentially confound healthcare costs, we constructed a number of variables reflecting demographic characteristics, health status, and RA disease severity to serve as covariates in our analysis of healthcare costs. Demographic characteristics included age at the index event date and sex. Health status variables included indicators for baseline conditions (cancers, gastrointestinal diseases, upper respiratory and intestinal infections, diabetes, fatigue, fibromyalgia, genitourinary disease, depression, osteoporosis, and systemic lupus erythematosus) and a modified Charlson Comorbidity Index (excluding RA and systemic lupus erythematosus)14 to ensure that any observed cost differences are associated with RA. We constructed RA disease severity proxies based on medical care use (hospital inpatient, rheumatologist office visits, bone and joint procedures, joint imaging procedures, use of occupational therapy and physical therapy, total baseline RA-related inpatient and outpatient healthcare cost) and RA-related prescription drug use [nonsteroidal antiinflammatory drugs (NSAID), opioids, non-opioid analgesics, conventional DMARD] during the baseline period, and separately for Months 1–12.
Healthcare costs
Annual direct healthcare cost measures were constructed by aggregating payments for individual claims by patients for medical service and prescription drug use during Months 13–24 after initiation of TNF-α antagonist (the cost analysis period; Figure 2). Costs for Months 1–12 are not considered in this study. Total direct cost measures were also constructed for medical services, prescription drugs, and all healthcare services. All costs were inflated to 2007 US dollars.
To assess RA-related costs, we defined certain medical services as RA-related based on either a primary or secondary diagnosis of RA (ICD9 714.xx) on the claim for the service. We defined any prescription drug claim as RA-related if the prescribed drug was a DMARD indicated for the treatment of RA between 1999 and 2007, or an NSAID or analgesic frequently used in the abatement of joint pain. The DMARD included TNF-α antagonists (adalimumab, etanercept, infliximab), non-TNF biologic agents (abatacept, anakinra, rituximab), and nonbiologic agents (auranofin, aurothioglucose, azathioprine, chlorambucil, chloroquine, cyclophosphamide, cyclosporine, gold sodium thiomalate, hydroxychloroquine, leflunomide, methotrexate, minocycline, pencillamine, sulfasalazine).
Statistical methods
We estimated regression models to assess the influence of biologic DMARD treatment patterns defined in Year 1 on direct healthcare costs in Year 2, controlling for observable covariates. The dependent variables in these models were total healthcare costs, medical service costs, and prescription drug costs for RA-related, non-RA-related, and all healthcare.
Our model specification was a log-linear relationship between the conditional mean of treatment costs and several explanatory variables. Patients treated with either multiple TNF-α antagonists or a non-TNF biologic DMARD were identified by indicator variables; the single TNF-α antagonist treatment pattern was the reference group. Each model specification also included explanatory variables accounting for patient characteristics, comorbidities, and proxies for RA disease severity, and number of months of biologic DMARD use in Months 1–12.
We evaluated the relationship between biologic treatment patterns and subsequent costs using 2 estimation strategies. A generalized linear model (GLM) with log-link function and gamma distributed error was the first estimation strategy. This estimation strategy is (statistically) consistent assuming no time-varying confounding in treatment, and has been recommended for highly skewed cost data15. To account for patients with zero costs, we estimated 2-part cost models using a logit specification for the probability of positive costs and the GLM model for expected healthcare costs conditional on positive costs16,17,18.
The second estimation strategy was a marginal structural model (MSM). Unlike GLM estimation, MSM estimation is consistent in the presence of time-varying confounding, such as the effects of differences in RA disease severity during Months 1–12 on biologic treatment19,20,21. In addition to the controls included in the GLM estimation, the MSM estimation adjusted for differential biologic treatment due to RA disease severity in Months 1–12 through the use of inverse probability of treatment weights (IPTW)19,22 calculated by logistic regression. The non-TNF biologic DMARD group was excluded to satisfy consistency assumptions for this estimator.
Hypothesis testing was performed using the empirical bootstrap procedure on estimation results23. Empirical p values and confidence intervals are presented for pairwise comparisons of discrete and continuous variables from 10,000 nonparametric replications. Regression coefficient estimates were exponentiated to produce an estimate of percentage changes in healthcare costs given a unit change in each explanatory variable, which enabled us to assess the contribution of individual variables to variation in costs, conditional on positive costs. Analytic file construction was performed using SAS version 9.2 (SAS Institute, Cary, NC, USA); statistical analysis was performed in Stata version 10.1 (StataCorp LP, College Station, TX, USA).
RESULTS
Applying the study inclusion and exclusion criteria resulted in a sample of 2545 patients. In the 12-month post-index treatment pattern definition period, 2277 patients (89.5%) had claims for only the initial TNF-α antagonist, 231 patients (9.1%) had claims for multiple TNF-α antagonists without a non-TNF biologic DMARD, and 37 patients (1.4%) had claims for a non-TNF biologic DMARD. Over the 24-month post-index period, treatment patterns were not dramatically different, with 2079 patients (81.7%) having claims for only the initial TNF-α antagonist, 399 (15.7%) with claims for multiple TNF-α antagonists, and 67 (2.6%) with claims for a non-TNF biologic DMARD (Table 1). Treatment patterns differed between 12 and 24 months for 206 patients (176 single TNF-α patients initiated another TNF-α, 22 single TNF-α patients initiated a non-TNF biologic, and 8 multiple TNF-α patients initiated a non-TNF biologic in Months 13–24). Because the non-TNF biologic treatment pattern group was relatively small, we present results for this group in the accompanying tables but do not draw inferences about healthcare costs from these findings.
Biologic disease-modifying antirheumatic drug (DMARD) treatment patterns for 12 and 24 months after index initiation of TNF-α antagonist. Data are number (%) of patients with RA. TNF-α antagonists are adalimumab, etanercept, and infliximab. Non-TNF biologic DMARD are abatacept, anakinra, and rituximab.
Of those patients treated with either multiple TNF-α antagonists or a non-TNF biologic DMARD, a greater percentage were female (80% and 81%, respectively) than among those that had used only a single TNF-α antagonist (74%). We did not find differences in age at initiation of biologic DMARD treatment across treatment pattern groups; the average age at initiation matched that identified in a recent evaluation of use of TNF-α antagonists, 50.2 years6.
Comorbidity status and disease severity
We observed some differences at baseline in the comorbidity profile and characteristics associated with RA disease severity between the single TNF-α antagonist group and the other 2 treatment pattern groups (Table 2). The modified Charlson Comorbidity Index was the same for the single and multiple TNF-α antagonist groups (0.4), but higher for the non-TNF biologic DMARD group (0.8). Patients with use of multiple TNF-α antagonists had more complex comorbidity profiles (diseases of the digestive system, upper respiratory infections, intestinal infections, and fibromyalgia) at baseline than those with single TNF-α antagonist use.
Demographic and clinical characteristics by biologic treatment pattern. The baseline period is the 6-month continuous timespan preceding the index event of initiation of TNF-α antagonist. TNF-α antagonists are adalimumab, etanercept, and infliximab.
In addition, we found some significant differences between the single and multiple TNF-α antagonist groups in medical procedure and prescription drug use at baseline. Patients treated with multiple TNF-α antagonists were more likely to have had a hospital admission, bone/joint imaging, a hand and wrist radiograph, a chest radiograph, a prescription opioid analgesic, and a prescription for leflunomide (Table 2). These findings are consistent with greater RA disease severity prior to initiation of biologic DMARD among the multiple TNF-α antagonist group.
Medical service and prescription drug costs
GLM regression-adjusted direct healthcare costs (RA-related, non-RA-related, and all) for Months 13–24 after initiation of TNF-α antagonist are presented in Table 3.
Generalized linear model (GLM) regression-adjusted healthcare costs during Months 13–24 for subjects classified by treatment pattern during Months 1–12, estimated as 2 part model for probability of positive costs and GLM for positive costs. Costs are based on payments from health plans to providers over the period January 1, 1999, through December 31, 2007. All costs expressed in 2007 US$.
RA-related direct healthcare costs
RA-related medical service costs were not significantly different for the multiple TNF-α antagonist group in comparison to the single TNF-α antagonist group ($6,495 vs $6,280, respectively; p = 0.469). RA-related prescription drug costs were, however, significantly different for the multiple TNF-α antagonist treatment pattern group ($8,340 vs $7,058; p = 0.012). Total RA-related healthcare costs were also greater for the multiple TNF-α antagonist treatment pattern group ($15,048 vs $13,312; p = 0.008).
Non-RA-related direct healthcare costs
GLM regression-adjusted annual non-RA-related costs for Months 13–24 differed significantly between the multiple TNF-α antagonist group and the single TNF-α antagonist group for medical services ($9,653 vs $5,666; p < 0.001) and for prescription drugs ($3,043 vs $2,175; p < 0.001). Total non-RA-related healthcare costs necessarily were also greater for the multiple TNF-α antagonist treatment pattern.
All direct healthcare costs
GLM regression-adjusted cost estimates for all direct healthcare costs were also significantly greater for the multiple TNF-α antagonist treatment pattern. Controlling for observed characteristics, disease severity, and comorbid conditions at baseline, all annual healthcare costs were over $5,000 greater for the multiple TNF-α antagonist treatment pattern ($26,697 vs $21,381; p < 0.001).
Predictors of RA-related healthcare costs
Table 4 presents exponentiated GLM regression coefficient estimates and statistical test p values. Exponential-transformed regression coefficient estimates are interpreted as the percentage change in total annual direct healthcare costs associated with a 1-unit change in the variable. Variables with statistically significant coefficients are deemed cost predictors. Among the variables, disease severity measures were strong predictors of RA-related treatment costs. Specifically, use of bone or joint procedures and greater outpatient services costs at baseline were associated with higher total healthcare costs during the cost analysis period, whereas opioid analgesic and occupational therapy — treatment interventions mitigating the effects of RA symptoms — were associated with lower costs during the cost analysis period. Not surprisingly, variables measuring intensity of RA treatment with DMARD during Months 1–12 were also strong predictors of greater RA-related costs during Months 13–24. Among the demographic and clinical characteristics related to comorbidity profile, age was a strong predictor for RA-related total and prescription drug costs but not medical service costs. Claims evidence of fibromyalgia, osteoporosis, or lupus at baseline had no influence on RA-related costs during the cost analysis period.
Predictors of RA-related treatment costs, estimated as an unweighted generalized linear model (GLM) regression with logarithmic-link function and gamma distribution as the second step of a 2-part model. Columns are organized by dependent variable; rows are by treatment, patient characteristic, and baseline disease severity variables.
DISCUSSION
This retrospective study used a large administrative claims database to analyze the healthcare costs of RA patients initiating TNF-α antagonist therapy according to biologic DMARD treatment patterns. Classification of patients according to treatment observable in the claims database was used to identify a particular subset of subjects with differential baseline disease experience, hospitalization, procedure use, and future healthcare and prescription drug costs in the absence of clinical and demographic information. Biologic DMARD treatment patterns were defined over Months 1–12, and direct costs were examined for Months 13–24. Key findings in our study of the relationship between biologic DMARD treatment patterns and future healthcare costs include the frequency of distinct biologic 12-month treatment patterns, comorbidity and disease severity profiles, and estimates of Year 2 direct healthcare costs, both RA-related and non-RA-related.
We observed low rates of treatment switching within 2 years of TNF-α initiation as the single TNF-α treatment pattern was the most common treatment pattern (89% at 1 year after initiation of TNF-α antagonist; 81% at 2 years). Low observed use of multiple biologic DMARD is consistent with initial TNF-α antagonist persistence at 1.5 years (88%, implied weighted average) in a recent study5. We conclude that treatment-switching among biologic DMARD in a real-world setting was uncommon for RA patients within 2 years of initiating TNF-α antagonist therapy before 2008. Recent evidence suggests that treatment-switching may be increasing, in part due to greater access to biologic DMARD24.
We observed significantly greater direct healthcare costs during Months 13–24 for patients in the multiple TNF-α antagonist treatment pattern compared to the single TNF-α antagonist treatment pattern. Total direct healthcare costs differed because of both greater RA-related and greater non-RA-related costs. RA-related costs differed because of prescription drug costs; we observed no difference in RA-related medical services costs. Multivariate analyses, controlling for observed RA disease severity proxies at baseline (GLM) or through Year 1 (MSM), confirmed these descriptive differences in cost. We conclude that differences in observable RA disease severity, at baseline or in Months 1–12, do not explain RA-related direct cost differences between the multiple and single TNF-α treatment patterns.
We found that the multiple TNF-α antagonist treatment pattern was associated with increased non-RA-related medical services and prescription drug costs. Non-RA-related direct healthcare costs were more than $4,000 greater for the multiple compared with single TNF-α antagonist treatment pattern ($12,281 vs $8,030, respectively; p < 0.001). Differences in non-RA-related costs across these RA treatment patterns suggest that complex comorbidities influence the treatment of RA, including earlier switching of biologic DMARD. These data further suggest that, on average, RA patients in the multiple TNF-α treatment pattern are inherently sicker and more costly to treat. This interpretation is consistent with the finding of significantly greater hospitalization rates at baseline for the multiple TNF-α antagonist treatment pattern (13.0% vs 7.8%). Additional study is needed to characterize specific differences in comorbidity profiles of RA patients receiving biologic DMARD, and to fully understand differences in medical resource and prescription drug use.
In general, our findings were consistent with those in recently published studies of RA direct healthcare costs that use administrative claims data. Our estimated RA-related healthcare costs measured over Months 13–24 for the single and multiple TNF-α antagonist treatment patterns ($13,312 and $15,048, respectively) closely match the implied weighted average total RA-related costs for Months 1–12 from a recent study with a similar patient population ($16,957)10. That study found significant differences in RA-related costs across TNF-α antagonists ($15,098 to $21,260), a consideration not investigated in our study. Although differences in shares of TNF-α antagonists may affect comparability of the results, our lower estimated RA-related costs for the second year of use suggest that total RA-related healthcare costs decrease slightly by year since initiation of TNF-α. Additional research is needed to fully characterize cost dynamics.
Our finding of lower annual direct healthcare costs for the single TNF-α antagonist treatment pattern contrasts with a finding of greater annual direct healthcare costs for RA patients with relatively high persistence (≥ 80%) to initial TNF-α antagonist ($19,271 vs $15,598, measured over Months 1–12; p < 0.001)6, where persistence was defined as the share of the year with a recently filled TNF-α prescription or administration. Differences in sample selection and study design may explain this apparent divergence. Our study includes patients with multiple biologic DMARD and stratifies according to single versus multiple TNF-α antagonists, rather than excluding patients with multiple biologic DMARD and stratifying according to persistence. Although persistence was not used to stratify the sample in this study, the highly significant duration of DMARD therapy variables in the multivariate analyses (Table 4) is consistent with greater costs for patients with high persistence.
We estimated regression-adjusted total annual direct healthcare costs per patient of $21,381 and $26,697 one year after initiation of TNF-α for the single and multiple TNF-α antagonist treatment patterns, respectively. These estimates closely match recently reported estimates for similar patient populations: $18,2696 and $25,296 (implied weighted average)10.
Data and methodological limitations temper the general applicability of our findings. First, our study was affected by the limitations of administrative claims data. These data do not include clinical measures of RA disease severity or measures of initial treatment response or subsequent loss of treatment effect. We attempted to address these data limitations using proxy measures for RA disease severity at baseline and Months 1–12. The cost data in administrative claims are also limited because prescription records do not include a diagnosis code, and because all costs, both prescription and medical resource costs, are identifiable only for claims submitted to the principal insurer; costs for other prescriptions or medical resource use are not recorded. The cost data are therefore incomplete direct-cost measures. Methodological limitations include those associated with RA disease severity controls and time-varying confounding. Inferences from the multivariate analyses are limited if observable proxy measures of disease severity do not closely reflect the unobservable RA disease severity, or if IPTW reweighting in the MSM estimation did not accurately reflect time-varying confounding, possibly due to unobservable changes in severity.
Our study extends the larger body of work investigating biologic treatment patterns, particularly those associated with use of TNF-α antagonists, and their influence on subsequent healthcare costs. The findings given here represent a formal analysis of treatment patterns and subsequent costs, where the definitions of treatment pattern are temporally distinct from, rather than contemporaneous with, the aggregation of costs. Future treatment pattern and cost analyses should take advantage of larger samples of RA patients where recent data reflect greater availability of biologic treatment options to physicians, more switching among TNF-α antagonists, and greater use of non-TNF biologics after TNF-α antagonists.
Footnotes
-
Supported by Eli Lilly and Company.
- Accepted for publication June 23, 2011.


