

Abstract
Objective. The central nervous system (CNS) is often affected by systemic lupus erythematosus (SLE), but assessment of CNS outcomes using noninvasive cerebral structural measures remains in its infancy. Magnetic resonance imaging (MRI) with expert visual interpretation is critical to diagnosis, but does not permit quantitative measurements. Our pilot study investigated whether quantitative brain volumetric analyses could be used to detect white-matter (WM) abnormalities and responses to treatment in SLE (ClinicalTrials.gov: NCT00703742).
Methods. Forty-two pairs of SLE patients and healthy controls underwent high-resolution 3-dimensional structural MRI scans. Combining voxel-based morphometry and region of interest analyses, subtle WM volume abnormalities in whole brains from SLE patients were identified, and regional WM volume was calculated. Associations between WM volume and symptom severity, as well as the effects of immunosuppressive therapy, were then investigated.
Results. The WM volume of the SLE group was significantly decreased in the bilateral posterior and anterior crus of the internal capsule (PIC and AIC, respectively), the subgyral right frontal lobe, and left temporal lobe (p < 0.001). Regional WM volume (left PIC and right AIC) was correlated with SLEDAI scores. The WM volume of patients treated with immunosuppressive therapy was greater than that of patients who were never treated with immunosuppressive therapy.
Conclusion. Quantitative brain volumetric analyses detect brain injuries in WM for SLE that are not obvious by conventional MRI, and may be adequately sensitive and quantitative to measure the effect of therapeutic interventions in preventing brain injury and outcomes in SLE.
Systemic lupus erythematosus (SLE) is an autoimmune disease involving almost all organ systems. Central nervous system (CNS) involvement is typical during the course of SLE1,2, and thus has attracted the attention of researchers. Neuropsychiatric SLE (NPSLE) is one of the most common manifestations of SLE and is often associated with a more active disease and poorer outcomes3. Neuropsychiatric symptoms vary from serious neurologic and psychiatric disorders to more subtle signs and symptoms, such as mood disorders and cognitive dysfunction4–6. CNS involvement results in more complex and varied symptoms, compared with other organs, implying the common but distinct involvement of the brain in the pathophysiology of SLE. However, sometimes it is difficult to carry out an early diagnosis of the NPSLE disease process using clinical signs, and such a diagnosis is frequently presumptive7. If subclinical involvement of brain structures could be identified before the emergence of clear neuropsychiatric symptoms, earlier intervention could be initiated, potentially preventing progressive brain injury.
Magnetic resonance imaging (MRI) is more sensitive and accurate than computerized tomography and is widely used to detect anatomic brain abnormalities, including cerebral atrophy8–10. We investigated whether conventional MRI could be enhanced with quantitative brain volumetry, using combined voxel-based morphometry (VBM) methods and region of interest (ROI) analysis in order to detect subtle abnormalities of white matter (WM) in SLE that are not obvious in conventional MRI. A second objective was to explore the potential association between these quantitative measures of WM abnormalities and clinical characteristics such as symptom severity, and whether this quantitative method might be sensitive to measure outcomes in terms of response to immunosuppressive therapy.
MATERIALS AND METHODS
Subjects
SLE patients treated in the inpatient or outpatient facilities of the Rheumatology and Immunology Department of the First Affiliated Hospital of Kunming Medical College were recruited for study. All were studied with a standardized protocol and followed by the same investigator throughout this research.
The inclusion criteria were the following: (1) patients diagnosed as having SLE by 4 or more criteria, according to the 1997 revised American College of Rheumatology (ACR) criteria for the classification of SLE11; (2) subjects between the ages of 18 and 45 years; and (3) subjects willing to attend this study and give written consent.
The exclusion criteria included the following: (1) patients fulfilling the ACR criteria for rheumatoid arthritis, systemic sclerosis, Sjögren syndrome (primary or secondary), or other connective tissue diseases and drug-induced SLE; (2) patients with organic brain or neurological disorders that would disturb the structure or diffusion imaging of the brain (i.e., history of head trauma, Parkinson’s disease, or seizures); (3) patients with major CNS manifestation, such as obvious disorganized behavior, psychiatric disorder, or conscious disturbance; (4) patients with a substance use history; (5) patients who are pregnant or have any physical illness, as assessed by personal history; (6) patients unable to undergo MRI, or patients with claustrophobia or a pacemaker; and (7) patients with serious clinical conditions that could influence cerebral atrophy, such as a history of arterial hypertension, diabetes mellitus, stroke, or renal insufficiency.
Sixty-one patients diagnosed with SLE were interviewed. However, after intensive collection of personal histories of physical disease, complete physical examinations, and laboratory tests, only 49 patients matched the study criteria and were recruited. Of the 12 patients that were excluded, 2 had a history of brain infarction, one a history of heart surgery, one had a pacemaker, and 8 were found to have other connective tissue diseases (5 Sjögren syndrome, 2 rheumatoid arthritis, 1 polymyositis). The remaining 49 patients received further investigations including additional laboratory tests (thyroid and renal function tests, etc.), disease activity scales, questionnaires, and an MRI scan. After recruitment, another 3 patients were excluded; 2 had abnormal thyroid function and one was found to have high systolic blood pressure of 140 mm Hg on the day of MRI scans. These 3 were also excluded. Finally, 46 SLE patients were entered into the study and underwent MRI scans.
Forty-five healthy controls (HC) matched for sex and age with individual members of the study groups, were also recruited. To decrease the disparity between groups, HC were matched one to one with a study participant, according to the demographic data. A complete general physical examination, with attention to neurological examination, was applied to all HC by an experienced rheumatologist and neurologist, respectively, in order to exclude major disorders and especially neurological problems. Psychiatric symptoms were screened by an experienced psychiatrist using the Structured Clinical Interview for DSM-IV, Non-Patient Version (SCID-NP). All participants were Chinese Han people and right-handed.
Prior to entry into the study, each participant provided written informed consent after receiving a complete description of the study. This research was approved by the Institutional Review Board of Kunming Medical College, Yunnan Province, China (ClinicalTrials.gov: NCT00703742).
Scales and clinical features of SLE patients
Data on sex and age at disease onset and disease duration were collected for each patient. Disease duration was defined as the period from the initial manifestation that was clearly attributable to SLE until the day of MRI scanning. All clinical manifestations and laboratory test findings were recorded according to the ACR criteria11. Disease activity was measured by the SLE Disease Activity Index (SLEDAI), and cumulative SLE-related damage was determined by the Systemic Lupus International Collaborating Clinics/ACR Damage Index for SLE (SLICC/ACR-DI)12 in all patients at the time of the MRI. Active disease was determined when SLEDAI scores were > 813.
Data on the total dose of corticosteroids (COR) and immunosuppressors used between the time of drug initiation and the study date were collected by patient interview. The cumulative dose of the immunosuppressor used was calculated by summing the daily dosages and multiplying by the days of treatment. Total doses of oral and intravenous COR were calculated by converting to equivalent doses of prednisone.
A complete neurological examination was applied to all patients in order to exclude major neurological problem, such as stroke and seizures. Obvious disorganized behavior and psychiatric symptoms, such as illusion and delusion, might imply possible serious involvement of the brain. Therefore, patients with these symptoms were also excluded. Mood disorders and cognitive disorders were not excluded because they are traditionally thought of as minor functional disorders of the brain and might have different pathologies from other prominent CNS diseases5. Depressive symptoms were assessed with the 17-item Hamilton Depression Scale (HAMD)14; scores ≥ 17 were considered as depression. Anxiety was evaluated through the Hamilton Anxiety Scale (HAMA)15; scores ≥ 14 were considered as anxiety. Other psychiatric symptoms were screened by an experienced psychiatrist via the Structured Clinical Interview for DSM-IV (SCID). The Mini Mental State Examination (MMSE)16 was used to screen for cognitive impairment. Scores ≤ 24 were considered as indicating obvious cognitive impairment. All participants were right-handed, as assessed by the Edinburgh Handed Inventory17. All scales were evaluated on MRI examination days by an experienced psychiatrist.
Image acquisition
All image acquisitions were performed by one experienced neuroradiologist. MRI sequences were performed on all subjects with a 1.5-T clinical GE MRI scanner (Twinspeed; GE, Milwaukee, WI, USA) equipped with a birdcage head coil. Restraining pads were used to minimize head motion. A rapid sagittal localizer scan was acquired to confirm alignment. Normal T1 and T2 MRI scans were taken to exclude obvious structural abnormalities. A set of 3-dimensional volumetric structural MRI scans were taken on each subject using a fast spoiled-gradient echo sequence (FSPGR) with the following settings: TR/TE 10.5/2 ms, matrix size 256 × 256, thickness 1.8 mm with no interslice gap, field of view 240 mm, flip angle 90°, and scan time 14 min 06 s. The whole-brain data were acquired in axial planes parallel to the anterior commissure-posterior commissure line, including 172 continuous slices that were 0.9 mm in thickness.
Data preprocessing and VBM statistical analysis
Dicom image data were processed using MRIcro software (version 1.40; http://www.mricro.com). All data were analyzed via statistical parametric mapping (SPM2; Wellcome Department of Cognitive Neurology, London, UK; http://www.fil.ion.ucl.ac.uk/) software based on Matlab 7.1 (The MathWorks, Inc. Natick, MA, USA). Each individual image was normalized and transformed into the standardized Montreal Neurological Institute template, then resampled at the 2 × 2 × 2 mm dimensional scale. Normalized images were then segmented into gray matter (GM), white matter (WM), and cerebrospinal fluid. Separated WM images were smoothed to remove noise at 12 mm of the half-width at half-maximum. The smoothed WM images were submitted to VBM analysis using in-built SPM2 procedures. Comparisons of WM volumes between the 2 groups were made by 2-group t tests. The result was set as statistically significant at a lower threshold of voxel-wise uncorrected p < 0.001, with 10 continuous voxels.
Mean value analysis of WM volume for ROI in significantly different clusters
The advantage of the VBM method is that it can detect an abnormal volume of the whole brain. However, identifying the relationship between disease characteristics and volume loss is difficult with this method. Therefore, we combined VBM and ROI methods to clarify the relationship between WM volume loss and disease characteristics. Initially, we used the significant clusters identified through VBM as the ROI. These ROI were then made into masks to calculate regional WM volume. Finally, using the normalized WM images from each participant, the mean WM volume for each ROI was retrieved. With these methods, we were able to obtain more precise and objective ROI, avoiding the individual variability that is inherent to manually derived ROI. Two-sample t tests were then performed to analyze differences in mean WM volume for each ROI between the 2 groups, using version 13.0 of the Statistical Software Package for the Social Sciences (SPSS Inc., Chicago, IL, USA). Correlation and partial correlation methods were used to analyze the correlation between disease characteristics and the WM volume of clusters. Covariance analysis was performed to detect the effect of different therapies on WM volume, when age and SLEDAI score were controlled. Finally, we used 2-sample t tests to determine if there were any differences in WM volume between patients with cognitive/depressive/anxiety symptoms and patients without these symptoms.
RESULTS
Demographic data
Of the 46 SLE patients to receive MRI scans, 4 were excluded due to structural abnormities of the brain, identified by common T1 and T2 weighted MRI (1 local infarction, 2 ischemia, 1 for a WM hyperintense signal near the caudate nucleus). Data from the remaining 42 patients were included in this study. Three subjects from the HC group were also excluded due to local ischemia. In all, 42 subjects were included from each of the SLE and HC groups.
Both groups included 36 women and 6 men. The mean age was 29.48 years (SD 7.35, range 18–43 yrs) for SLE patients and 29.79 years (SD 6.95, range 18–45) for HC. There were no significant differences in age or sex between these 2 groups (Table 1).
Demographic and clinical characteristics of SLE patients and healthy controls.
Clinical, laboratory, and treatment features
Disease duration in SLE patients ranged from 0.5 to 72 months (mean 21.37, SD 21.18 mo). Fifteen patients were diagnosed as having newly diagnosed SLE and 20 patients had disease durations that were not more than 12 months. The other 22 patients had disease durations of 13–72 months. According to the SLEDAI score, 19 of 42 (45.24%) patients were in an active stage of lupus at the time of MRI scans, with a mean SLEDAI score of 14.26 (n = 19, SD 4.48, range 9–26). The mean SLEDAI score for inactive patients was 4.30 (n = 23, SD 3.04, range 0–8). Of the 42 SLE patients, 10 were positive for antiphospholipid antibodies (aPL) and 15 were found to have obvious cognitive deficit. Seventeen patients had depression and 13 had anxiety (Table 1). According to the SLICC, 4 patients had a score of 1 (2 cases had protein-uria > 3.5 g/24 h and 2 had cutaneous small-vessel vasculitis in a terminal finger or minor tissue loss). The remaining 38 patients were without serious organic impairment; their SLICC score was 0. The mean SLICC score for all patients was 0.143 (SD 0.354, range 0–1). Of the 42 patients, 25 were treated with immunosuppressors [cyclophosphamide (CTX), hydroxychloroquine (HCQ), or both]. Another 17 patients were never treated with immunosuppressors.
WM volume differences between SLE and HC groups
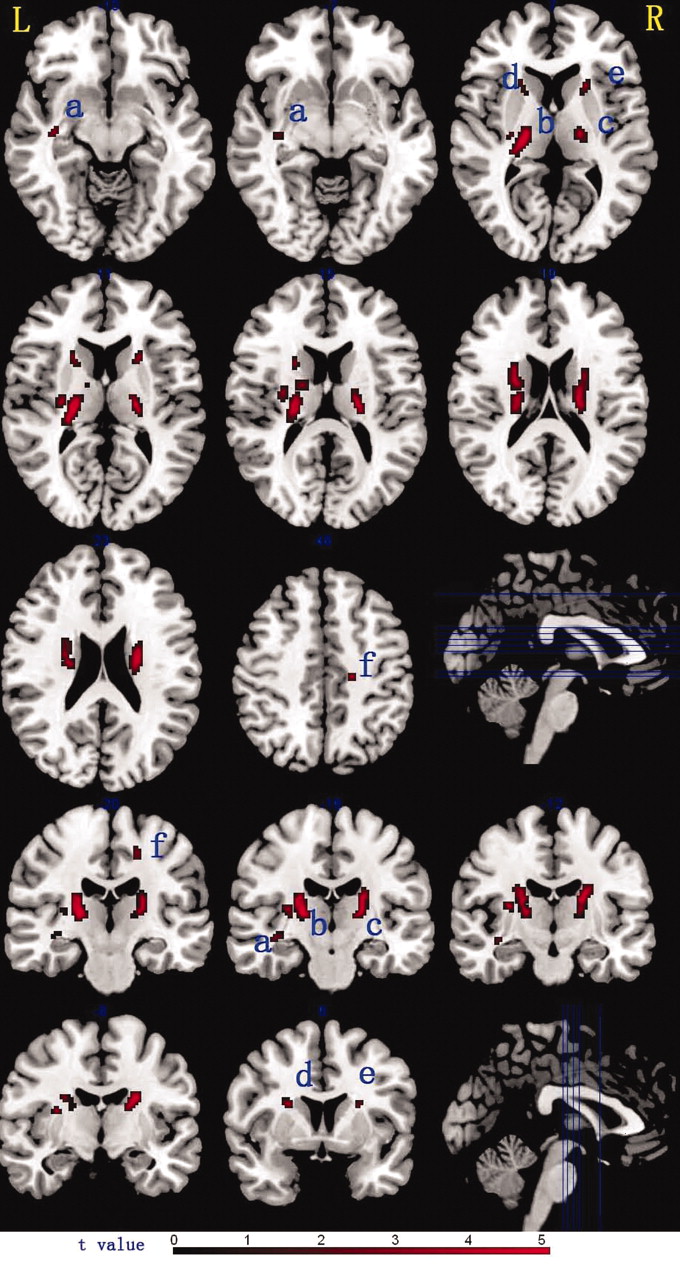
With the VBM analyses, several WM regions in the SLE group were found to have significantly decreased volumes, compared with the HC group (p < 0.001, uncorrected; cluster size > 10 voxels). In the SLE group, clusters having decreased WM volumes were found bilaterally in the posterior crus of the internal capsule (PIC), the anterior crus of the internal capsule (AIC), the subgyral postcentral gyrus in the right frontal lobe, and the left parahippocampal gyrus in the temporal lobe. Clusters with decreased WM volumes in the bilateral internal capsule were very close to the thalamus, midbrain, and subthalamus (Table 2, Figure 1). No areas having an increased WM volume were found in the patient group, compared with the HC group.

Clusters with significant difference of WM volume in SLE patients and healthy controls. Rows 1, 2, and 3 display the significant clusters on a normal T1 template at the axial plane; rows 4 and 5 display the coronal plane. L: left brain; R: right brain; a: left temporal lobe; b: left posterior crus of internal capsule; c: right posterior crus of internal capsule; d: left anterior crus of internal capsule; e: right anterior crus of internal capsule; f: right frontal lobe.
Clusters of significant decreased white-matter (WM) volume in 42 patients with SLE.
The WM volume of the whole brain and 6 ROI (6 significant clusters obtained by SPM2 results, Table 2, Figure 1) were then compared between SLE patients and HC. The WM volumes for 6 ROI were significantly decreased in the SLE group, compared with the HC group (Figure 2). WM volumes of patients with short (≤ 12 months, n = 20, 47.6%) or long (> 12 months, n = 22, 52.4%) disease duration were also compared. There was no significant difference in WM volume among all 6 regions between the short and long duration groups (p > 0.05; Table 3).

Differences of WM volume between SLE patients and healthy controls (HC) in the whole brain and 6 regions. WM volume of SLE patients was lower than controls in the bilateral internal capsule, left temporal lobe, and right frontal lobe. LAIC: left anterior crus of internal capsule; RAIC: right anterior crus of internal capsule; LPIC: left posterior crus of internal capsule; RPIC: right posterior crus of internal capsule; LTEM: left temporal lobe, RFRO: right frontal lobe. ** p < 0.01.
White-matter volume difference between patients with different duration of disease.
Association between WM volume and symptomatic severity
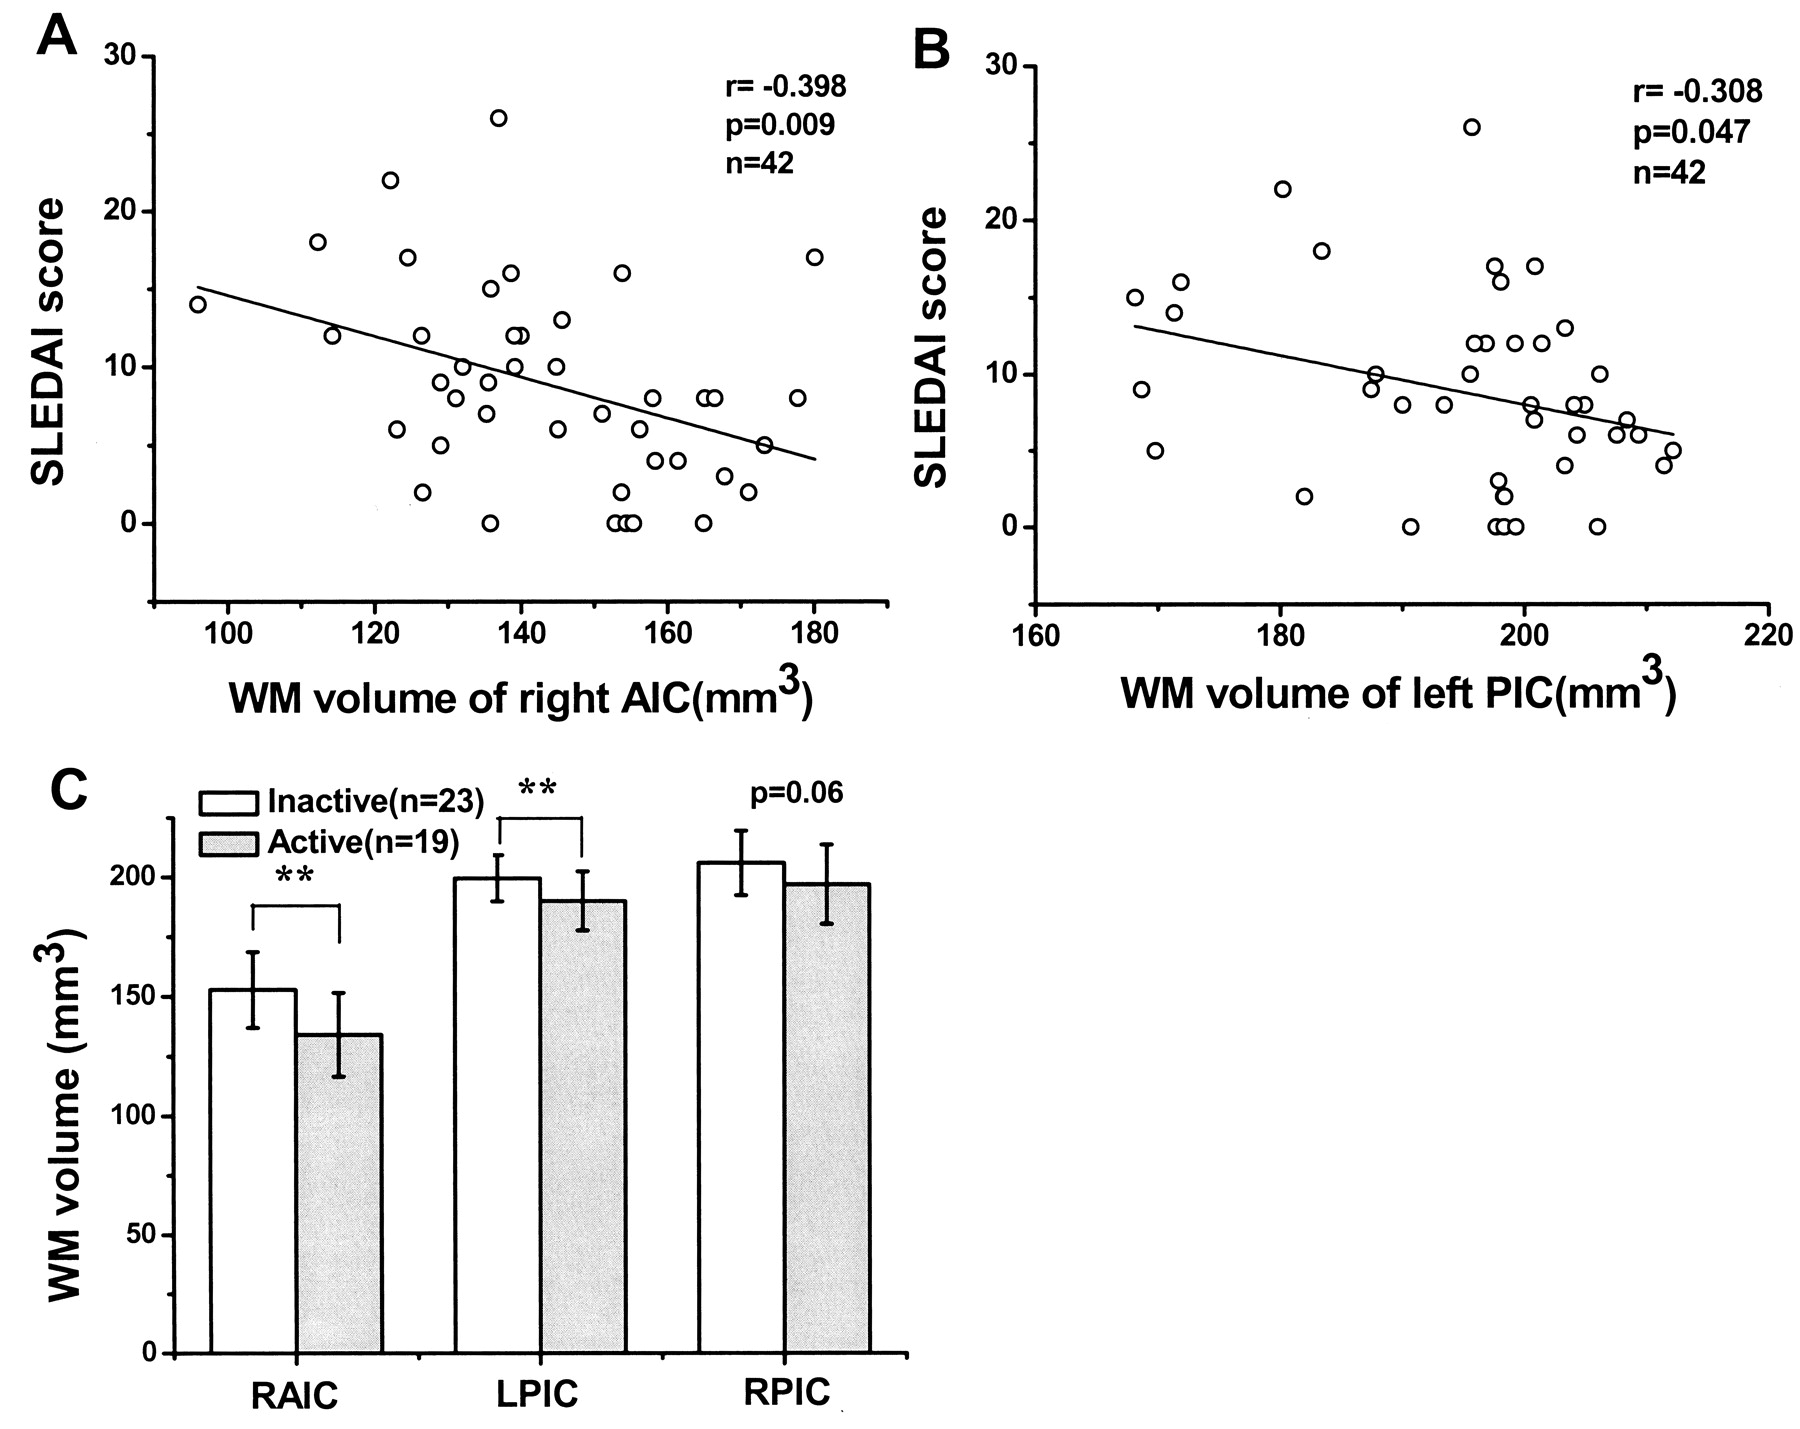
We then attempted to identify the relationship between WM volume loss and disease characteristics. In all 42 patients, negative correlations were found between the total SLEDAI score and regional WM volume for the right AIC (RAIC; Figure 3A) and left PIC (LPIC; Figure 3B). Considering the possible influence of age on WM, we carried out a partial correlation, using age as a control variable, to assess the correlation between severity and WM volume. The results demonstrated that the negative correlations between the total SLEDAI score and regional WM volume for the RAIC and LPIC still existed (r = −0.431, p = 0.005 for RAIC; and r = −0.329, p = 0.036 for LPIC). Consistent with these correlation results, the WM volumes of the RAIC and LPIC were decreased in patients that were in an active disease stage, compared to patients in an inactive stage (Figure 3C).

Correlation between WM volume of right/left anterior crus of internal capsule (RAIC/LPIC) and severity and activity of disease. WM volume of RAIC (panel A) and left posterior crus of internal capsule (LPIC; B) were negatively correlated with patients’ SLEDAI score. C. WM volumes of patients with active disease were lower than patients with inactive disease in the RAIC and LPIC. **p < 0.01.
Among all 42 patients, 10 patients were aPL-positive (23.8%). WM volumes of 6 clusters between aPL-positive and aPL-negative patients were compared. We found no significant difference in the WM volume of 6 clusters between the 2 patient groups.
WM volume differences of patients receiving different therapies
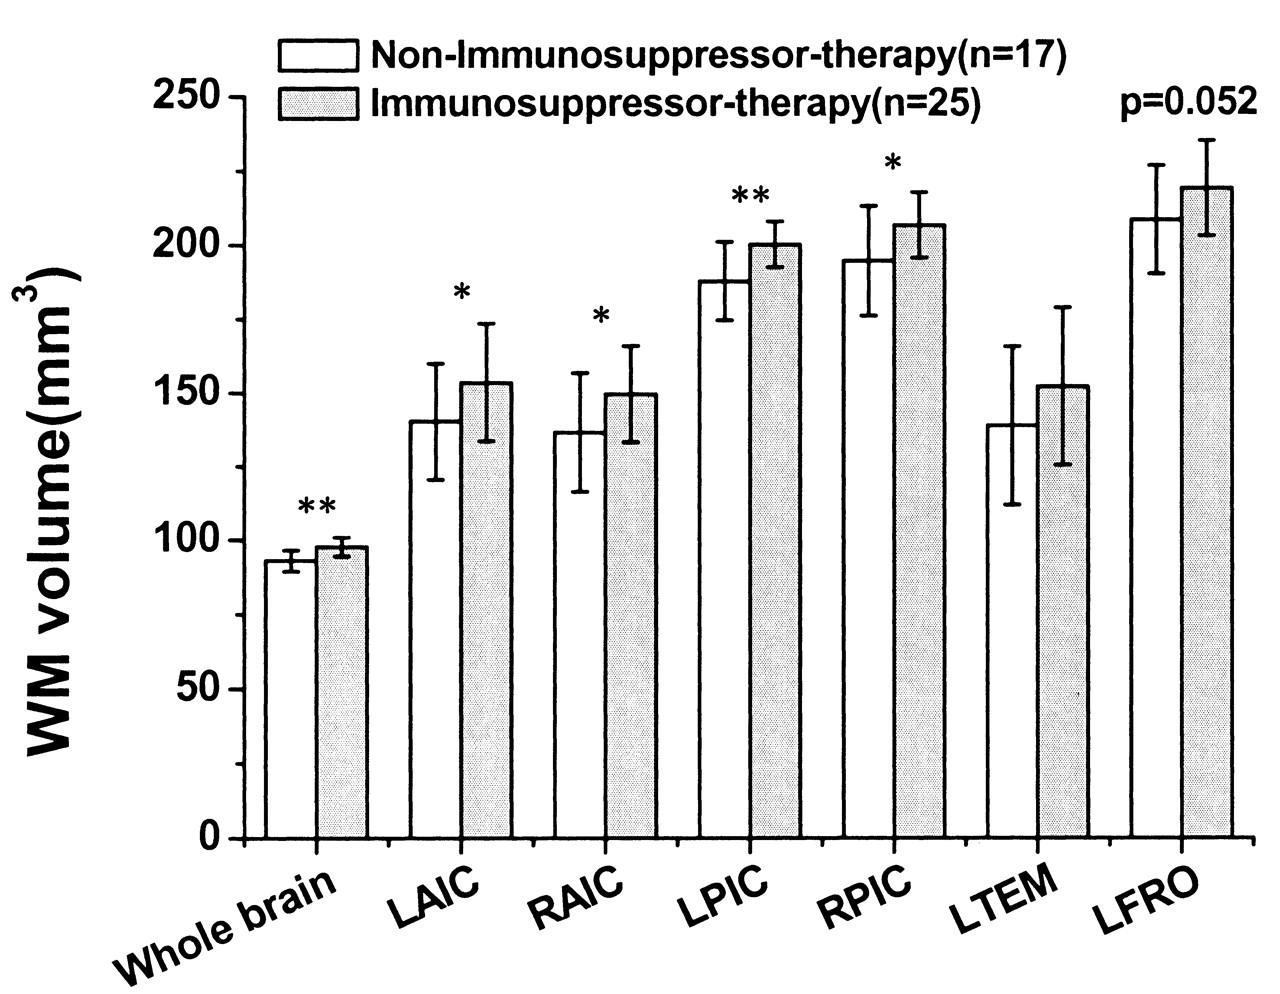
The possible effect of therapy on brain structure was then considered by comparing the mean WM volume of patients receiving different treatments. According to treatment, 42 patients were divided into 2 groups, one treated with immunosuppressors (HCQ, CTX, or both), and another group never treated with immunosuppressors. Patients who had been treated with immunosuppressors had greater whole-brain WM and bilateral internal capsule volumes than patients that were never treated with immunosuppressors (Figure 4).

WM volume difference between patients who received immunosuppressor therapy and those who did not. Patients treated with immunosuppressor had higher WM volumes of whole brain and bilateral internal capsule. LAIC: left anterior crus of internal capsule; RAIC: right anterior crus of internal capsule; LPIC: left posterior crus of internal capsule; RPIC: right posterior crus of internal capsule; LTEM: left temporal lobe, RFRO: right frontal lobe. * p < 0.05; ** p < 0.01.
We then investigated the exact effects of the different therapies. Among all 42 patients, 7 were untreated, 10 received corticosteroids (COR) only, 10 received COR plus CTX (COR + CTX), 14 COR plus HCQ (COR + HCQ), and one patient received COR, CTX and HCQ. This last patient was excluded, as the classification was difficult. Thus, the 41 patients were divided into 4 groups to further discriminate the effect of the different therapies on WM volume. The 4 groups were: untreated (NT), COR, COR + CTX, and COR + HCQ. Considering the possible influence of age and severity of SLE on WM volume, we used age and SLEDAI score as control factors to perform the covariance analysis. The results showed that the intergroup difference in WM volume of the whole brain and LPIC was significant (between-group p = 0.001 for whole brain and p = 0.028 for LPIC; Table 4). The results of a pairwise-group comparison showed that untreated patients had the lowest whole-brain WM volumes. COR + CTX and COR + HCQ treated patients had significantly greater WM volumes, compared with untreated patients (Figure 5). In addition, the WM volumes of COR + CTX and COR + HCQ treated patients were greater than those of the COR treated group. There was no significant difference in WM volume between COR + CTX treated and COR + HCQ treated groups. The WM volume difference between the untreated and COR treated groups also was not significant. In addition, when the SLEDAI score was controlled, partial correlation analyses showed there were no significant correlations between the total COR dose and the WM volume (Table 5).

WM volume differences between patients who received different therapies. When age and SLEDAI scores were controlled as covariants, WM volumes of whole brain of untreated patients were significantly lower than those of patients treated with corticosteroid plus cyclophosphamide/hydroxychloroquine (COR + CTX/HCQ). WM volumes of patients treated with COR only were lower than those of patients treated with COR + CTX/HCQ. But there were no significant differences of WM volume between untreated patients and COR-treated patients. There were no significant differences of WM volume between patients treated with COR + CTX and with COR + HCQ. NT: untreated patients. *p < 0.05, ** p < 0.01.
ANCOVA results of the white-matter (WM) volume of patients who received different medications; age and SLEDAI score controlled as covariants.
Partial correlation between total dose of corticosteroids and white-matter volume.
WM volume of patients with cognitive impairment or mood disorder
There were significantly lower mean scores on the MMSE but higher mean scores of the HAMD and HAMA scales for the SLE group compared with the HC group (Table 1). In all 42 patients, 15 had obvious cognitive impairment, with MMSE scores ≤ 24. However, the WM volumes of patients with or without obvious cognitive impairment showed no significant differences (2-sample t test, Table 6). Similarly, there was no significant difference in WM volumes between patients with and those without obvious depression/anxiety (2-sample t test, Tables 7 and 8). When age and SLEDAI score were controlled, there were no significant correlations between WM volume and MMSE, HAMD, and HAMA scores (Table 9).
White-matter volume difference between patients with and without obvious cognitive impairment.
White-matter volume difference between patients with and without depression.
White-matter volume difference between patients with and without anxiety.
Partial correlation between score of scales and white-matter volume.
DISCUSSION
Brain atrophy has long been reported in SLE using neuroimaging techniques9. Patients with CNS symptoms seem to have more significantly reduced corpus callosum and cerebral volumes compared with SLE patients without CNS symptoms18. Brain atrophy and white matter hyperintense lesions often correlate with clinical manifestations, even in patients without clear CNS signs and symptoms19. However, although MRI is considered a good method for evaluation of CNS manifestations in SLE, conventional or anatomical MRI findings are often nonspecific or negative20 in patients with or without NPSLE. Many patients with only mood or cognitive disorders have been identified as normal according to conventional MRI. There has been evidence that abnormal WM microstructures may be found in non-NPSLE patients or patients with apparently normal brain structure21. Subclinical CNS involvement was also reported in juvenile SLE22. It is thus possible that microstructural abnormalities may occur even before obvious clinical manifestations appear. Although important for the clinical evaluation, the discrimination of mild structural abnormalities in these patients is difficult. Recently, new techniques and analytical methods for MRI, such as VBM methods, have been used to objectively localize focal gray or white-matter volume changes throughout the brain23–25. Using VBM methods, mild brain structural abnormalities have been reported in SLE patients26. In a VBM study, the significant loss of brain tissue volume was reported to be associated with disease duration, corticosteroid use, presence of aPL, and cognitive impairment in SLE27.
In our study, a clear reduction of WM volume was found in patients with SLE, despite identification as normal by conventional MRI. Patients in our study were without major CNS manifestations or disease, although the WM volume loss implied that brain damage had emerged even before clear clinical neurological symptoms presented. Consistent with previous magnetic resonance spectroscopy studies, these results confirmed that the abnormal microstructural changes may occur before the appearance of any clear CNS symptoms and conventional imaging signs21. These results indicate that greater attention must be paid to the involvement of CNS in SLE. On the other hand, many SLE patients in this study were newly diagnosed or had relatively short disease duration (< 12 months) and the WM volume reductions were almost the same between the patients with short and those with long disease duration, indicating the brain damage early in the disease course. These findings were consistent with previous reports and suggested that the brain might be affected extremely early in the course of SLE, even before the clinical diagnosis of SLE was made28. Studies suggest that patients with neuropsychiatric symptoms caused by active CNS-SLE can be differentiated from patients with the same symptoms caused by residual disease through quantitative MRI techniques9. Thus, our findings also highlight the value of quantitative volumetric MRI in detecting minor WM volume reductions. This may aid in predicting NPSLE and identifying cumulative injuries of SLE.
Regions with significant WM volume reduction were found in several brain areas, including the PIC and AIC, in our patient group. These regions are adjacent to the thalamus, midbrain, and subthalamus. Moreover, WM in these regions connects the cortex with the thalamus and midbrain. As is commonly known, thalamus and basal ganglia play critical roles in regulating the processing of motion, perception, emotion, and memory29. In addition, many neurotransmitters, including serotonin, dopamine, and norepinephrine, are synthesized in midbrain nuclei30. These neurotransmitters play important roles in regulating emotional and cognitive functions via the widely distributed fiber projections that innervate nearly the entire brain. Neurohormones originating from subthalamic nuclei can regulate hormone secretion for the entire body. A WM deficit in these areas may induce severe dysfunctions in neurotransmission and neurosecretion. WM volume loss in these areas may account for the extensive but varied neuropsychiatric manifestations and endocrine secretion dysfunctions in SLE. In our study, the WM volume of the LPIC and RAIC were negatively correlated with SLEDAI scores. Patients in active-stage SLE had a greater decrease in WM volume in these 2 regions, compared with patients in an inactive stage. The negative association between symptom activity and abnormal WM volume reflects the parallel damage of SLE and WM deficits. One possible explanation for these results is significant vasculopathy in the active stage. Therefore, it is possible to predict the potential NPSLE in the disease process via imaging technology. WM volume loss may become an indicator for the disease activity.
The temporal and frontal lobe also showed reduced WM volumes in this study, particularly for WM near the post-central gyrus and parahippocampal gyrus. These 2 areas are generally thought to relate closely to memory and cognitive and execution functions. Mood disorders and cognitive symptoms, including memory deficit, are common in SLE31–33. Magnetic resonance spectroscopy research has revealed that changes in neurometabolic measurements in cerebral WM may be related to the subtle cognitive impairment in SLE, even in the absence of neuropsychiatric symptoms21. The significantly lower MMSE scores but higher HAMD and HAMA scores for the SLE group might imply the general cognitive impairment and mood disorder in SLE. Regions with WM deficits identified in our study may become the pathological foundation for widespread cognitive and mood disorders in patients with SLE. As we could find no direct correlations between regional WM volume and severity of cognitive impairment (depression/anxiety), it seems possible that the relationship between reduction of WM volume and cognitive impairment/mood disorder might be nonlinear. These symptoms might emerge once there was sufficient reduction of WM volume.
It remains unclear whether the neuropsychiatric signs and symptoms of SLE are secondary manifestations of widespread organ dysfunction or if the CNS is a primary target organ of autoimmune dysfunction in lupus. Because the major pathological abnormality in lupus is nephritis, some studies suggest that the neurological manifestations are actually a secondary consequence of uremia or inflammatory changes, as well as the increased permeability of the blood-brain barrier34. However, other evidence supports primary CNS involvement in lupus34–36 and brain abnormalities can be found even in patients with newly diagnosed SLE28. Although neuronal apoptosis and loss of brain volume may both be included in the neuropathology of SLE37, abnormal behavior may clearly be seen before visible pathological changes are clinically identified. It has been reported that the mood and cognitive deficits prevalent in lupus patients may not reliably correlate with measurements of active disease and disease involvement of other organs or systems38. Animal studies have shown that lupus mice develop depression and CNS dysfunction very early in the disease course, in the absence of substantial pathology involving other target organs34. These results suggest that the brain involvement in SLE might be independent of the disease in other organs and may occur during early stages of the disease. This possibility strengthens the importance of identifying structural abnormalities as early as possible, to facilitate early intervention and improve treatment outcome. Owing to the gradual pathological development of brain atrophy, it remains possible that even SLE patients having apparently normal MRI results may have mild structural atrophy.
We also observed that patients treated with immunosuppressors tended to have increased mean whole-brain WM volumes, compared with patients who were never treated with immunosuppressors. This finding suggests a protective role of immunosuppressors in preventing WM atrophy. Several studies support using CTX in the treatment of NPSLE39. The potential neuroprotective effect of CTX has been identified in SLE40 and other white-matter demyelinating diseases, such as antiphospholipid syndrome41 and experimental autoimmune gray-matter disease42. A possible mechanism for the neuroprotective effect of immunosuppressors may be reduced demyelination due to vasculitis. However, a prospective study would be needed to elucidate the advantages and disadvantages of longterm immunosuppressive therapy. Our results also support that the protective effect might come mainly from the immunosuppressors, rather than solely from corticosteroids.
The WM volume loss may originate from the WM atrophy previously described in SLE8,43,44. However, the exact mechanism of WM atrophy in SLE remains unclear. The WM hyperintensity in SLE, revealed through longitudinal research, may become progressive over time in patients with severe SLE45 and may be caused by the neurotoxic effect of the chronic disease. Possible explanations for the atrophy include the following. (1) Neurodegenerative changes due to axonal damage that is primary or secondary to the vasculopathy in SLE. The thalamus and basal ganglia are supplied by terminals of the cerebral artery. Because of the reduced collateral circulation in these regions, they may be easily affected over the time of an inflammatory immune response. (2) Some antibodies, such as aPL45, are reportedly related to nervous system damage, such as that in NPSLE46. (3) Activation of a cytokine network has been observed in SLE patients with CNS complications, independent of the pathological process, and suggests a neurotoxic effect of cytokines in SLE47. (4) Damage of the brain endothelium causes damage to the blood-brain barrier, which normally restricts entry of plasma constituents, including proteins48. (5) Demyelination originates from decreased levels of serum brain-derived neurotrophic factor in patients49.
The role of antibodies in the pathophysiology of SLE has been vigorously discussed. aPL was focused on for a long time in SLE50 and was reported to be associated with neuropsychiatric manifestations51 and brain abnormalities52. As phospholipids are the main constituent of WM, we focused especially on aPL. However, we failed to identify the precise association between aPL and WM volume. Considering the relatively small sample of aPL-positive patients in our study, it will be valuable to examine the relationship of WM deficit and aPL in larger samples in the future. However, our results did not exclude the potential role of other antibodies in damaging the CNS. Other antibodies, such as antineuronal53,54 and anti-NR2 antibodies55, have been reportedly related to the CNS manifestations in SLE. Yet negative results have also been reported56,57. Precise and prospective cohort studies of the association between these antibodies and brain damage, including both gray matter and white matter, would be necessary.
MRI is considered a useful tool in evaluating involvement of the CNS in SLE19,58. Our study has provided evidence for white-matter atrophy in SLE, even preceding the emergence of a clear neurological manifestation. These findings support the value of high-resolution quantitative MRI for detection of subtle structural abnormalities and the effect of treatment in SLE patients with apparently normal MRI findings. Our results also account for brain involvement as a primary deficit in SLE and suggest the neuroprotective effect of immunosuppressive therapy in attenuating white-matter atrophy. Therefore, early immunosuppressive therapy may be important for preventing progressive white-matter atrophy.
Acknowledgments
We thank Haihong Liu, Yihui Hao, and Zhening Liu, Mental Health Institute, the 2nd Hospital of Xiangya Medical College, Central South University, for assistance in MRI data analysis. We thank Aiyun Lai and Daying Feng, Department of Rheumatology and Immunology, First Affiliated Hospital of Kunming Medical College, for recruiting the volunteers. We thank Chonghua Wan, Department of Statistics, Kunming Medical College, for assistance in the statistical analysis. We thank Hong Luo, Department of English, Yunnan University, for assistance in language composition.
Footnotes
-
Supported by grants from United Funding of Yunnan Provincial Science and Technology Department and Kunming Medical College (2008C0005R to XFX), the National Natural Science Foundation of China (30530250 to LX and 30500150 to JC), the Science and Technology Foundation of Yunnan Province (2006PT08 to LX), and the 973 Program from the Ministry of Science and Technology of China (2006CB500808 and 2009CB941300 to LX; 2007CB512303 and 2009CB522006 to JC).
- Accepted for publication December 11, 2009.


