

Abstract
Objective. To investigate the role of thrombospondin 1 (TSP-1) in RA.
Methods. Expression of TSP-1 in synovial tissues was determined by immunohistochemistry. Expression of TSP-1 in rheumatoid fibroblast-like synovial cells (FLS) was investigated by quantitative real-time PCR and ELISA. Correlations among the plasma TSP-1 and other variables in patients with RA were examined.
Results. Expression of TSP-1 was increased in rheumatoid synovial tissues. Transforming growth factor-β1 (TGF-β1) clearly increased TSP-1 expression in FLS on both mRNA and protein levels. Changes in plasma TSP-1 were associated with those in 28-joint Disease Activity Score-erythrocyte sedimentation rate and plasma TGF-β1.
Conclusion. TSP-1 might be critically involved in the disease process of RA through the TGF-β1/TSP-1 axis.
- RHEUMATOID ARTHRITIS
- FIBROBLAST-LIKE SYNOVIAL CELL
- SYNOVITIS
- THROMBOSPONDIN 1
- TRANSFORMING GROWTH FACTOR-Β1
- BIOMARKER
Our recent investigations using circulating immune complexes (CIC) analysis revealed that CIC-associated thrombospondin 1 (TSP-1) is frequently found in the serum of rheumatoid arthritis (RA), but not in other rheumatic diseases and healthy controls1. TSP-1 is a multifunctional glycoprotein expressed in cells from multiple lineages2. Although the role of TSP-1 in inflammation remains obscure, studies have shown that TSP-1 acts as a proinflammatory protein. For example, TSP-1 binds to specific receptors on polymorphonuclear leukocytes and stimulates their motility3. One study showed that TSP-1 activates the macrophages through the Toll-like receptor 4 pathway4.
In our present study, to establish the role of TSP-1 in RA both in vitro and in clinical practice, we used 3 approaches. First, we investigated the expression of TSP-1 in synovial tissues. Second, we investigated whether the expression of TSP-1 in fibroblast-like synovial cells (FLS) from patients with RA was influenced by cytokines and growth factors. Finally, we analyzed the correlation between plasma levels of TSP-1 and clinical variables of RA. By using these approaches, we show that TSP-1 is, at least in part, associated with the pathogenesis of RA.
MATERIALS AND METHODS
Each patient provided a signed consent form to participate in our study, which was approved by the Institutional Review Board of Nagasaki University. All patients with RA fulfilled the classification criteria for RA5. We obtained synovial tissues from patients with RA or osteoarthritis (OA) at the time of orthopedic surgery. FLS from patients with RA were isolated from synovial tissues as described previously6.
Reagents and stimulation assays
FLS were stimulated for 24 h with transforming growth factor-β1 (TGF-β1; 5 ng/ml), interleukin 1β (IL-1β; 10 ng/ml), IL-6 (100 ng/ml) with soluble IL-6 receptor (100 ng/ml), interferon-γ (IFN-γ; 10 ng/ml, all from R&D Systems), and tumor necrosis factor-α (TNF-α; 100 ng/ml, Millipore). In another subset of stimulation experiments, FLS were stimulated with various concentrations of recombinant TSP-1 (R&D Systems) for various time periods (24, 48, or 96 h).
RNA isolation and quantitative real-time PCR analysis
RNA was isolated with Trizol reagent (Life Technologies) and reverse-transcribed. Quantification of TSP-1 mRNA was performed by SYBR Green Real-Time PCR as previously described7. The following primers were designed: TSP-1 5′-GGA GAC AAA GAC TGG CTT CTG GAC-3′ (forward), 5′-GGC CAC TGC AGG TGA TGA GTA A-3′ (reverse); β-actin 5′-AGC CTC GCC TTT GCC GA-3′ (forward), 5′-CTG GTG CCT GGG GCG-3′ (reverse). Expression of β-actin was used as endogenous control. For relative quantification, the comparative threshold cycle method was used.
Immunohistochemistry
Synovial tissues were stained using the labeled streptavidin-biotin method. We used TSP-1 antibody at 1:25 dilution (Thermo Scientific) or with mouse IgG (Jackson ImmunoResearch Laboratories Inc.) as a negative control. Staining was visualized with diaminobenzidine using a peroxidase substrate kit, and then the area of TSP-1–positive staining was randomly quantified in 1 field per section by an imaging software as we previously described (WinROOF, Mitani Corp.)8.
ELISA
Proteins were detected by ELISA using ELISA kits specific for TSP-1, IL-6, TGF-β1, TNF-α, and vascular endothelial growth factor (VEGF) according to the manufacturer’s instructions (R&D Systems).
Clinical evaluation of the patients with RA
The present study included 16 patients with active RA (detailed characteristics of the patients, as well as additional information concerning the methodology used in these studies, are available upon request from the authors). Disease Activity Score at 28 joints (DAS28)-ESR (erythrocyte sedimentation rate) and plasma or serum concentrations of TSP-1, TGF-β1, IL-6, and VEGF were examined at baseline and after introduction of disease-modifying antirheumatic drugs (DMARD) therapy (from 3 mos to 15 mos).
Statistical analysis
GraphPad Prism software was used for statistical analysis. Normal distribution of the data was confirmed using the Kolmogorov-Smirnov test. For related data, statistical significance was evaluated by Student t test (parametric data) or by Wilcoxon signed-rank test (nonparametric data). Student t test (parametric data) or Mann-Whitney U test (nonparametric) was used for unrelated data. The strength of the correlation was judged by Spearman rank correlation coefficient. All data were expressed as the mean and SD. Values of p < 0.05 were considered statistically significant.
RESULTS
Elevated expression of TSP-1 in RA synovial tissues
Pronounced expression of TSP-1 was found in the synovial lining and sublining layers in RA synovial tissues, but also perivascular areas as compared with that of patients with OA (Figure 1A). The quantification analysis using WinROOF software confirmed these results (Figure 1B).
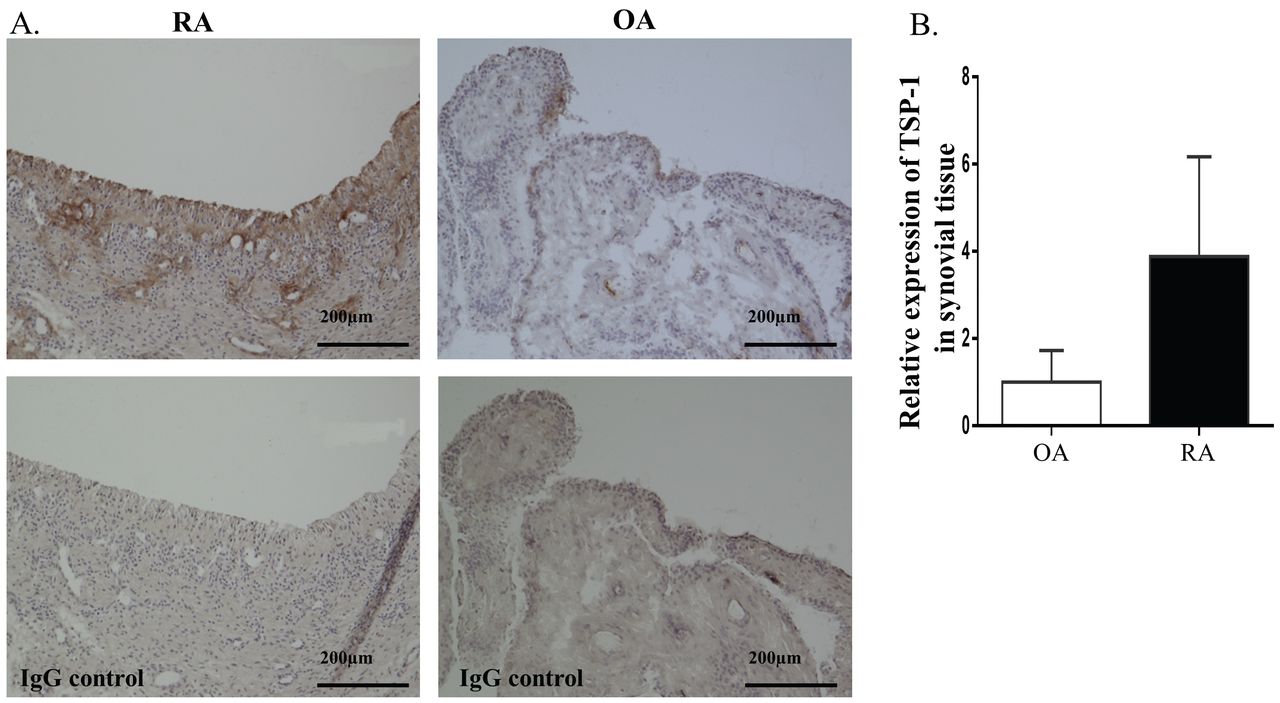
TSP-1 expression in synovial tissues from patients with RA and OA. A. Representative sections of synovial tissues stained for TSP-1 or control IgG. Positive staining of TSP-1 appears as a light brown color. Expression is seen in the synovial lining and sublining layers and perivascular areas. B. The quantification analysis of TSP-1 staining in RA (n = 4) and OA (n = 4) synovial tissues was performed using WinROOF software (Mitani Corp.). Expression of TSP-1 was determined relative to OA synovial tissue, which was defined as 1. Values are presented as the means. TSP-1: thrombospondin 1; RA: rheumatoid arthritis; OA: osteoarthritis; IgG: immunoglobulin G.
TSP-1 production from FLS is induced by TGF-β1
Among inflammatory cytokines and growth factors, TGF-β1 most clearly increased TSP-1 expression in FLS on an mRNA level (Figure 2A). To confirm this, we analyzed the expression of TSP-1 on the protein level after stimulation with TGF-β1 by ELISA (Figure 2B). Similar to mRNA levels, TGF-β1 markedly induced TSP-1 protein, indicating that TGF-β1 stimulates TSP-1 production at both the transcriptional and protein levels. However, other stimuli, including IL-1β, did not induce TSP-1 production at the protein level [representative results for TSP-1 in the culture supernatants of each stimulated FLS were 1.45 pg/ml (TNF-α), 0.97 pg/ml (IL-1β), 2.34 pg/ml (IL-6), 1.38 pg/ml (IFN-γ), 59.73 pg/ml (TGF-β1), and control (3.46 pg/ml)].
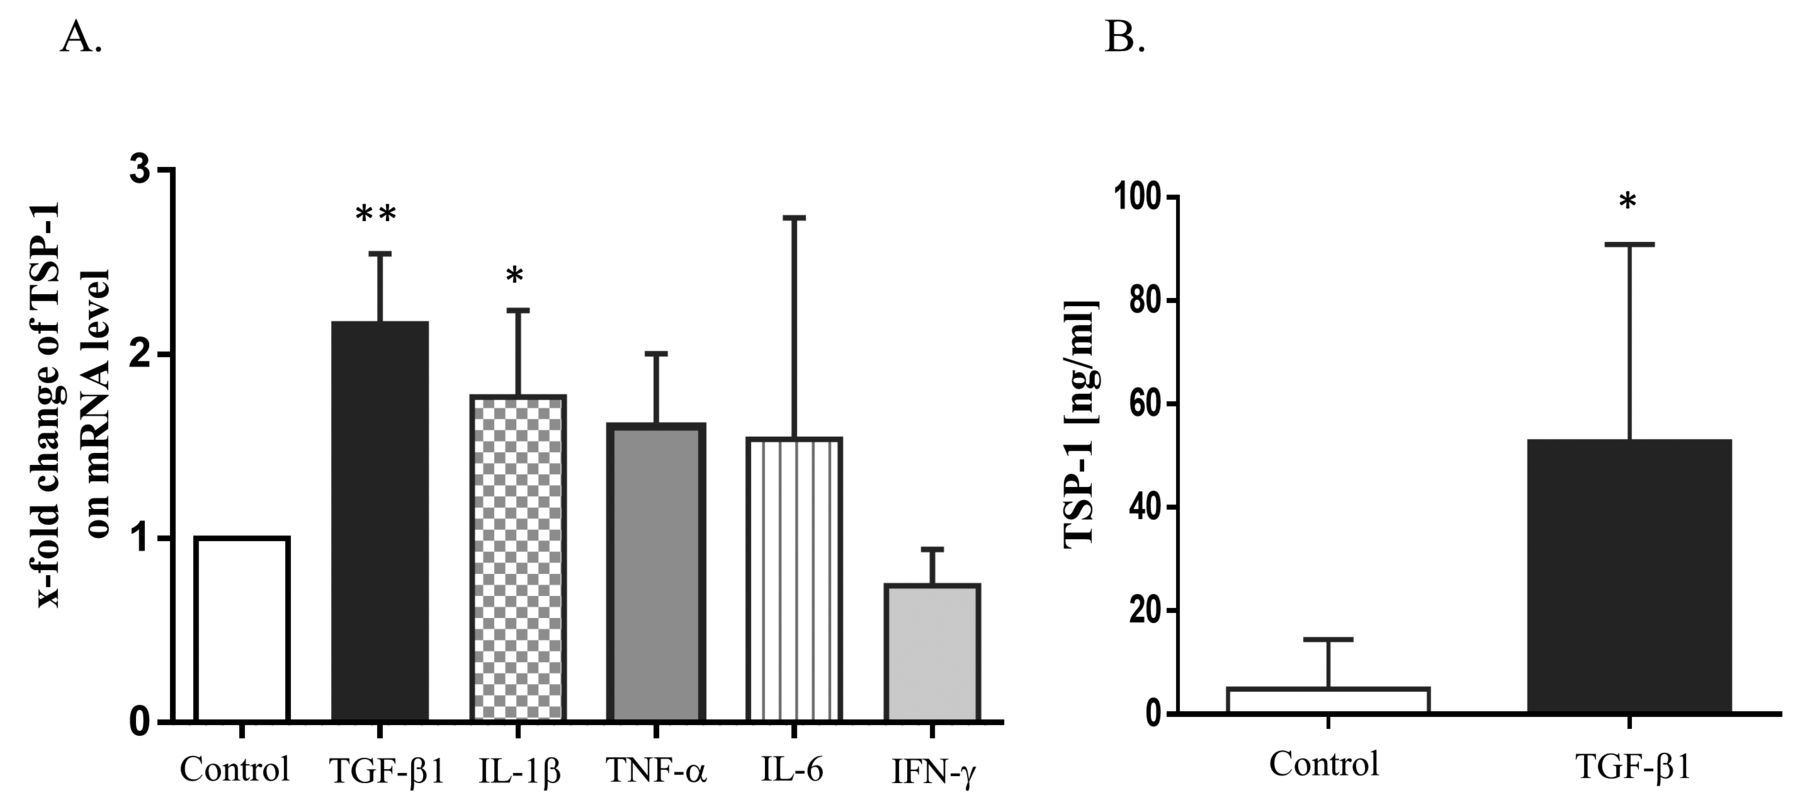
A. Increment of TSP-1 mRNA expression by TGF-β1. RA-FLS (n = 4) was stimulated with TGF-β1 (5 ng/ml), IL-1β (10 ng/ml), IL-6 (100 ng/ml) with soluble IL-6R (100 ng/ml), TNF-α (100 ng/ml), or IFN-γ (10 ng/ml) for 24 h. TSP-1 expression was determined by SYBR Green Real-Time PCR and was stated relative to the control, which was defined as 1. Values are presented as the means ± SD. * p < 0.05. ** p < 0.01 versus the controls (no stimulation). B. Increment of TSP-1 protein production in culture supernatants from RA-FLS by TGF-β1. RA-FLS (n = 6) was stimulated with TGF-β1 (5 ng/ml) for 24 h. TSP-1 protein production in the supernatants was examined by ELISA. Values are presented as the means ± SD. * p < 0.05 versus the controls (no stimulation). TSP-1: thrombospondin 1; TGF-β1: transforming growth factor-β1; RA: rheumatoid arthritis; FLS: fibroblast-like synovial cells; IL-1β: interleukin 1β; TNF-α: tumor necrosis factor-α; IFN-γ: interferon-γ.
TSP-1 did not induce production of TGF-β1, IL-6, or TNF-α
We stimulated FLS with TSP-1 for various time periods (24, 48, 96 h) and at different concentrations. TGF-β1 and TNF-α were not detected after TSP-1 stimulation. IL-6 could be detected, but not increased by TSP-1 [the representative mean values of IL-6 after TSP-1 stimulation (for 24 h) were 105.6 pg/ml (control), 107.0 pg/ml (10 ng/ml), 94.7 pg/ml (100 ng/ml), and 88.0 pg/ml (1000 ng/ml)].
Plasma levels of TSP-1 correlated with disease activity of RA
The following DMARD were used as new treatment in our study: methotrexate (12 patients), salazosulfapyridine (1 patient), etanercept (2 patients), and infliximab (1 patient). Overall, DAS28-ESR and serum VEGF (5.18 ± 1.30 and 724.8 ± 647.1 pg/ml at baseline, respectively) were significantly decreased after introduction of treatment (3.51 ± 2.03, p < 0.05 and 514.3 ± 411.2 pg/ml, p < 0.05), whereas other variables were not changed [Baseline: TSP-1 4.79 ± 5.59 µg/ml, TGF-β1 18.47 ± 8.63 pg/ml, IL-6 17.84 ± 26.01 pg/ml. After induction of new treatment: TSP-1 5.16 ± 5.49 µg/ml (p = 0.86), TGF-β1 15.81 ± 8.21 pg/ml (p = 0.28), IL-6 8.63 ± 12.04 pg/ml (p = 0.25)].
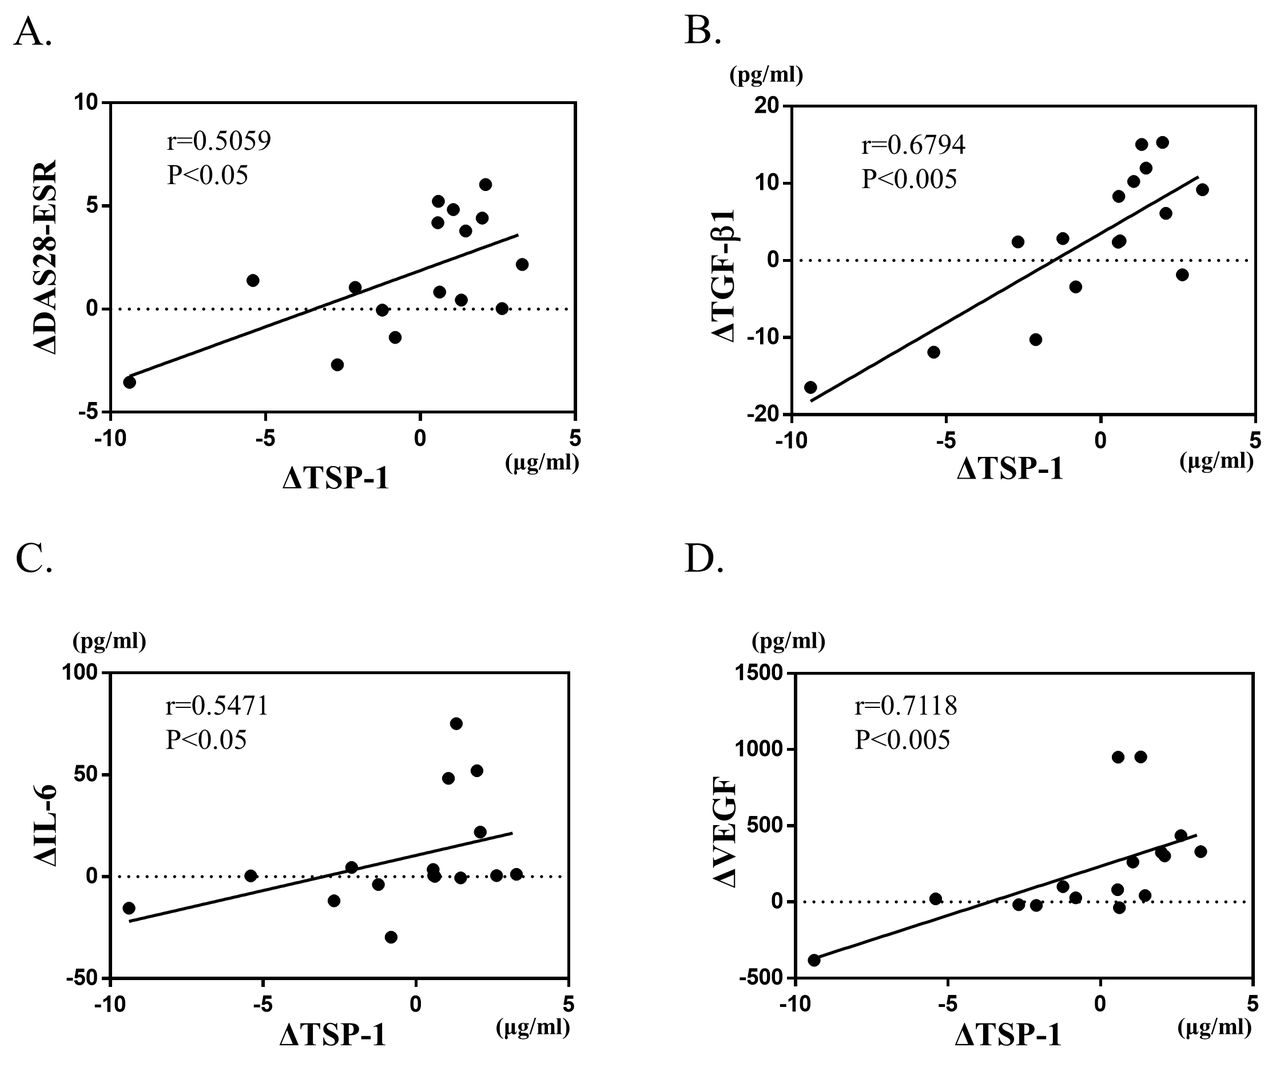
There was large variability in the value of each variable among each case. Therefore, we compared the amount of change. We investigated the correlations between plasma levels of TSP-1 and other variables. The result is shown in Figure 3. The changes (Δ values) in TSP-1 significantly correlated with those in DAS28-ESR. Because it was found in vitro that TGF-β1 stimulates the production of TSP-1 in FLS, there was a clear correlation between the ΔTSP-1 and ΔTGF-β1 during DMARD therapies. Similar correlations were found between TSP-1 and IL-6, and TSP-1 and VEGF.

Correlations between Δ values in plasma TSP-1 and those in (A) DAS28-ESR, (B) plasma TGF-β1, (C) serum IL-6, and (D) serum VEGF after introduction of DMARD therapies (n = 16). The Spearman rank correlation coefficient and the corresponding p value are shown above each scatter plot. TSP-1: thrombospondin 1; DAS28: 28-joint Disease Activity Score; ESR: erythrocyte sedimentation rate; TGF-β1: transforming growth factor-β1; IL-6: interleukin 6; VEGF: vascular endothelial growth factor; DMARD: disease-modifying antirheumatic drugs.
DISCUSSION
In our present study, we found that TSP-1 expression in synovial tissues was much higher in RA than OA. This result is consistent with previous reports9,10. The published data on the effects of TSP-1 in RA and inflammation have diverged11,12. But considering the result that expression of TSP-1 is evident in the lining and sublining layers of rheumatoid synovial tissues where active inflammation is found, TSP-1 might be involved in rheumatoid synovitis.
Here we could show that TGF-β1 significantly augmented TSP-1 synthesis from FLS. This is the first observation to describe the role of TGF-β1 as an activator of TSP-1 in FLS. Although TGF-β1 is known as a paradoxical regulator for inflammation13, TGF-β1 has the competence to inhibit Fas-mediated apoptosis of FLS14, activates the pathway of nuclear factor-κB coordinating with IL-1 and TNF-α, and induces synovial lining hyperplasia15,16. The close interplay between TSP-1 and TGF-β1 has been well established. TSP-1 is known as an activating factor for a latent form of TGF-β117. We have found that production of TSP-1 from FLS is increased by the stimulation of TGF-β1, whereas TSP-1 does not induce production of TGF-β1. Our findings suggested that TSP-1 does not directly act on cytokines and growth factors production. Further studies will be needed to better understand the role of the TGF-β1/TSP-1 axis in RA synovial tissues.
The Δ values of DAS28, plasma TGF-β1, serum IL-6, and VEGF were significantly correlated with Δplasma TSP-1. Although TSP-1 showed no interaction with IL-6 in vitro, Δplasma TSP-1 significantly correlated with Δserum IL-6. It might come from the effect, not through synovial tissues, or it might reflect the disease activity individually. Correlation between Δplasma TSP-1 and ΔDAS28 indicates that TSP-1 may be implicated in active RA disease and could become a novel biomarker of RA, as well as IL-6.
There are some limitations in our study. First, we must refer to the small sample size, especially in clinical evaluations. A larger number of samples would lead to more accurate results. Second, in clinical evaluation, we enrolled only patients with active RA. However, a previous study reported that plasma concentrations of TSP-1 are elevated in patients with RA, compared with healthy controls11. Therefore, we suspected that TSP-1 was particularly involved in the RA pathological condition.
Our study showed that TSP-1, strongly expressed in RA synovial tissues, is induced by TGF-β1. Further, the change of plasma TSP-1 by therapeutic intervention significantly correlated with the changes in disease activity. These findings indicate that TSP-1 might be critically involved in the disease process of RA, and considered as a useful biomarker not only for diagnostic purposes, but also for the evaluation of disease activity.
Footnotes
-
Supported in part by a grant from the Ministry of Health, Labor, and Welfare, Japan.
- Accepted for publication February 24, 2015.


