

Abstract
Objective. To study the role of tumor necrosis factor (TNF)-like weak inducer of apoptosis (TWEAK)/Fn14 and the interferon-inducible protein (IP-10)/CXCR3 axis in lupus nephritis (LN).
Methods. We studied 113 patients with LN who had had repeat renal biopsies. Glomerular and tubulointerstitial messenger RNA expression of TWEAK, Fn14, IP-10, and CXCR3 were quantified.
Results. Glomerular Fn14 expression decreased when changed from proliferative or mixed nephritis to membranous nephropathy (p = 0.016), and increased when changed from membranous to proliferative or mixed nephritis (p = 0.0006). On the other hand, tubulointerstitial TWEAK expression decreased when changed from proliferative or mixed nephritis to membranous nephropathy (p = 0.004), and increased when changed from membranous nephropathy to proliferative nephritis (p = 0.010). Tubulointerstitial IP-10 expression decreased when changed from proliferative or mixed nephritis to membranous nephropathy (p < 0.0001). Histological activity index correlated significantly with the glomerular expression of Fn14 (r = 0.421, p < 0.0001) and tubulointerstitial expression of TWEAK (r = 0.413, p < 0.0001) and IP-10 (r = 0.472, p < 0.0001).
Conclusion. Glomerular Fn14 and tubulointerstitial TWEAK and IP-10 expression appeared to have consistent changes in relation to the histological class of LN and correlated with the histological activity index. Our findings suggest a specific role of these genes in the pathogenesis of LN.
Systemic lupus erythematosus (SLE) is a multisystem autoimmune disease characterized by aberrant cytokine milieu. Although almost all organs in the body can be involved, lupus nephritis (LN) remains the leading cause of morbidity and mortality in SLE. The precise pathogenic mechanisms of SLE and LN, however, are not completely understood. Cytokine aberration is a cardinal phenomenon of LN. Cytokines may be involved not only in the generation of aberrant immune regulation1, but also participate in the local inflammatory processes that ultimately lead to tissue destruction. Unfortunately, most studies have focused on the cytokine profile of peripheral blood in patients with SLE, and the results are often inconsistent2,3. Since specific organ or tissue involvement in SLE probably involves local cytokine aberrations that do not appear in the systemic circulation, a study of the immunopathogenesis should focus on the specific sites of disease involvement.
Tumor necrosis factor (TNF)-like weak inducer of apoptosis (TWEAK) is one of the TNF ligand superfamily members. It mediates important biological effects, including upregulation of multiple chemokines, cytokines and adhesion molecules4, induction of apoptosis5, and enhancement of cell survival6 through its sole receptor, Fn147. Interferon-inducible protein (IP-10; CXCL10) belongs to the CXC family of chemokines. IP-10, together with Mig and their receptor, CXCR3, promotes mesangial cell expansion in proliferative glomerulonephritis8. It has been reported that TWEAK/Fn14 can induce human kidney cells to express IP-10 and promote kidney cell proliferation9. Zhao, et al10 found that kidney disease was significantly less severe in Fn14 knockout mice; kidney immunoglobulin G deposition and cytokine levels, as well as macrophage infiltration, were significantly decreased in Fn14-deficient mice with induced lupus; mice with induced lupus treated with an anti-TWEAK neutralizing antibody had significantly diminished kidney expression of inflammatory cytokines as well as proteinuria. In human SLE, Schwartz, et al11 found that urinary TWEAK levels may be useful as a novel biomarker in LN. In another study, the same group found that high urinary TWEAK levels are indicative of LN, in contrast to SLE patients without nephritis or other healthy and disease control populations, and urinary TWEAK levels reflect renal disease activity in longitudinal followup12. Our previous study showed that there is an increase in intrarenal expression of TWEAK and Fn14, and a decrease in CXCR3 expression13. However, the precise role of TWEAK, Fn14, IP-10, and CXCR3 in the pathogenesis of the individual histological type of LN remains unclear.
In our hospital, it has been the policy for over 20 years to perform renal biopsy before treating renal flares. Although this practice may not be considered necessary by all authorities14,15, it provides an opportunity to examine the intrarenal gene expression in relation to specific histological types of LN.
MATERIALS AND METHODS
Patient selection
We reviewed 118 patients with SLE, each with 2 kidney biopsies, for independent disease flare. For each patient, the 2 biopsies were at least 6 months apart; patients with the second biopsy for routine followup monitoring or resistant disease were excluded. All patients fulfilled the American College of Rheumatology diagnostic criteria for SLE16. We performed chart review to collect clinical data, which included baseline serum creatinine, albumin, urea, proteinuria, complement levels (C3 and C4), anti-dsDNA antibody titer, and the disease activity of SLE as represented by the Systemic Lupus Erythematosus Disease Activity Index (SLEDAI)16,17. Glomerular filtration rate (GFR) was estimated from a standard prediction equation18. The study was approved by the Clinical Research Ethical Committee of the Chinese University of Hong Kong.
Assessment of renal pathology
Kidney biopsy was evaluated according to the International Society of Nephrology/Renal Pathology Society (ISN/RPS) classification of LN19. The Activity Index and Chronicity Index of each biopsy were scored by standard methods20,21. All biopsies were assessed by 2 renal pathologists by light microscopy, each blinded from each other’s conclusions. ISN/RPS classifications between first and second biopsy were compared. In our experience, assessments of the 2 pathologists had excellent agreement.
Laser microdissection
The method of laser microdissection has been described in our previous studies22,23. Briefly, cryosections of 10 μm thickness were prepared on a cryostat (Leica Microsystems, Wetzlar, Germany) using disposable microtome blades (Leica) in RNase-free conditions, and were mounted on MembraneSlide 0.17 PEN slides (Carl Zeiss PALM Microlaser Technologies, Bernried, Germany). Immediately after taking the slides out of the cryostat, the sections were fixed in 70% ethanol and dehydrated in 100% ethanol. Sections were air-dried at room temperature. Laser microdissection of the snap-frozen kidney biopsy specimens was then performed using the PALM Microlaser System, which is equipped with a pulsed high-quality laser beam, computer-controlled microscope stage, and micromanipulator. Under direct visual control, areas of interest in the histological specimens were selected through the PALM RoboSoftware by moving the computer mouse, and microdissected by cutting the contour of the selected areas with the adjusted laser beam. The isolated tissue was then laser-catapulted into a microcentrifuge cap filled with guanidine thiocyanate containing lysis buffer for the subsequent RNA isolation. About 20 to 30 glomerulus and 20 randomly selected tubulointerstitial areas were isolated from each specimen. The tissue lysate of glomerulus and tubulointerstitium were kept at −80°C until RNA extraction was performed with the RNAqueous-Micro Kit (Applied Biosystems, Foster City, CA, USA), following manufacturer’s instruction.
Quantification of intrarenal gene expression
The method of total RNA extraction, reverse transcription, and real-time quantitative polymerase chain reaction (RT-QPCR) was as described22,24. In the present work, we quantified the messenger RNA expression of TWEAK, Fn14, IP-10, CXCR3, TLR9, and NGAL in glomerulus and tubulointerstitium by RT-QPCR. Taqman primers and probes of each target were purchased from Applied Biosystems. RT-QPCR was performed with the ABI Prism 7900HT Sequence Detector System (Applied Biosystems) following the manufacturer’s instruction. The messenger RNA (mRNA) expression for each signal was calculated using the ΔCt procedure according to manufacturer’s instructions, with GAPDH used as the housekeeping gene for normalization among samples. For GAPDH and each target, the relative efficiency of amplification over various starting template concentrations was determined. Nearly equal efficiencies for other targets with GAPDH amplifications were verified by an absolute value of < 0.1 for the slope of log input complementary DNA amount versus ΔCt, which was obtained by subtracting the threshold cycle (Ct) value of GAPDH from that of the target. Therefore, it was possible to detect GAPDH in the same tube with other targets. The relative quantification of multiplex reaction with a comparative method was determined by the formula 2 − (ΔΔCt), where ΔΔCt was calculated by subtraction of ΔCt of the calibrator from ΔCt of the sample. All primers and probes were tested with purified DNA as the template in RT-QPCR to ensure that they did not amplify genomic DNA. All results were analyzed by Sequence Detection Software version 1.7 (Applied Biosystems).
Statistical analysis
Data were analyzed using SPSS for Windows version 15.0 (SPSS Inc., Chicago, IL, USA). Results were presented as mean ± SD unless otherwise specified. Data were compared by paired or unpaired Student’s t test, 1-way ANOVA, Kruskal-Wallis test, Mann-Whitney U test, or Wilcoxon signed-rank test as appropriate. P values < 0.05 were considered statistically significant. All probabilities were 2-tailed.
RESULTS
We studied 118 patients with SLE who had had repeat renal biopsies. They were divided into 4 groups according to the patterns of histology in the first and second renal biopsy specimens. Their baseline demographic and clinical data are summarized and compared in Table 1.
Comparison of baseline clinical and histological characteristics. Data are mean ± SD, except where otherwise indicated.
Change in clinical and histological measures
The degree of histological chronicity index, activity index, estimated GFR, and proteinuria at the time of the 2 biopsies were compared and are summarized in Figure 1. Activity index decreased when changed from proliferative or mixed nephritis to membranous nephritis (Group 2; p < 0.0001), and increased when changed from membranous to proliferative or mixed nephritis (Group 3; p = 0.0008; Figure 1A). In contrast, histological chronicity index increased from the first to the second biopsy when the initial one showed proliferative or mixed nephritis (Group 1 and 2: p = 0.0005 and p = 0.001, respectively; Figure 1B).

Comparison between the first and second renal biopsies in the different groups: (A) histological activity index; (B) chronicity index; (C) estimated glomerular filtration rate (GFR); and (D) proteinuria. Group 1, proliferative or mixed nephritis in both biopsies; Group 2, from proliferative or mixed nephritis to membranous nephropathy; Group 3, from membranous nephropathy to proliferative or mixed nephritis; Group 4, membranous nephropathy in both biopsies. Data are compared by paired Student’s t-test.
Comparison of gene expression levels
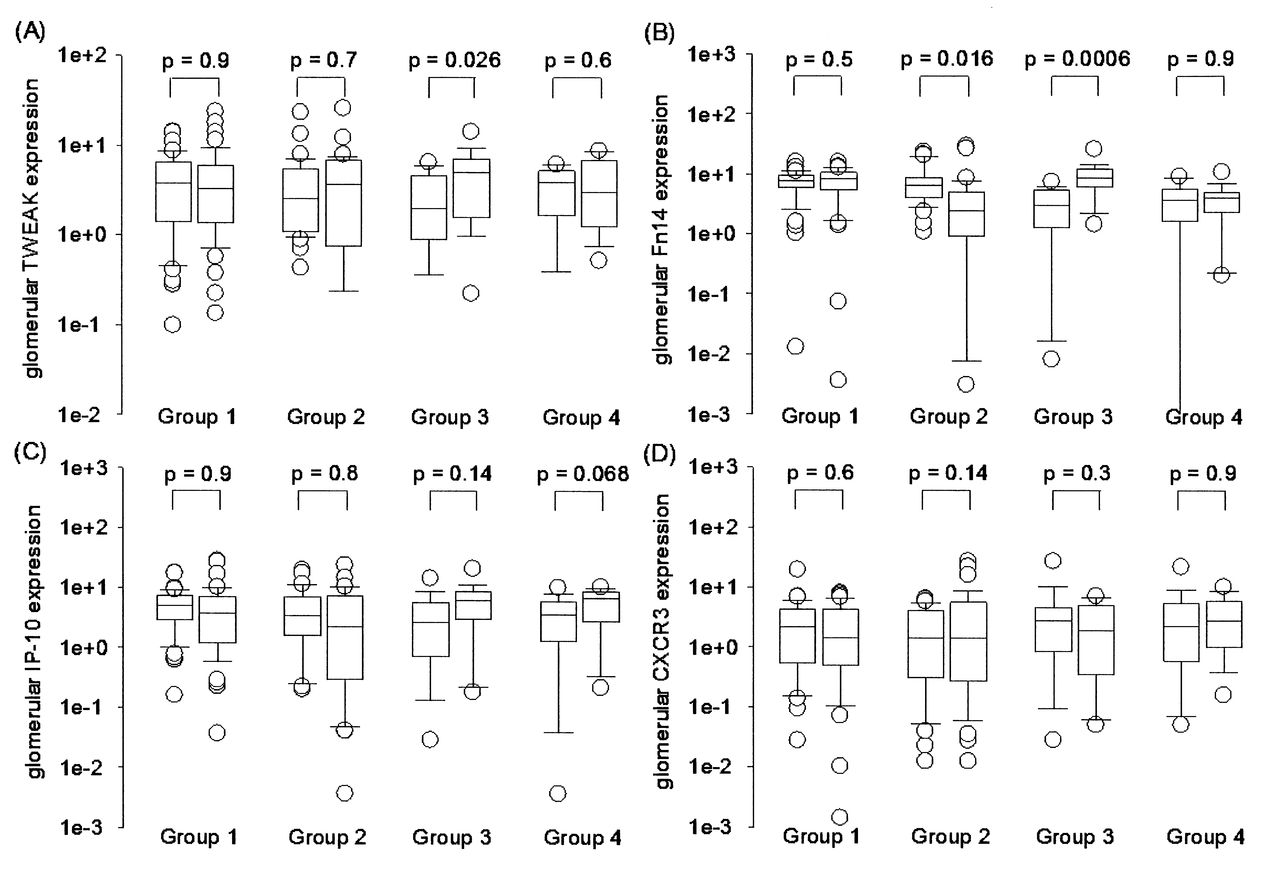
The glomerular mRNA expression levels of TWEAK, Fn14, IP-10, and CXCR3 are summarized in Figure 2. In short, glomerular Fn14 expression decreased when changed from proliferative or mixed nephritis to membranous nephropathy (Group 2; p = 0.016), and increased when changed from membranous to proliferative or mixed nephritis (Group 3; p = 0.0006). In contrast, glomerular Fn14 expression remained static when the first and second renal biopsy showed the sample histological pattern (Groups 1 and 4). There was no consistent pattern of change in the glomerular expression of TWEAK, IP-10, or CXCR3 (Figure 2).

Comparison of glomerular messenger RNA expression levels of (A) tumor necrosis factor-like weak inducer of apoptosis (TWEAK); (B) Fn14; (C) interferon-inducible protein (IP-10); and (D) CXCR3 between the first and second biopsy in different groups. Group 1, proliferative or mixed nephritis in both biopsies; Group 2, from proliferative or mixed nephritis to membranous nephropathy; Group 3, from membranous nephropathy to proliferative or mixed nephritis; Group 4, membranous nephropathy in both biopsies. Boxes indicate median, 25th and 75th percentile, with 5th and 95th percentiles; circles indicate outliers. Data are compared by Mann-Whitney U test.
The tubulointerstitial mRNA expression levels of TWEAK, Fn14, IP-10, and CXCR3 are summarized in Figure 3. In short, tubulointerstitial TWEAK expression decreased when changed from proliferative or mixed nephritis to membranous nephropathy (Group 2; p = 0.004), increased when changed from membranous nephropathy to proliferative nephritis (Group 3; p = 0.010), but remained static when the first and second renal biopsy showed the sample histological pattern (Groups 1 and 4). Similarly, tubulointerstitial IP-10 expression decreased when changed from proliferative or mixed nephritis to membranous nephropathy (Group 2; p < 0.0001). There was no consistent pattern of change in the tubulointerstitial expression of Fn14 or CXCR3 (Figure 3).

Comparison of tubulointerstitial messenger RNA expression levels of (A) tumor necrosis factor-like weak inducer of apoptosis (TWEAK); (B) Fn14; (C) interferon-inducible protein (IP-10); and (D) CXCR3 between the reference and repeat biopsy among different groups. Group 1, proliferative or mixed nephritis in both biopsies; Group 2, from proliferative or mixed nephritis to membranous nephropathy; Group 3, from membranous nephropathy to proliferative or mixed nephritis; Group 4, membranous nephropathy in both biopsies. Boxes indicate median, 25th and 75th percentiles, with 5th and 95th percentiles; circles indicate outliers. Data are compared by Mann-Whitney U test.
Relationship between gene expression and disease activity
Because some of the intrarenal gene expressions were related to histological class of LN, we further investigated intrarenal gene expression and disease activity. When all samples were pooled for analysis, we found that the histological activity index correlated significantly with the glomerular expression of Fn14 (r = 0.421, p < 0.0001) and tubulointerstitial expression of TWEAK (r = 0.413, p < 0.0001) and IP-10 (r = 0.472, p < 0.0001). In contrast, systemic disease activity, as represented by the SLEDAI score, did not correlate with any of the intrarenal expressions (data not shown).
DISCUSSION
We identified some target genes that appeared to have a consistent change in expression in parallel with the alteration in histological pattern of LN. Specifically, glomerular Fn14 and tubulointerstitial TWEAK expression tend to decrease when changed from proliferative or mixed nephritis to membranous nephropathy, while an opposite pattern of change was observed in tubulointerstitial TWEAK expression when changed from membranous nephropathy to proliferative nephritis.
The result of our study is consistent with our previous work13, which showed that there is an increase in intrarenal expression of TWEAK and Fn14 in LN. Thus, the TWEAK/Fn14 pathway may play an important role in the determination of the specific histological pattern of LN, with high TWEAK/Fn14 expression necessary for proliferative nephritis. Our result is also consistent with previous animal experiments, which showed that lupus mice treated with anti-TWEAK neutralizing antibody had reduced proliferative glomerular lesions10. Alternatively, because the glomerular expression of Fn14 and tubulointerstitial expression of TWEAK and IP-10 also correlated significantly with the histological activity index, it is also possible that these genes may be related to intrarenal disease activity rather than a specific histological pattern. However, there is a close association between histological class and activity index (i.e., proliferative nephritis almost always has a high activity index), so it is difficult to separate the effects of the two.
We found no consistent pattern of change in glomerular or tubulointerstitial CXCR3 expression in relation to the histological pattern of LN. The result may seem contradictory to our previous report13, which showed a reduced glomerular or tubulointerstitial CXCR3 expression in LN. A more careful examination of our previous data showed that intrarenal expression of CXCR3 correlates with proteinuria and renal function13 rather than the histological pattern of nephritis. Our findings seem to suggest that the CXCR3 pathway is important in the determination of clinical severity, rather than the histological pattern of LN.
The histological class switch is thought to be a characteristic feature of LN15. There is a high frequency of transformation of histological pattern upon repeat biopsy25,26,27. However, the pathogenesis of the transformation remains elusive. It is important to note that our present study takes advantage only of investigating SLE patients with repeated renal biopsies, so that gene expression profiles between different histological types of LN could be compared by an “internal control.” Other studies are needed to determine the factors that govern the longitudinal change of histological pattern, as well as the effect of time per se (i.e., the effect of the duration of disease) on LN.
Several limitations of our study need to be addressed. First, the sample size of many groups was small, so that there is not sufficient statistical power to compare all histological classes of LN. A much larger sample size would be necessary to allow sophisticated statistical analysis separating the effects of histological pattern and the effect of time (i.e., duration of disease) on the gene expression profile. Second, the cytokines we selected are largely based on our previous studies and are limited; many other possibly involved pathways were not examined. Because the amount of RNA available from tissue microdissection is limited, it is difficult to use microarray or other hypothesis-free technology to explore the gene expression profile of the specimen. In theory, our result could be strengthened by concomitant urinary gene expression studies or immunohistochemical studies to determine the corresponding change in intrarenal protein level. These approaches were not possible because of the limitations in the original study design.
Finally, we used the classic 1992 SLEDAI score in this study rather than the more current SLEDAI-2K28 or the Safety of Estrogens in Lupus Erythematosus: National Assessment-SLEDAI29 scores because the former system has been incorporated into our routine patient assessment. Many of the biopsies in our study were performed before the publication of the SLEDAI-2K system.
Our study suggests that tubulointerstitial IP-10 expression consistently decreased when the histology changed to membranous nephritis in the second biopsy. In contrast, tubulointerstitial TWEAK expression tends to decrease when changed to membranous and increase when changed from membranous. Our findings suggest that IP-10 and TWEAK appeared to have a consistent change in expression in parallel with the alteration in histological class of LN, suggesting a specific role in pathogenesis.
Footnotes
-
Supported in part by the Hong Kong Society of Nephrology Research Grant and the CUHK research account 6901031.
- Accepted for publication July 5, 2012.


