

Abstract
Objective. Inflamed tissues are usually characterized by low oxygen levels. We investigated whether pathophysiological hypoxia (pO2 < 1%) as found in the rheumatoid synovium modulates the transcriptome of human CD4+ T cells.
Methods. We analyzed the extent to which hypoxia influences the transcriptome in the rheumatoid synovium according to a gene cluster reflecting adaptation to low oxygen levels. Hypoxia-inducible factor-1α (HIF-1α) was detected in the rheumatoid synovium using immunohistochemistry. Isolated human CD4+ T cells were exposed to hypoxia and analyzed using microarray analysis, quantitative polymerase chain reaction, and immunoblot detection.
Results. In rheumatoid arthritis (RA) synovial tissue samples, hypoxia modulates the transcription profile. This profile is similar, but not identical, to that found in isolated CD4+ T cells incubated under hypoxic conditions. We show that HIF-1α is expressed in synovial tissue samples and in hypoxic CD4+ cells; and that hypoxia directly affects differential gene expression in human T cells with up to 4.8% modulation of the transcriptome. Functional genome analysis revealed substantial effects of hypoxia on immune response, transcriptional regulation, protein modification, cell growth and proliferation, and cell metabolism.
Conclusion. Severe hypoxia, a feature of joint inflammation, considerably modulates the transcriptome of cells found in the rheumatoid synovium. Human CD4+ T cells adapt to hypoxic conditions mainly by HIF-1-driven effects on the transcriptome reflecting a profound influence on immune functions. Thus, hypoxia must be taken into account when therapeutically targeting inflammation.
Rheumatoid arthritis (RA) is a chronic inflammatory joint disease of unknown etiology characterized by hyperplasia of the synovial membrane, degradation of cartilage, and bone erosion. CD4+ T cells are known to be critically involved in the pathophysiology of the disease, e.g., by activating macrophages and synovial fibroblasts1,2. It is known that these and other cells encounter pathologically low levels of oxygen, i.e., hypoxia, when executing their functions within the inflamed joint3. Hypoxia, a term that is commonly used to refer to physiologically relevant oxygen levels (2%–5% O2), also refers to pathophysiological oxygen levels (< 2%) that primarily occur in inflamed tissues, tumors, and ischemia4,5. Hypoxia can also be defined as a state in which the demand for oxygen exceeds the supply. This is likely to occur in the inflamed synovium as a result of microvascular damage, microthrombotic vessel occlusion, or excessive oxygen demand from the dramatic influx of metabolically active inflammatory cells6.
Therefore, in order to ensure adaptation and functional integrity, immune cells need to respond to these hypoxic conditions by coordinated expression of numerous genes, such as vascular endothelial growth factor (VEGF)7, glucose transporter 1 (GLUT-1)8, and phosphoglycerate kinase 1 (PGK-1)9,10. A key factor in this process is the hypoxia-inducible factor-1 (HIF-1), which regulates transcription of many hypoxia-activated genes (e.g., VEGF, GLUT-1, and PGK-1). The α-subunit of HIF-1 (HIF-1α) is rapidly degraded under normoxic conditions and stabilized under hypoxia11.
It has been shown that HIF-1α is expressed and functionally active in macrophages and, to some extent, in CD3+ T cells of the rheumatoid synovium, leaving a gap of information on B and T cell subsets12,13. Physiological oxygen levels, pathophysiological hypoxia, and the induction of HIF have considerable effects on CD3+ T cell survival and function, i.e., cytokine secretion and proliferation4,5,13⇓–15. Therefore, we wanted to know, first, whether the pathophysiological hypoxia found in the rheumatoid synovium is capable of modulating the synovial transcriptome in a significant manner, and second, how human CD4+ T cells transcriptionally adapt to these hypoxic conditions.
To answer these questions, we prepared synovial tissue samples from patients with RA and showed the influence of hypoxia on transcription profile compared to severe hypoxic cold ischemic synovial specimens (obtained post mortem) and to synovial tissue samples from patients with osteoarthritis (OA). Since hypoxic CD4+ T cells cannot be highly purified from synovial tissue explants, we established a model system by incubating these cells under low oxygen conditions. We observed that CD4+ T cells exhibit a similar but not identical hypoxia-influenced transcription profile as found in specimens prepared from rheumatoid synovial tissue. Further, we observed that HIF-1α is expressed both in isolated hypoxic CD4+ T cells and in CD4+ T cells infiltrating the rheumatoid synovium and that it induces HIF-1 target gene expression in hypoxic CD4+ T cells. Finally, we provide definite evidence that low levels of oxygen modulate gene expression in human CD4+ T cells in a complex manner. Moreover, distinct functional consequences and a considerable influence on immune response genes such as cytokines (28↑/8↓), receptors (36↑/19↓), and signaling cascades (88↑/36↓) regulated in a proinflammatory manner are to be expected.
MATERIALS AND METHODS
Antibodies and reagents
Actinomycin D and cycloheximide were purchased from Sigma-Aldrich Chemie GmbH (Munich, Germany). For the immunoblots, mouse monoclonal anti-human HIF-1α, anti-human pre-B cell colony enhancing factor (PBEF), anti-human ß-actin, and rabbit polyclonal anti-human GLUT-1 antibody were bought from BD Biosciences (Heidelberg, Germany), AdipoGen Inc. (Seoul, Korea), Sigma-Aldrich Chemie GmbH, and Abcam plc (Cambridge, UK), respectively. For the immunohistochemistry, mouse monoclonal and rabbit polyclonal anti-HIF-1α antibodies were purchased from Abcam plc, mouse monoclonal anti-hCD4, FITC conjugated swine anti-rabbit IgG, and Cy3 conjugated donkey anti-murine IgG from DakoCytomation GmbH (Hamburg, Germany) and Dianova (Hamburg. Germany). T cell stimulation was performed using 5 μg/ml PHA-L (Sigma-Aldrich Chemie GmbH).
Cell isolation, cell culture, and cell activation
Human CD4+ T cells (> 99% purity and > 95% viability) were prepared as described16. CD4+ T cells were left untreated or stimulated using PHA-L (5 μg/ml) as indicated. Although there are differences between PHA stimulation and T cell stimulation in RA joints, we consider our approach appropriate to simulate T cell activation in our experimental setting.
Induction of hypoxia
For microarray analysis, quantitative polymerase chain reaction (qPCR), and immunodetection, isolated CD4+ T cells were either incubated in a Clark-type oxygen electrode (Strathkelvin Instruments, Glasgow, Scotland), continuously monitoring oxygen saturation or incubated in a hypoxic chamber (Binder GmbH, Tuttlingen, Germany) at 5% CO2 and 0.5%–1% O2, balanced with N2 as indicated. Normoxic controls were incubated at 5% CO2 in a humidified atmosphere with approximately 18% O2.
RNA isolation
After cell lysis, total RNA was extracted (RNeasy Mini Kit; Qiagen, Hilden, Germany) and the quality was assessed using the Bioanalyzer (Agilent Technologies Deutschland GmbH. Böblingen, Germany).
Affymetrix microarray analysis of synovial explants and peripheral blood mononuclear cells (PBMC)
Expression profiles using oligonucleotide microarray HG-U133A (Affymetrix, Santa Clara, CA, USA) of synovial tissue samples and PBMC from patients with RA (RA_SYN: n = 10; RA_PBMC: n = 5) and from healthy donors (ND_SYN post mortem: n = 10; ND_PBMC: n = 7) and synovial tissue samples from patients with OA who underwent total joint replacement (OA_SYN: n = 10) were used as described in another study including clinical characteristics of patients17. The RA clinical score [Disease Activity Score-28 joints (DAS28)] was 5.38 ± 0.62 (mean ± SD; range 4.59–6.25), which demonstrates similar severity of disease in all RA patients examined. Control samples were derived from macroscopically healthy post mortem joints with no history of joint disease, representing the status of cold ischemia. The cause of death was cerebral bleeding or cerebral infarction. Specimens were obtained from different individuals.
Profiles of PBMC were as reported including clinical characteristics of patients; specimens were obtained from different individuals18. PBMC represent a normoxic state.
To quantify the activity of hypoxia-induced processes, a gene panel of known hypoxia-modulated HIF-induced targets was selected. The selected gene panel (1) included well known and characteristic hypoxia and HIF-induced genes in a variety of cell types19,20; and (2) covered a variety of biological processes involved in energy metabolism, angiogenesis and vasomotor regulation, cell growth and apoptosis, cell proliferation, migration and matrix remodeling, immune response, and transcriptional regulation (details available from the author upon request). Signals were rank-normalized on the basis of each individual gene. To calculate a sample-specific score, the rank-normalized signal values of all genes of the hypoxia target gene panel were adjusted by similar weighting using a z-normalization. Z-normalized ranked signal intensities were averaged separately for each sample resulting in the hypoxia score.
All experiments were conducted according to the protocols approved by the Charité University Hospital ethics committee and according to the Helsinki Declaration.
Microarray gene expression analysis of isolated in vitro hypoxic CD4+ T cells from healthy donors
The microarray experiment was based on 2-color ratio hybridization using the Whole Human Genome Oligo Microarray G4112A (Agilent Technologies Deutschland GmbH) according to manufacturer’s instructions. To quantify the activity of hypoxia-induced processes in these CD4+ T cell samples, the same gene panel of known HIF-induced targets was used as described above. We compared the results obtained from peripheral blood-derived CD3+/CD4+ T cells of 3 healthy donors after 6 h incubation under normoxia (≈ 18% pO2) versus hypoxia (< 1% pO2) for common gene expression pattern.
For the analysis of quiescent and PHA-stimulated peripheral blood-derived CD3+/CD4+ T cell transcriptome from 4 different individuals, we used a 2-color ratio hybridization (normoxia/hypoxia) with an additional color-swap experiment in order to obtain their whole-gene expression pattern (2 individuals were measured, each in duplicate).
Functional classification of differentially expressed genes assessed by Agilent microarray was performed using the PANTHER (Protein ANalysis THrough Evolutionary Relationships) classification system on the basis of their Gene ID according to the Biological Process (BP) annotation21. The clusters reflecting multiple processes (Figure 6B, 6C), are based on the resulting PANTHER BP annotations (available from the author upon request).
Quantitative PCR (qPCR) of selected genes
The cDNA were synthesized by reverse transcription using TaqMan® reverse transcription reagents (Applied Biosystems Deutschland GmbH, Darmstadt, Germany). qPCR was carried out using the LightCycler® Fast Start DNA Master SYBR® Green I Kit (Roche Diagnostics, Applied Science, Mannheim, Germany). Data were normalized for the expression of ß-actin (ACTB) or hypoxanthine-guanine phosphoribosyltransferase (HPRT) as indicated. All primers used were obtained from TIB Molbiol (Berlin, Germany; gene symbol: forward primer, reverse primer): ACTB: gAC Agg ATg CAg AAg gAg ATC ACT, TgA TCC ACA TCT gCT ggA Agg T; BNIP3: TTC CAT CTC TgC TgC TCT C, Tgg Tgg Agg TTg TCA gAC; CD69: gAA CAT ggT gCT ACT CTT gC, TTC CTC TCT ACC TgC gTA T; CXCR4: gCA TgA Cgg ACA AgT ACA ggC T, AAA gTA CCA gTT TgC CAC ggC; GAPDH: AAT gAC CCC TTC ATT gAC, TCC ACg ACg TAC TCA gCgC; GLUT1: ACg CTC TgA TCC CTC TCA gT, gCA gTA CAC ACC gAT gAT gAA g; HIF1A: CCA TTA gAAAgC AgT TCC gC, Tgg gTA ggA gAT ggA gAT gC; HPRT: gCC AgA CTT TgT Tgg ATT Tg, CTC TCA TCT TAg gCT TTg TAT TTT g; HSPA1 (HSP701A): Agg TgC Agg TgA gCT ACA Agg, ggT CAg CAC CAT ggA CgA g; HSPCB (HSP90B): ATg CCT gAg gAA gTg CAC CAT, CCA gAC TTg gCA ATg gTT CCC; NFKBIA: CCg CAC CTC CAC TCC ATC C, ACA TCA gCA CCC AAg gAC ACC; LDHA: ACC CAg TTT CCA CCA TgA TT, CCC AAA ATg CAA ggA ACA CT; MIF: CAg Tgg TgT CCg AgA AgT CA, TAg gCg AAg gTg gAg TTg TT; MT2A: ATg gAT CCC AAC TgC TCC Tg, TCA ggC gCA gCA gCT gCA C; PBEF: CgT gTg AgA AAA TAT ggg gTg A, ggT ggC AgC AAC TTg TAA CC; PGK1: ATg gAT gAg gTg gTg AAA gC, CAg TgC TCA CAT ggC TgA CT; VEGFA: AgC CTT gCC TTg CTg CTC TA, gTg CTg gCC TTg gTg Agg; CXCL1: Agg gAA TTC ACC CCA AgA AC, ACT ATg ggg gAT gCA ggA TT; CCL5: TAC CAT gAA ggT CTC CgC, gAC AAA gAC gAC TgC Tgg; UBCH5B: TCT TgA CAA TTC ATT TCC CAA CAg, TCA ggC ACT AAA ggA TCA TCT gg; EEF1A1: gTT gAT ATg gTT CCT ggC AAg C, TTg CCA gCT CCA gCA gCC T.
Immunohistochemistry
Synovial tissue samples were obtained from finger joints, wrists, or elbows from patients of different ages and genders with a long history of RA (data not shown).
Cryosections were fixed with methanol/acetone (1:1), blocked with bovine serum albumin and stained for T cells (CD3), B cells (CD20), and macrophages (CD68) (data not shown). Sections with massive T cell infiltration were selected for costaining with anti-CD4 and anti-HIF-1α antibodies. Control sections were incubated with an equal amount of universal negative control IgG of mouse or rabbit (DakoCytomation GmbH, Hamburg, Germany). Nuclei were visualized using DAPI. Photographs were obtained on a fluorescence microscope (Carl Zeiss MicroImaging GmbH, Berlin, Germany).
Immunoblotting of HIF-1α, PBEF, GLUT1, ß-actin
Cell lysis: For whole-cell extracts of T cells, 1 million cells were lysed in 20 μl Laemmli buffer. For preparation of nuclei, the Nuclear Extract Kit from Active Motif (Rixensart, Belgium) was used on T cells, according to the manufacturer’s instructions. Immunodetection of proteins: 20 μl of whole-cell extract or 10 μg of nuclear/cytoplasmic fraction were separated by sodium dodecyl sulfate-polyacrylamide gel electrophoresis (SDS-PAGE) and blotted onto PVDF membranes (Millipore GmbH, Schwalbach, Germany). Transferred proteins were analyzed as indicated and visualized by enzymatic chemiluminescence (Amersham Biosciences Europe GmbH, Freiburg, Germany).
Quantification of secreted CXCL1
Secreted CXCL1 was quantified by single-plex suspension assay, a cytometric bead array technique, as described22. For measurement of cytokine secretion upon stimulation with PHA-L by suspension array, CD4+ T cells at 4 × 10⁶ cells/mi were cultured in RPMI-1640 supplemented with 2 mM L-glutamine, 10% (vol/vol) fetal calf serum (FCS), penicillin G, streptomycin, and 2-ME, either under normoxia or hypoxia with or without PHA stimulation, as described. Culture supernatants from cell suspensions were collected after 20 h of incubation. CXCL1 single-plex cytokine (Bio-Rad GmbH, Munich, Germany) was used according to the manufacturer’s instructions. Data acquisition was conducted using the Bio-Plex suspension system. Each sample was read in duplicate and measured against the mean of 2 dilution rows.
Statistical analysis
Data are expressed as mean ± SEM unless otherwise stated. Differences were verified using the Student’s t tests, either unpaired (independent groups) or paired (dependent samples) assuming that distributions are normal and that the variances are equal. Multiple comparisons were analyzed using 2-way analysis of variance (ANOVA) with Bonferroni’s multiple comparison test post-hoc analysis. p < 0.05 was considered to be significant.
RESULTS
RA synovial tissue samples exhibit hypoxia-modulated transcription profiles
We first wanted to find out whether the rheumatoid synovium is characterized by oxygen levels low enough to change the transcriptome of pathophysiologically important cells in a measurable and clinically relevant manner. We therefore analyzed the transcription profiles of (1) RA synovial tissue samples from either open synovectomy or total joint replacement (n = 10); (2) OA synovial tissue samples from total joint replacement (n = 10); and (3) specimens from macroscopically healthy joints post mortem, serving as cold ischemic (i.e., strongly hypoxic) positive controls (n = 10).
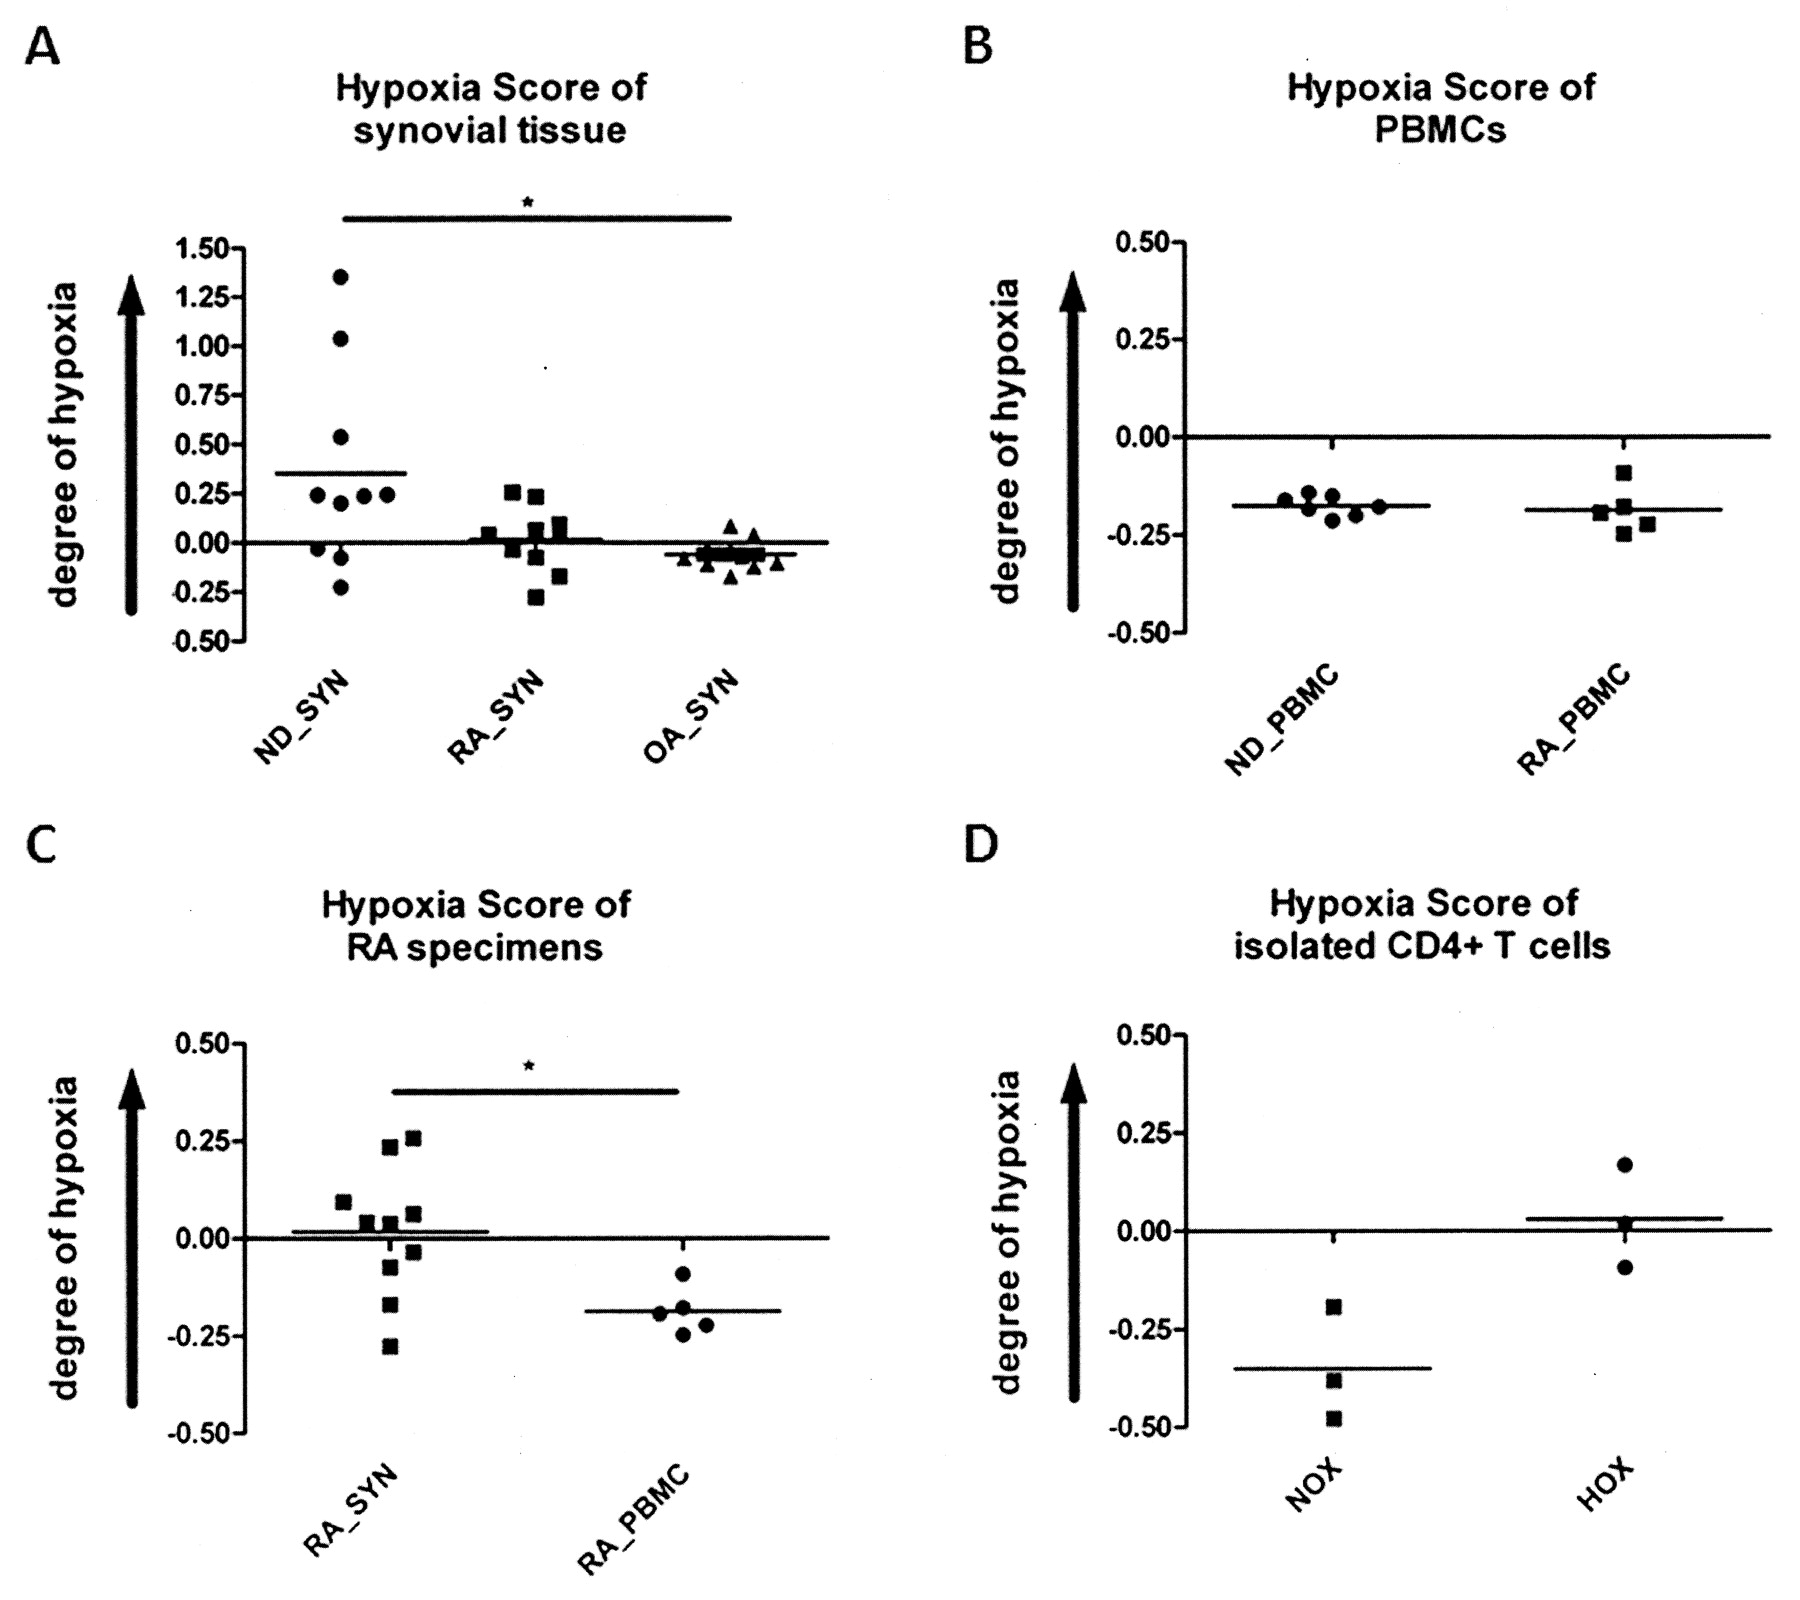
Comparing these profiles based on the expression of a cluster of genes known to be regulated by HIF/hypoxia19,20 we found a similar hypoxia score in cold ischemic synovial samples from healthy joints (ND_SYN post mortem) compared to RA synovial samples (RA_SYN; Figure 1A). Analysis of the data as presented in Figure 1A revealed only a tendency (p = 0.0716) of the hypoxia score to be higher in ND_SYN post mortem than in RA_SYN. This is because in 7 out of 10 ND_SYN post mortem samples the hypoxia score was within the RA_SYN range, which emphasizes the effect of hypoxia in the inflamed rheumatoid synovium. In addition, we found a significantly higher hypoxia score (p = 0.0298) in cold ischemic synovial samples from healthy joints (ND_SYN post mortem) compared with OA synovial samples (OA_SYN), reflecting a better oxygenized tissue than those of RA synovial samples (RA_SYN), despite the fact that we could observe no statistical but only a numeric difference between these 2 groups (p = 0.1026; n = 10; RA_SYN = 0.02 ± 0.05 and OA_SYN = −0.08 ± 0.02; mean ± SEM; Figure 1A). Using this method, we also compared PBMC from healthy individuals (ND_PBMC) and from patients with RA (RA_PBMC), and found no difference between the 2 groups, except for a low hypoxia score (Figure 1B), reflecting the oxygenized conditions of the peripheral blood (ND_PBMC: −0.20 ± 0.01; RA_PBMC: −0.20 ± 0.02).

Synovial explants and in vitro hypoxic CD4+ T cells exhibit a similar gene signature. A. Hypoxia score of synovial explants from patients with rheumatoid arthritis (RA_SYN), from patients with osteoarthritis (OA_SYN), and normal donors (ND_SYN) obtained post mortem (representing a cold ischemic state); B. Hypoxia score of PBMC from healthy normal donors (ND_PBMC) and RA patients (RA_PBMC); C. Hypoxia score of synovial explants and PBMC from patients with rheumatoid arthritis (RA_SYN) as assessed by Affymetrix microarray (means; unpaired t test: *p < 0.05). D. In vitro hypoxia shows a similar hypoxia score in CD4+ T cells compared to RA specimens, as assessed by Agilent microarray (means; n = 3; paired t test: p = 0.105).
For RA patients, we also compared the hypoxia scores measured in synovial samples with those measured in PBMC. This approach has the limitation that the cell compositions are different. Bearing this in mind, we found the hypoxia score was significantly higher (p = 0.0106) in synovial samples (hypoxic conditions) than in PBMC (normoxic conditions; Figure 1C).
Our results indicate hypoxia to be a crucial factor in the inflamed synovium. However, we could not rule out a putative cell type or tissue-specific effects on the hypoxia score independent of hypoxia itself. This limitation prompted us to analyze the influence of pathophysiological hypoxia (< 2%) on isolated CD4+ T cells.
CD4+ T cells under low oxygen conditions exhibited a similar hypoxic transcription profile compared to specimens prepared from RA synovial tissue
To investigate how human CD4+ T cells adapt to pathophysiologically hypoxic conditions, it would have been ideal to focus exclusively on synovial tissue-embedded CD4+ T cells. But given the low number of synovial tissue CD4+ T cells, their tissue embedding, and the need to keep these cells in a hypoxic state for investigation, it would be very difficult for technical reasons to isolate and investigate a larger number of synovial (still hypoxic) CD4+ cells in more detail ex vivo. Therefore, we established an in vitro model system incubating highly purified CD4+ T cells under defined levels of low oxygen. This model enabled us to test both the validity of the hypoxia score and the clinical relevance of hypoxia as shown for the tissue samples (Figure 1A and 1C). In a second approach we additionally stimulated the CD4+ T cells in order to evaluate the combination of hypoxia and activation such as found in the inflamed joint.
To determine the net effect of hypoxia, we compared the transcription profile of quiescent hypoxic CD4+ T cells with that of cells prepared from RA synovial tissue samples, and found a similarity with regard to the regulation of hypoxia-modulated genes (Figure 1D).
HIF-1α, the master regulator of oxygen homeostasis, is expressed in both hypoxic CD4+ T cells and CD4+ T cells infiltrating the RA synovium
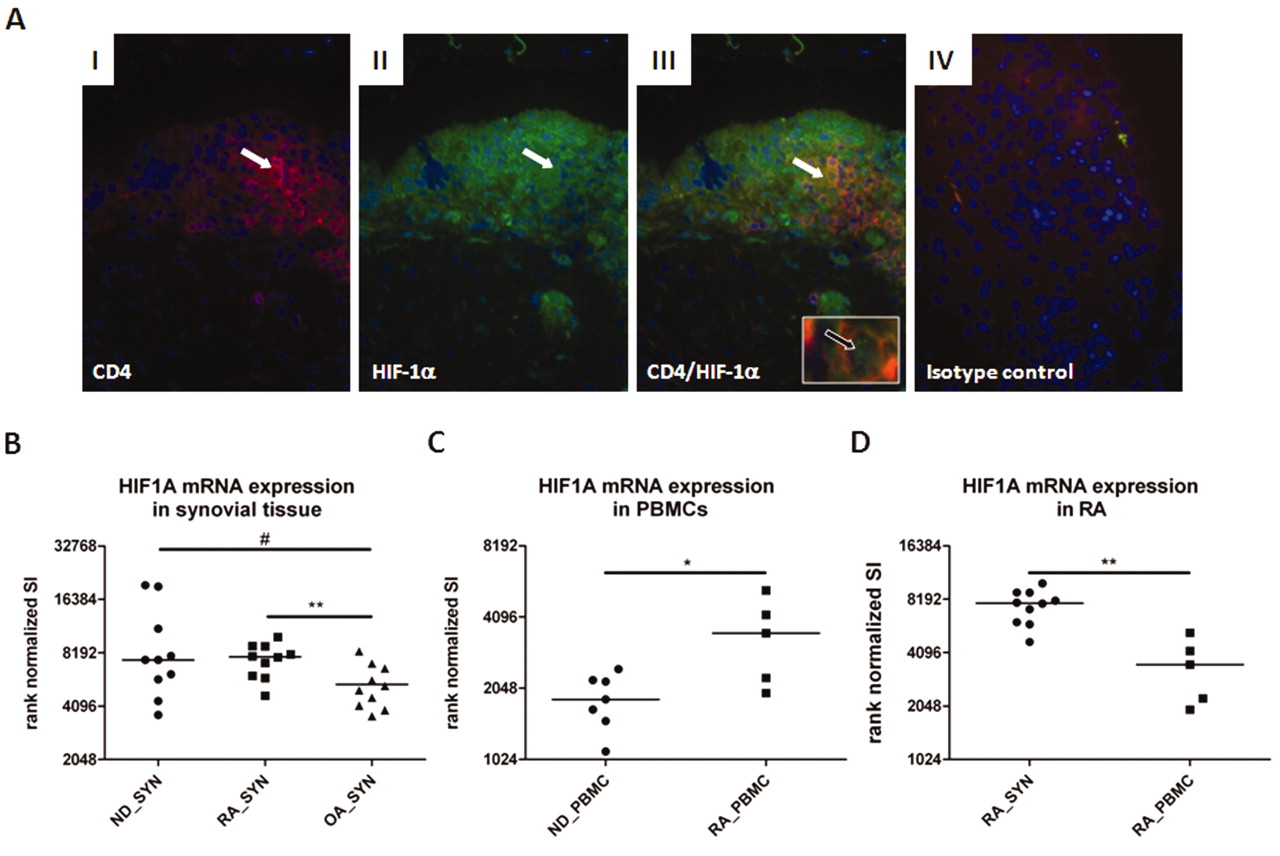
We found that HIF-1α is expressed in both CD4+ T cells identified in synovial samples and CD4+ T cells incubated in vitro under conditions of hypoxia (Figures 2 and 3). Using immunohistochemistry, we identified areas within the inflamed RA synovial tissue, such as the lining area and lymphoid aggregates, where HIF-1α was expressed in most of the cells, including CD4+ cells.

Expression of HIF-1α is increased in RA synovial explants and in synovial CD4+ T cells. A. Cryosections of RA synovial tissue costained for CD4 and HIF-1α (regions of interest are indicated by white arrows, green spots of nuclear staining are indicated by black arrow). Nuclei are stained with DAPI. (I) CD4+ T cells; (II) HIF-1α expression; (III) overlap of staining shows colocalized CD4 and HIF-1α expression in T cells; (IV) isotype control staining. B. Rank-normalized signal intensity (SI) of HIF-1α expression in synovial explants from patients with rheumatoid arthritis (RA_SYN), with osteoarthritis (OA_SYN), and normal donors (ND_SYN) obtained post mortem (representing a cold ischemic state); C. Rank-normalized signal intensity (SI) of HIF-1α expression in PBMC from healthy normal donors (ND_PBMC) and RA patients (RA_PBMC); D. Rank-normalized signal intensity (SI) of HIF-1α expression in synovial explants and PBMC from patients with rheumatoid arthritis (RA_SYN) assessed by Affymetrix microarray (means; unpaired t test: #p = 0.07, *p < 0.05, **p < 0.01).

In vitro hypoxia leads to HIF-1α expression in CD4+ T cells. Human CD4+ T cells derived from peripheral blood were incubated 6 h under normoxic or hypoxic conditions using a Clark-type electrode. A. Transcript was determined using qPCR normalized to normoxic controls and against either ACTB or HPRT (broken line indicates expression under normoxia). B. Quiescent human CD4+ T cells derived from peripheral blood were incubated 6 h under normoxic or hypoxic conditions using a Clark-type electrode, left untreated, treated with 10 μM cycloheximide, or treated with 10 μM actinomycin D. HIF-1α and ß-actin were detected by immunoblot. C. Human CD4+ T cells were incubated 6 h under normoxic or hypoxic conditions using a hypoxic chamber in the presence or absence of PHA-L stimulation (5 μg/ml) as indicated. HIF-1α and ß-actin were detected by immunoblot.
Using microarrays, we correspondingly found increased HIF-1α expression in RA synovial tissues and cold ischemic tissues compared with synovial OA tissues (OA vs RA: p = 0.0087; OA vs cold ischemic: p = 0.068; Figure 2B). Interestingly, we found a significant manifestation of the HIF-1α gene expression in RA PBMC compared to PBMC from healthy donors (p = 0.03; Figure 2C). Further, hypoxic RA synovial tissue (within the limitations discussed above) expressed a significantly higher HIF-1α gene level than that of normoxic RA PBMC (Figure 2D), which defines RA synovial tissue cells as being hypoxic.
However, HIF-1α mRNA was also induced by hypoxic treatment of isolated CD4+ T cells (Figure 3A). At the protein level, we observed a strong induction of HIF-1α (Figure 3B). Hypoxia-induced accumulation of HIF-1α in CD4+ T cells depends on a transcriptional supply of mRNA templates as well as on translational functionality, as shown by sensitivity to transcription blocker (actinomycin D) and translation inhibitor (cycloheximide; Figure 3B). PHA stimulation alone was not sufficient to induce HIF-1α protein, but it did enhance the intensity of hypoxia-induced upregulation (Figure 3C).
Hypoxia leads to translocation of HIF-1α into the nucleus and to HIF target gene expression in human CD4+ T cells
From these results, we concluded that our in vitro hypoxia model system was suitable to perform an in-depth analysis of how human CD4+ T cells function under low oxygen levels. First, we found that HIF-1α, once stabilized, is transferred to the nucleus of quiescent hypoxic T cells as shown by immunoblots of extracts from isolated nuclei and cytoplasm (Figure 4A). Nuclear translocation of HIF-1α leads to a switch of gene expression pattern under hypoxia (Figure 1). This finding was confirmed by quantitative PCR for crucial HIF-1 target genes (as known from other cell types) such as BCL2/adenovirus E1B 19 kDa-interacting protein 3 (BNIP3), VEGFA, PGK1, and GLUT1 (Figure 4B, 4C).

In vitro hypoxia leads to nuclear translocation of HIF-1α and HIF-1-dependent target gene expression. A. Quiescent human CD4+ T cells derived from peripheral blood were incubated 6 h under normoxic or hypoxic conditions. Nuclear (NE) and cytosolic extracts (CE) were blotted and analyzed by immunodetection for HIF-1α and ß-actin. B and C. qPCR of in vitro hypoxia/HIF-induced transcript for BNIP3, VEGFA, PGK1, and GLUT1, normalized to normoxic control against ACTB or HPRT from isolated peripheral blood-derived CD4+ T cells after 6 h and 12 h incubation under normoxia or hypoxia.
Low levels of oxygen modulate gene expression in quiescent and PHA-stimulated CD4+ T cells in a complex manner
Next, we analyzed the effect of hypoxia on the transcriptome of CD4+ T cells in more detail. Evaluation of expression pattern was restricted to those sequences that exhibited a ≥ 2-fold expression, in order to identify differences between quiescent CD4+ T cells incubated under hypoxic versus those under normoxic conditions. In additional experiments, we also stimulated CD4+ T cells using PHA-L in order to simulate conditions in the inflamed synovium.
Analyzing the effect of hypoxia on the transcriptome of CD4+ T cells, we identified 1663 differentially expressed unique genes in quiescent T cells (1053↑/609↓) and 1913 genes in PHA-stimulated CD4+ T cells (1247↑/666↓) using a 44-k whole-genome microarray (Agilent). 835 genes (528↑/307↓) were regulated independently from donor variance and stimulatory conditions. On the basis of 39,824 National Center for Biotechnology Information (NCBI) Gene ID entries, hypoxia modulates 4.18% of the transcriptome in quiescent CD4+ T cells and 4.80% of the transcriptome in PHA-stimulated CD4+ T cells23. The percentage might be even higher when one considers that the Agilent whole-genome microarray analysis covers 18,615 of the 39,824 NCBI Gene ID entries.
We confirmed our microarray data by quantitative PCR, randomly selecting 20 genes involved in the response to hypoxia with focus on protein folding and translation, cellular metabolism (e.g., glycolysis), and immune regulation (Figure 5A, 5B). We found 100% concordance of microarray and quantitative PCR data with respect to the direction of the expression changes. These results not only confirmed genes identified by the microarray technique but also provided the basis for functional cluster analysis using PANTHER BP annotations21.
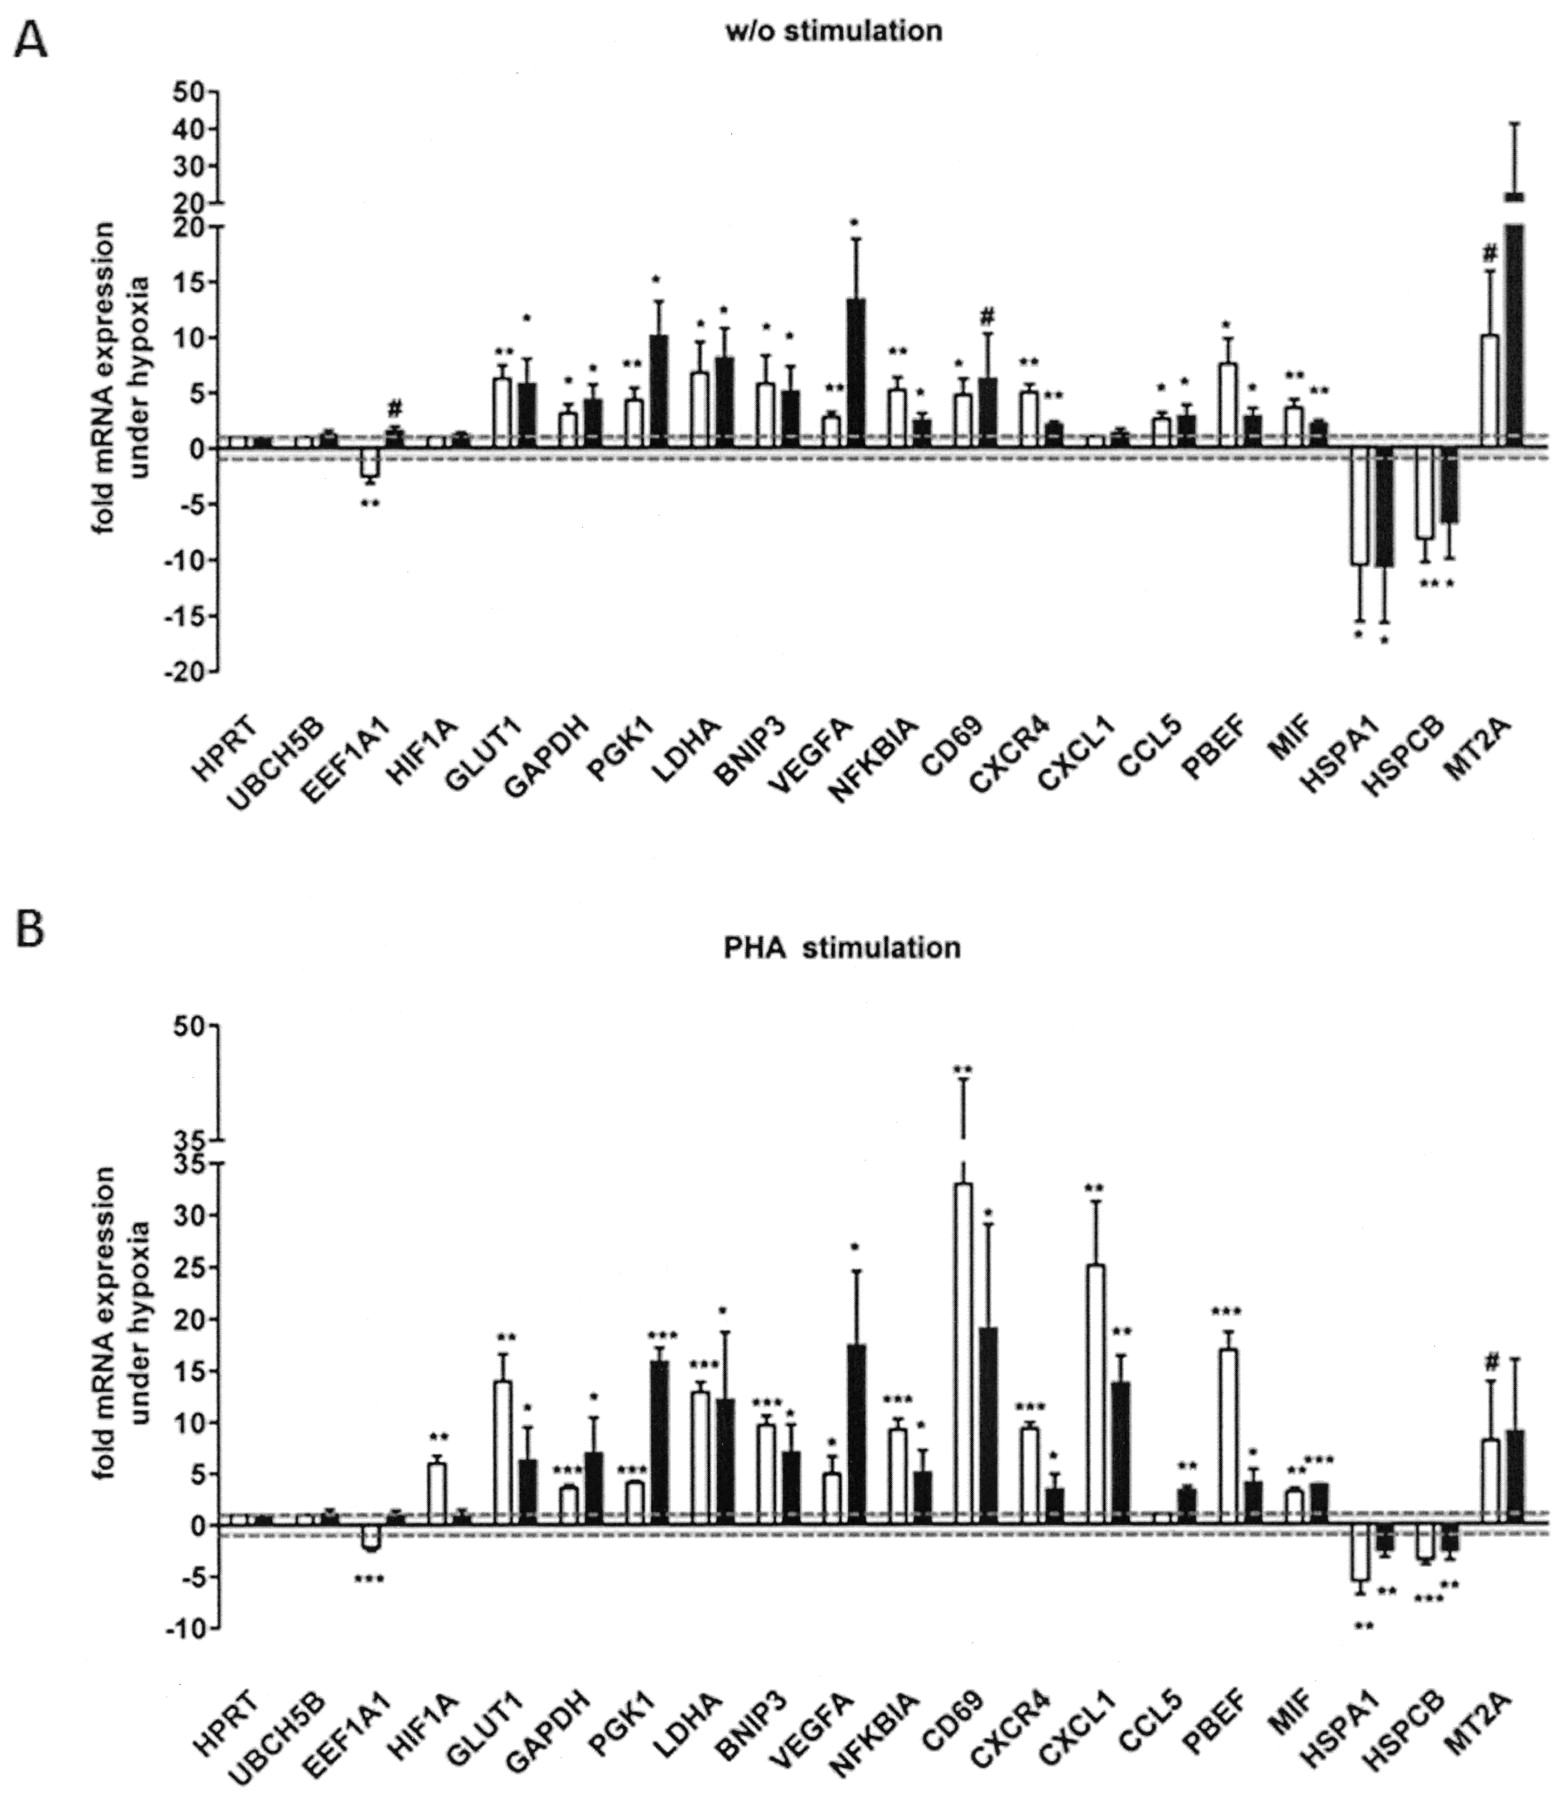
Confirmation of microarray data by qPCR. Confirmation of microarray data (white bars) from quiescent CD4+ T cells (A) and PHA-stimulated CD4+ T cells (B) by quantitative 2-step RT-PCR (black bars) from RNA/cDNA samples obtained after 6 h incubation under hypoxia and normoxia. Transcript levels for a subset of known and novel hypoxia-modulated genes were quantified. ACTB was used for normalization [one sample t test (normoxia = 1): #p < 0.1, *p < 0.05, **p < 0.01, ***p < 0.001].
PANTHER BP annotation revealed remarkable changes in gene expression involved in biological processes such as transcription and transcriptional regulation, mRNA processing, and mRNA splicing. To avoid redundancies, we clustered BP classifications to their main function in the following clusters: Metabolism and Homeostasis, Transcription and Transcriptional Regulation, Protein Translation, Folding and Modification, Signal Transduction, Cell growth and Proliferation, Transport, Immune Response, Stress Response, and Apoptosis (Figure 6B, 6C). A selection of our data is given in Table 1 (details available from the author upon request).

Influence of hypoxia on transcriptome in primary human CD4+ T cells: statistical analysis and functional classification. A. Differential gene expression pattern of isolated peripheral blood-derived CD4+ T cells after 6 h incubation under normoxia/hypoxia using a Clark-type electrode treated with PHA-L (T cell stimulation) or left untreated from Agilent microarray gene expression analysis (left column: quiescent T cells; right column: PHA-stimulated T cells). B and C. Cluster of functional classifications of biological process (BP) according to PANTHER for quiescent T cells (B) and PHA-stimulated T cells (C). Genes are functionally associated in a variety of biological processes such as transcriptional regulation, metabolism, signaling, cell death/apoptosis, and cell proliferation and of special interest immune response (highlighted cluster; see Table 1). The grouping algorithm is based on the hypothesis that similar annotations should have similar gene members with similar biological meaning, in order to reduce their redundancy. Functional classification was performed based on the PANTHER classification. Clustering of PANTHER BP was based on similarities, to avoid redundancies.
Immune responses (selected genes). Data are hypoxia-mediated fold-change values.
It should be noted that gene expression profiling also revealed several hypoxia-modulated genes that are known to be linked to RA. Some of them are well known autoantigens such as glucose phosphate isomerase (GPI) or vimentin (VIM) and proinflammatory soluble factors such as interleukin 6 (IL-6), IL-8, IL-1ß, VEGF, MIF, and PBEF (details available from the author upon request).
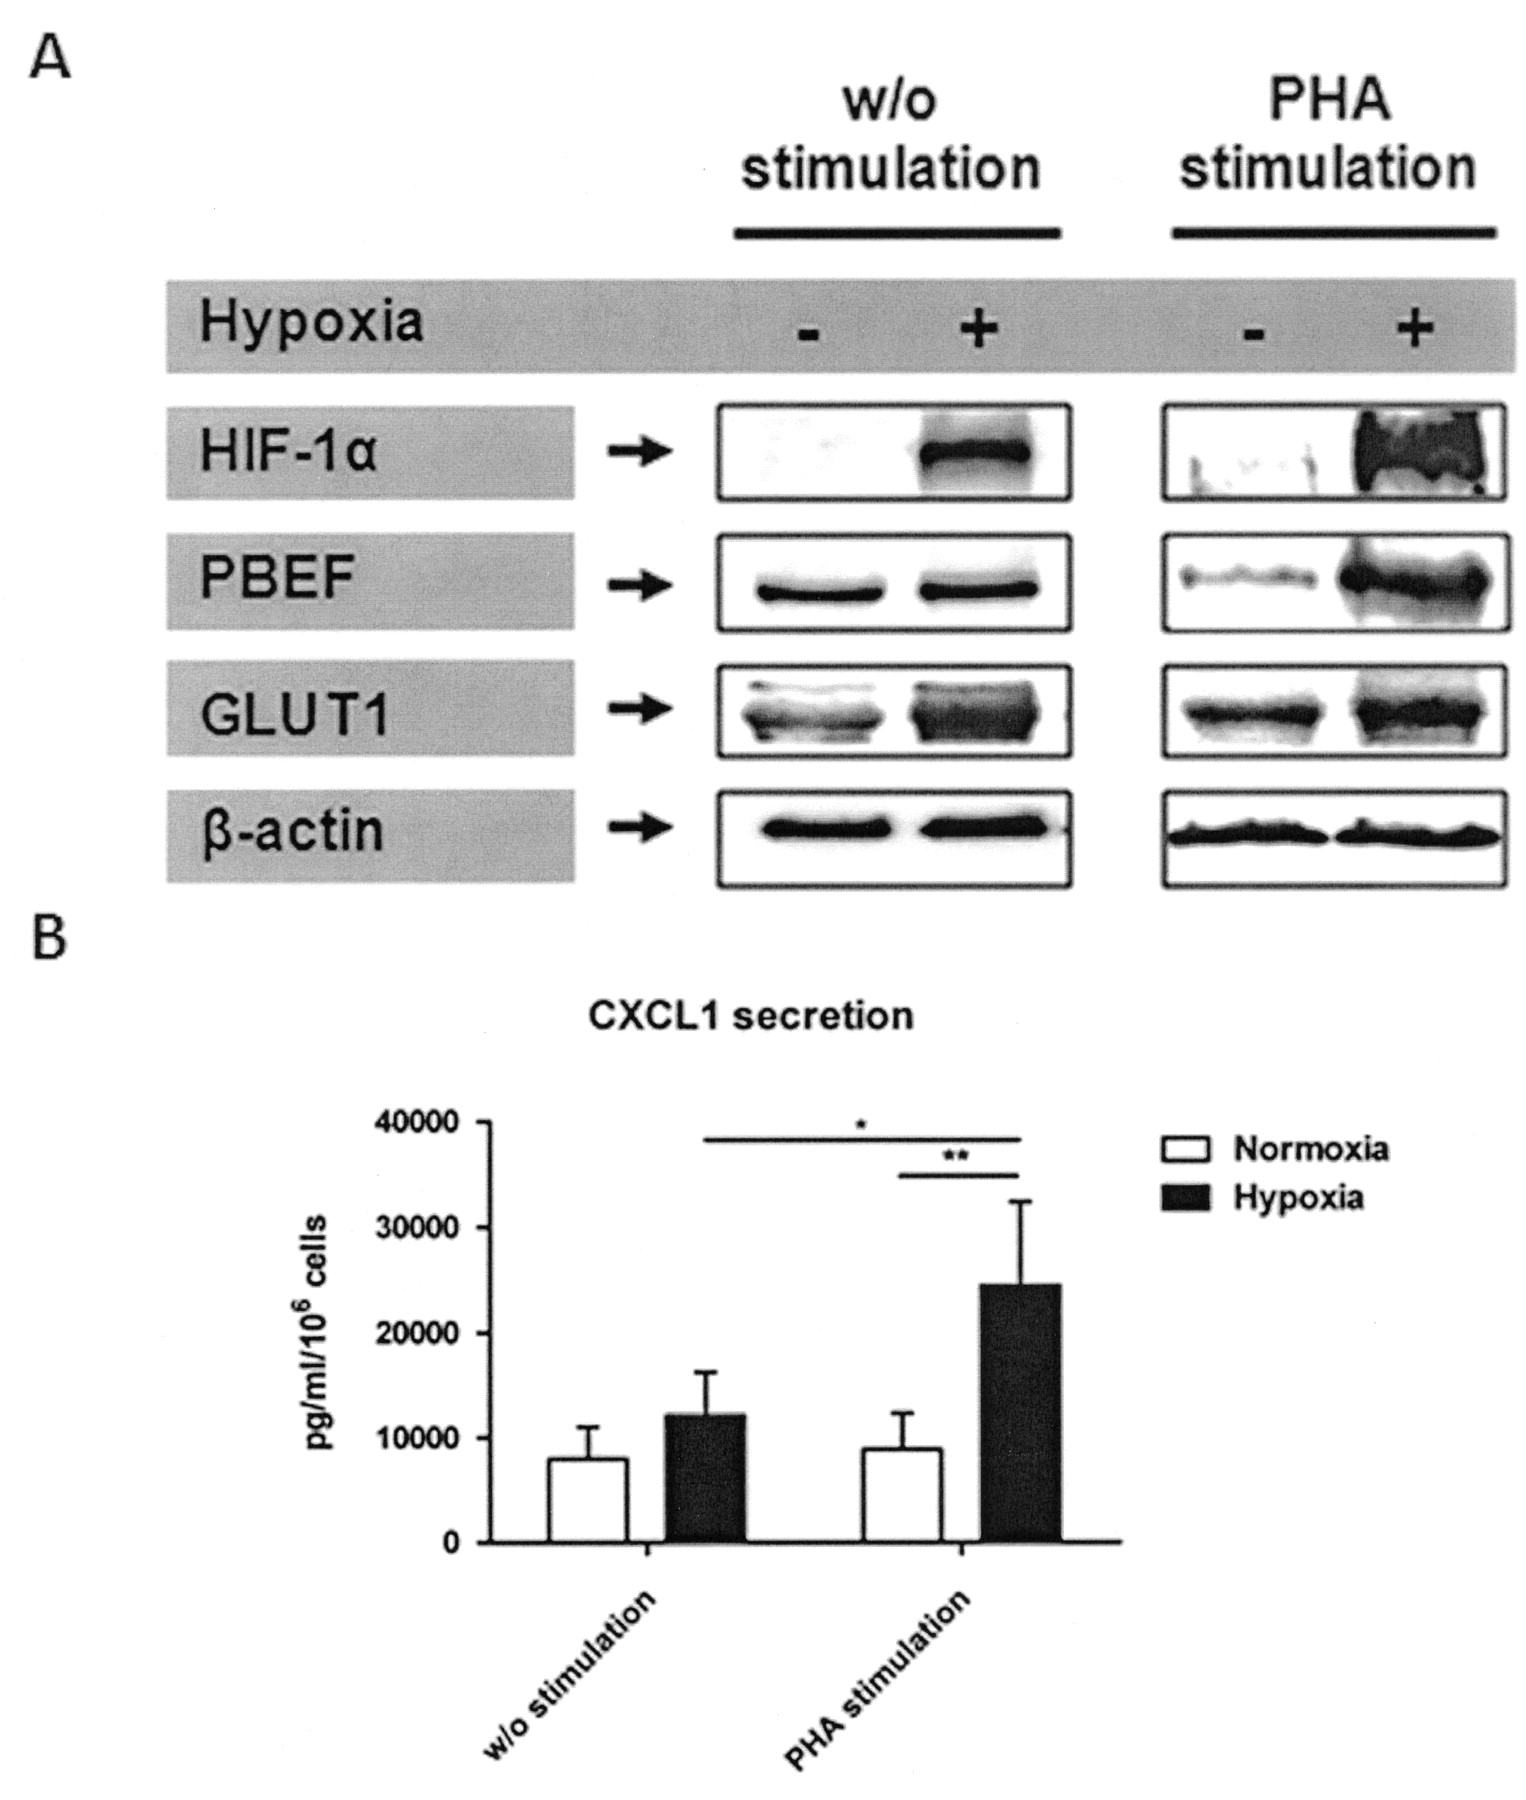
To strengthen the mRNA data, we also analyzed the following crucial targets at protein level: (1) the hypoxia-induced master regulator HIF-1α; (2) the bioenergetically important glucose transporter-1 (GLUT-1); (3) one of the most highly expressed proinflammatory molecules in quiescent and stimulated CD4+ T cells, the pre-B cell colony enhancing factor (PBEF); and finally (4) one of the most highly expressed proinflammatory molecules in PHA-stimulated CD4+ T cells only, the chemokine CXCL1 (Figure 7). At protein level, we observed a strong induction of HIF-1α under hypoxia, which was further enhanced by PHA stimulation compared with ß-actin. As well, GLUT-1 showed a clear induction under hypoxia with further enhancement by PHA stimulation. In contrast, PBEF and secreted CXCL1 were only induced upon PHA stimulation under hypoxia, while the latter was reduced as a consequence of stimulation under normoxic conditions. This reduction could not be explained by increased PBEF secretion (data not shown).

Confirmation of microarray data on the protein level from quiescent CD4+ T cells and PHA-stimulated CD4+ T cells by (A) immunoblot detection of HIF-1α, PBEF, GLUT1, and ß-actin (1 of at least 2 representative blots) and (B) single-plex suspension assay of secreted CXCL1 from protein samples or culture supernatants obtained after 20 h incubation under hypoxia and normoxia (2-way ANOVA with Bonferroni’s multiple comparison test post hoc analysis: *p < 0.05, **p < 0.01).
DISCUSSION
The hypoxic nature of the inflamed joint has been characterized extensively by measuring pO2 of synovial fluid, for determining hypoxic metabolites, identifying single marker-gene expression such as HIF-1α, and staining hypoxic areas (reviewed by Gaber, et al11).
Using a selected gene panel composed of genes involved in energy metabolism (e.g., GLUT-1, HK1/2), angiogenesis and vasomotor regulation (e.g., VEGF, ANGPT1/2/4), cell growth and apoptosis (e.g., BNIP3/3L, DDIT4), cell proliferation (e.g., CDKN1A, CCNG2), migration and matrix remodeling (e.g., CXCR4, MMP2), immune response (e.g., IL-6, TGF-α), and transcriptional regulation (e.g., BHLHB2, JUN)19,20,24,25, we show the influence of hypoxia by comparing the hypoxic gene expression pattern (cold ischemic samples, osteoarthritic and rheumatoid synovium) to that of normoxic PBMC. In patients with RA, we found whole-tissue samples were clearly affected by hypoxia. The observed effect was more pronounced than in specimens from OA patients if compared to cold ischemic samples. We did not find a statistical difference but did find a numeric difference between the hypoxia scores for RA and those of OA tissue (Figure 1). This finding is supported by Lee, et al, who reported that RA patients had significantly lower synovial fluid pO2 levels in their knee joints than did OA patients26. However, our results do not rule out that synovial tissue is intrinsically hypoxic; this is supported by Giatromanolaki, et al, who observed the HIF-α pathway in both RA and OA tissue27.
As a key finding, we observed significantly upregulated expression of genes involved in the glycolytic pathway16. This finding represents a common feature of hypoxia-induced changes, because cells rely more heavily on glycolysis to generate ATP under conditions of low oxygen availability28. However, the statistical analysis did not reveal a significant correlation between severity of disease (measured by DAS28) and hypoxia score (data not shown).
From these data we conclude that synovial tissue may be intrinsically hypoxic to some extent, but in RA the degree of hypoxia is very likely to be enhanced for the following reasons. First, the relative oxygen/cell ratio is decreased due to invasion of immune cells and hyperproliferation of pannus tissue cells. Second, there are often large distances between cells and arterial vessels that supply oxygen, which is due to cell accumulation and inflammatory edema. Third, vasodilatation as induced by inflammatory mediators such as prostaglandin E2 lowers blood flow and thus oxygen and nutrient supply (glucose and amino acids) and metabolic waste removal (lactate and carbon dioxide)11,29. As discussed, we found a numerical difference between the hypoxia scores for RA and those for OA tissue samples. This may indicate that a larger group of patients needs to be measured (using our approach) in order to identify an additional statistically significant difference that is produced in RA by the pathophysiological mechanisms we have described. These data demonstrate hypoxia is an important feature of joint inflammation in RA. Thus, immune cells need to respond to these hypoxic conditions in order to ensure adaptation and functional integrity. Even so, the role hypoxia plays in the pathophysiology/pathology of RA remains to be clarified.
To further analyze the effect of hypoxia on the CD4+ T cell transcriptome, we established a monitored in vitro hypoxia model to simulate conditions found in the rheumatoid synovium. We had to ensure the suitability of our experimental protocol to identify bona fide hypoxia-responsive genes in primary human CD4+ T cells. This was deduced from measurement of oxygen saturation of the incubation medium (data not shown), from the induction of HIF-1α protein (Figure 3), and from our observation of hypoxia-modulated genes (Figure 1D).
In agreement with previous reports, we observed abundant expression of HIF-1a in several cell types of the inflamed RA synovium, including CD4+ T cells13,27,30,31 (Figure 2). Using our in vitro hypoxia model, we were also able to detect induction of HIF-1α in CD4+ T cells at the protein level, even without stimulation. This is in contrast to a study by Nakamura, et al, where HIF-1α was shown to be inducible under hypoxia only upon TCR engagement13,32. We did not see a PHA engaged induction of HIF-1α under normoxia, which had been demonstrated in murine T cells, but we did detect a further increase at the protein level upon PHA stimulation, as reported by Nakamura, et al32⇓⇓–35 (Figure 3C). This finding supports the view that hypoxia alone induces HIF-1α in human CD4+ T cells in vitro and in vivo, but not stimulation itself, as observed in a murine-specific short HIF-1α variant identified by Lukashev, et al33,34. To date, several HIF-1 isoforms have been described in humans36⇓⇓⇓–40. In some experiments we inconsistently detected smaller bands not attributable to the oxygen-labile HIF-1α (120 kDa) that were not oxygen-labile and did not depend on PHA stimulation (Figure 3C). Therefore, we consider these signals were background noise that did not represent HIF-1 isoforms.
The abundance of HIF-1α expression in CD4+ T cells suggests that HIF-1 is the key agent in adaptation to hypoxia in these cells. We found that VEGF, GLUT-1, PGK1, and BNIP3 are expressed in a HIF-1-dependent manner (Figure 4). Analysis of the T cell transcriptome and subsequent functional data interpretation provided evidence for a comprehensive process of T cell adaptation to and induction by hypoxia. This is partly dependent on their activation state. This process includes genes revolving catabolic metabolism by the induction of genes involved in glycolysis, amino acid degradation, and oxidative phosphorylation.
This change in metabolism requires transcriptional alterations induced in part by transcription factors such as HIF-1 (HIF-1α), NFATc (NFATc1, NFATc3, NFAT5), and nuclear factor-κB (RelB, NFκBIα), but also by chromatin-remodeling events such as the induction of histone modifiers, e.g., SAP30, the regulation of NAD+-dependent histone deacetylase, e.g., PBEF1, and suppression of histone expression itself. Another example is the adaptation of transport mechanisms as illustrated by enhanced glucose uptake via GLUT-1 and/or GLUT-3, which provides fuel for T cell function under hypoxia, similar to observations in monocytes24,41
We observed that hypoxic human CD4+ T cells express genes involved in processes of cell activation and immune response, among them HIF-1α itself, and NF-κB via NFκBIα.
The following inhibitory effects of hypoxia and HIF-1α on T cell activation have been reported: (1) hypoxia inhibits T cell receptor (TCR)-induced proinflammatory cytokine accumulation (e.g., interferon-γ) in T cells14; (2) hypoxia inhibits TCR-induced proliferation4,5; (3) deletion of murine HIF-1α in T and B cells results in increased tissue damage and autoimmunity42,43; and (4) deletion of HIF-1α in murine T cells results in enhanced activation of T cells in vitro34,35. Further, Thiel, et al35 observed that HIF-1α has an antiinflammatory effect during antibacterial response via reduction of NF-κB activity. Our gene expression data showing hypoxia-mediated induction of the inhibitor of NF-κB (NFκBIα) and suppression of additional signaling molecules, such as NFAT5, NFATc3, FOS, and JUN as well as Ca2+ signaling involved S100A calcium-binding proteins (S100A4, 8, 9, and 12) and molecules involved in redox metabolism (e.g., SOD1) partially support these findings (Table 1). Both Ca2+ signaling and redox metabolism have been implicated in the inhibition of T cell proliferation under hypoxia4,5,44,45.
In contrast, we also found genes clearly induced during hypoxia such as CD69, IL2RA, CD28, and NFATc1 were essential in T cell activation. CD69 has been reported to be upregulated with sustained expression under hypoxia after TCR stimulation, confirming our transcriptome results5. Further, we observed induction of genes coding for cytokines and growth factors such as proinflammatory IL-1ß, tumor necrosis factor-α, IL-6, IL-16, and PBEF and proangiogenic VEGF, MIF, IL-8, and CXCL1. All of these factors have proinflammatory properties functionally linked to RA pathogenesis11,44,46⇓⇓⇓⇓–51. We did not observe any effect on differential interferon-γ or IL-2 mRNA expression as reported by Caldwell, et al14.
To summarize our transcriptome profiling, we identified several novel genes as being hypoxia-modulated in CD4+ T cells, among them genes of the immune response such as cytokines and chemokines, their receptors, and associated signaling molecules. Among these genes, we observed that RA autoantigens such as KRT1, VIM, and GPI are induced by hypoxia.
Finally, we observed a clear correlation between mRNA expression and protein induction of HIF-1α, PBEF, GLUT1, and CXCL1 in PHA-stimulated CD4+ T cells by hypoxia (Figure 7). However, in quiescent CD4+ T cells, the transcriptional induction of PBEF under hypoxia was not seen to be accompanied by an increase at the protein level. Since we found the HIF-1 target GLUT-1 was also upregulated, we can rule out general hypoxia-induced inhibition of translation as reported in other studies26. Therefore, we assume a target-specific translational regulation process, favoring GLUT-1 to ensure glucose uptake. This finding implies a mechanism with a hierarchic distribution for translational priority in quiescent cells promoted by hypoxia, possibly as a method of setting the cells on alert to any immediate proper response.
We conclude that hypoxia is an important factor in the arthritic joint, influencing the transcriptional expression profile of synovial cells and infiltrating cells such as CD4+ T cells. Primary human CD4+ T cells were identified as having a comprehensive network of known and novel hypoxia-modulated genes, whereby the HIF-1 master regulates the adaptation to hypoxia. We propose that hypoxia might induce proinflammatory and proangiogenic humoral factors and receptors involved in T cell activation, and might suppress signaling events by altering gene expression of CD4+ T cells. Hypoxia and HIF-dependent mechanisms need to be taken into account when analyzing events during RA pathogenesis and consequently in the development of new therapeutic approaches.
Acknowledgment
We thank Manuela Jakstadt, Luzie Reiners-Schramm, and Agnes Weber for technical assistance. Microarray scanning and data analysis was kindly supported by H.-J. Mollenkopf. We also acknowledge Luk Van Parijs for use of the plasmid pLL3.7.
Footnotes
Supported by research grants 01GS0110, 01GS0160, and 01GS0413 through the National Genome Research Network (NGFN) from the German Federal Ministry of Education and Research for T. Gaber, T. Häupl, G. Sandig; by the Berlin-Brandenburg Center of Regenerative Therapies for T. Gaber.
- Accepted for publication July 13, 2009.


